January 2018 Climate Summary
|
|
|
- Frank Booth
- 6 years ago
- Views:
Transcription

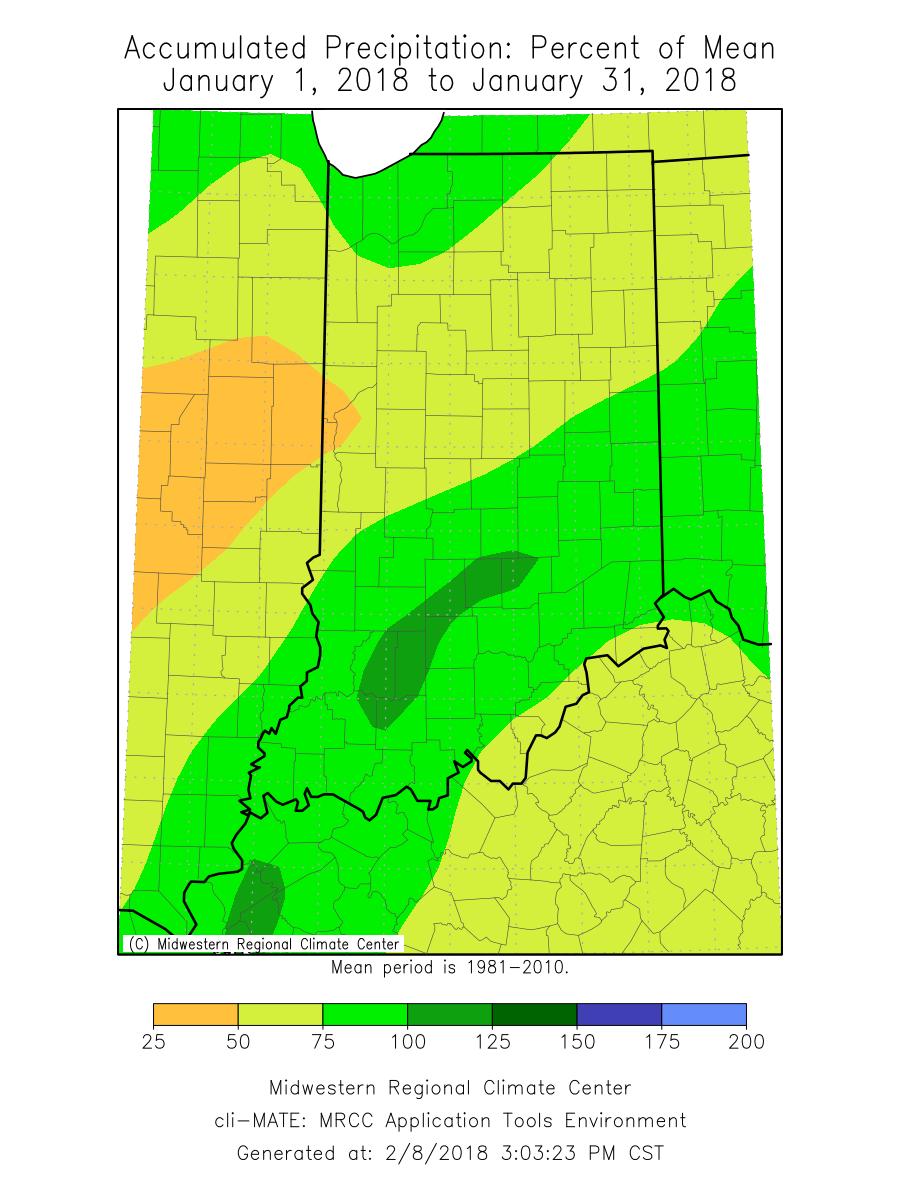
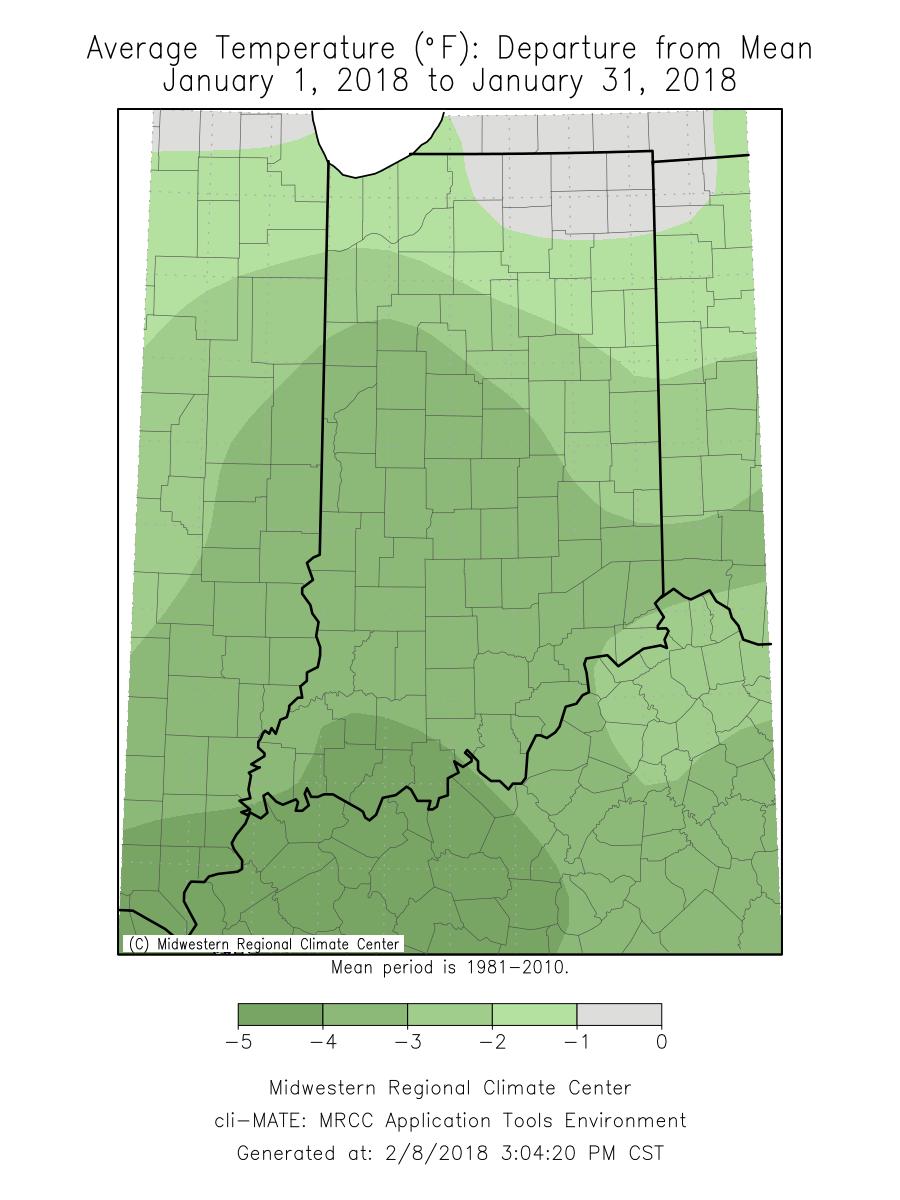
1 Ken Scheeringa and Andy Eggert Feb 8, 2018 (765) January 2018 Climate Summary Month Summary January temperature swings were amazing. In the first few days arctic cold pushed one local daily minimum to -29 F. In the second week a 21 F ramp up in state average temperature over 3 days was followed by a 39 F plunge the next 3 days! Yet an intensely cold first half of January was moderated by a warmer second half of the month. Huge temperature changes invited a mix of precipitation to occur on several January days, wreaking havoc on Indiana road travel. Hundreds of accidents on each of several days kept emergency services busy. At least 2 highway deaths in Laporte county were attributed to poor weather conditions. Thunderstorm gusts caused tree and house damage in 5 Indiana counties on January 22 nd. Monthly precipitation totals were actually lower than for a typical January. The January state average temperature was 24.4 F, the 42 nd coldest January on record. There were 5 years since 2000 that had colder Januaries. The most recent of these was in 2014 with its 19.4 F state average ranked as the 10 th coldest since The record coldest January was in 1977 when its 10.1 F state average temperature marked the start of 3 consecutive bitterly cold winters. The day split in January 2018 was 14 days of below normal temperature and 17 days above normal. There were 9 days when the daily state average temperature was 10 F or more above normal, 2 days 20 F or more above normal, 12 days of 10 F or more below normal, and 5 days with the state temperature 20 F or more below normal. The highest temperature of the month was 64 F at Shoals 8s on January 12 th. The coldest was -29 F on January 3 rd at Wanatah 2wnw. January state precipitation averaged to 2.08, which is 0.36 below normal. This ranks the month as the 52 nd driest January on record. The most recent January with less precipitation was in 2016, with a 1.34 state average. That January ranked as 17 th driest in Indiana. The driest January on record was in 1981 with a state average of just The heaviest single day precipitation among cooperative network stations was 2.00 on January 16 th at Myers Lock and Dam. The highest in the CoCoRaHS network was 1.85 on January 12 th at Francisco 0.1se. The largest month total in the cooperative network was 5.00 at Myers Lock and Dam. In the CoCoRaHS network the largest total was 4.21 at Ellettsville 0.5w. Widespread precipitation fell on about 11 days this month. Regionally January 2018 precipitation summed to near 75% of normal across northern Indiana, 85% in central, and about 95% of normal across the south. Normal January precipitation ranges from 1.9 in northwest Indiana to 3.1 in south central counties.
2 The largest single day snowfall among cooperative stations was 19.1 on January 5 th at Laporte. In the CoCoRaHS network it was 11.9 on January 23 rd at Laporte 1.6sw. The greatest month total in the cooperative network was 57.9 at Laporte and in the CoCoRaHS network 50.1 at Laporte 1.6sw. Widespread snow fell on about 4 days this month. January 1 st 7 th An arctic cold wave that gripped Indiana on Christmas Eve peaked in intensity on New Year s Day. Each successive day was then warmer than the day before, yet this week concluded with the state temperature still well below normal! The bitter cold air mass was very dry. Snow fell on 6 of the 7 days, but except near Lake Michigan, amounts were very light. The opportunity for widespread snowfall was limited as just one front passed through Indiana during the week. Heavy snowfall did impact Laporte county where schools and businesses were shut down on January 5 th. There was no change in Indiana soil dryness status according to the US Drought Monitor. A strong ridge of high pressure centered over Nebraska dominated the eastern two thirds of the nation on New Year s Day. The dense cold air mass over Indiana was refrigerated by snow cover, forcing the state temperature down to 29 F below normal, the coldest day of this week. A persistent warmup would begin the next day. The ridge drifted east to Illinois. The Indiana state temperature began a long slow climb, lifting to 27 F below normal. On January 3 rd the ridge accelerated east to Delaware, making way for a cold front to enter Illinois. Winds turned out of the south in Indiana and the state temperature rose to 24 F below normal. The cold front passed quickly through Indiana and reached the Atlantic coast the next day where a very strong storm offshore was in progress. Back in Indiana a narrow ridge stretching from Manitoba to Mississippi had cleared Indiana western skies but eastern Indiana was subject to the Atlantic coastal storm. The state temperature responded by climbing further to 20 F below normal where it would hold for 3 days. The Atlantic storm skirted north past New England on January 5 th. The Midwest ridge split in half with the southern part expanding southeast into the vacated region. The southern ridge dissolved the next day while the northern ridge moved from Manitoba to Iowa, taking control of Indiana weather. The Iowa ridge traveled east to Virginia on January 7 th. Its new location helped ramp up strong warm air advection into Indiana. The state temperature jumped to 10 F below normal as the week drew to a close. Over the 7 days the Indiana state temperature averaged to 22 F below normal. Usually to start off a new year daily maximum temperatures should vary from 32 F in far northern Indiana to 41 F in the southwest corner of the state. Daily minimums should range between 18 F and 24 F north to south across the state. The warmest temperature of the week among stations in the cooperative network was 43 F at Evansville Airport and Newburgh Lock on January 7 th. The coldest temperature among stations in this same network was -29 F at Wanatah 2wnw on January 3 rd.
3 Snowfall was recorded every day by CoCoRaHS network stations except on the morning of January 2 nd. Snow was noted in northeast Indiana on New Year s Day, in the lake effect region on January 3 rd, and in both regions on January 5 th and 6 th. The northern half of Indiana measured new snowfall on January 4 th while the northern tier of counties alone reported snowfall on January 7 th. On the weekly snowfall map no snow was recorded generally across the southern third of the state. North of roughly a Gary to Decatur line was an area of 8 to 30 of lake effect snowfall except along the Ohio border where totals were lighter. More than a foot of snow was noted in the heart of the lake effect region in Laporte, St Joseph, Marshall, and Starke counties. The very heaviest area as expected was in Laporte county. Among the heaviest single day snowfall amounts were reports on 3 days from a CoCoRaHS volunteer in Laporte of 10.1 on January 1 st, 9.9 on January 5 th, and 11.9 on January 6 th. Another Laporte volunteer had 7.0 on January 5 th and 9.0 on January 6 th. A short list of the heaviest weekly snow totals included 35.8 in Laporte, 9.9 near Walkerton, 8.1 and 7.5 from two South Bend area observers, and 6.7 in Plymouth. No rainfall was reported this week so precipitation consisted solely of the liquid equivalent of snowfall. On the precipitation map no amounts appeared on the southern third of the map, in most of west central, and in the eastern tier of counties of east central Indiana. Between 0.25 and 1.0 of liquid equivalent were in Laporte and St Joseph counties. Less than 0.2 was common in the remainder of the state. On a regional basis about 0.1 of precipitation fell on average across northern Indiana while less than 0.05 was received in central and southern sections. These totals equate to about 20% of normal in the north, 5% in central, and less than 1% in southern Indiana. The heaviest single day precipitation amounts included 0.34 at two Laporte locations on January 1 st, 0.60 in Granger and 0.34 at Laporte on January 5 th, and 0.45 also at Laporte on January 6 th. The heaviest week totals included two observers with 1.00 in Laporte, sums of 0.54 and 0.39 at two spots in Walkerton, and 0.28 outside South Bend. Laporte county is often considered the center of the Indiana snow belt. Amounts can increase dramatically over a few days as was the case this week when 25 of new snow was deposited in just 3 days. City offices and schools were closed on January 5 th due to heavy snowfall over the short duration of time. Major shopping centers also closed that day in response to the heavy lake effect snowfall. According to the January 9 th edition of the US Drought Monitor there was no change in the status of Indiana soil dryness in at least 3 weeks. The Indiana map indicated 6% of total land area was rated in the D0 abnormally dry category. The remaining 94% of Indiana area was classified in normal soil moisture status at the start of this new year.
4 January 8 th 14 th Indiana temperatures went on a ride as thrilling as a theme park roller coaster. A strong warming trend saw the Indiana state temperature rocket 21 F in 3 days, then plunge 39 F over the next 3 days! A snow cover meltdown with rain early in the week turned into freezing rain, sleet, and snow that made for treacherous travel conditions on January 12 th. The hardest hit areas were the northwest and southwest corners of the state where hundreds of slide-offs were reported. There were 2 traffic deaths in Laporte county with others injured. An ice jam caused flooding on the Kankakee River as the arctic cold settled in. A weak cold front entered northwest Indiana on January 8 th. Yet most of the state remained in a warm southerly wind flow behind high pressure centered in North Carolina. The state temperature jumped to 3 F above normal as snow fell in the northern half of the state and rain in the southern half. The next day the weak front zipped east into the Atlantic Ocean. The North Carolina high center sprawled westward into Indiana and continued pulling in warmer air, raising the state temperature to 11 F above normal. On January 10 th the ridge withdrew back to the Atlantic coast, stretching from North Carolina to New York. The warmup intensified to include the east half of the country. A warm front formed south of Hudson Bay ahead of a Manitoba storm system. The Indiana state temperature soared to 20 F above normal. The warmup peaked the next day with the state temperature at 24 F above normal. The coastal ridge had moved well off the Atlantic shore. A strong arctic air mass in Alberta began its push to the southeast. The leading edge of the intensely cold air mass was marked by a strong cold front that extended from Minnesota through Iowa, Kansas, and into Texas. The western edge of this narrow arctic air mass was bounded by the Rocky Mountains. The arctic invasion reached Indiana on January 12 th, announced by a wintry mix of precipitation. As brutal cold roared into the state the temperature fell dramatically to just 2 F above normal. The cold front marched east to Ohio. The core of the arctic air settled over Minnesota the next day. Indiana skies cleared and temperatures continued falling to 10 F below normal. The arctic front advanced east to the Atlantic coast.
5 The transfer of arctic cold into the Midwest continued January 14 th. High pressure was overhead Indiana and its neighbor states. The state temperature plummeted even further to 15 F below normal to close out the week. Over the 7 days the Indiana state temperature averaged to 5 F above normal. Usually in this second week of the year the daily maximum temperature should range between 31 F and 41 F north to south across the state. Daily minimums normally vary from 18 F in far northern Indiana to 24 F in the southwest corner of the state. The warmest temperature of the week among stations in the cooperative network was 64 F at Shoals 8s on January 12 th. The coolest temperature among stations in this same network was -10 F at Jamestown 2e on January 8 th. Precipitation was recorded on 6 out of 7 days and trended heavier southward across Indiana. Snowfall was measured on 4 days: in the north half of Indiana on January 8th, in the northwest half on January 12 th, statewide on January 13 th, and in north central and northeast Indiana the next day. Snow totals were heaviest in southwest Indiana where 4 to 6 fell. Up to 4 was noted in the northern two tiers of counties and in parts of east central Indiana. Less than one inch was common elsewhere. The heaviest single day snow amounts were measured on January 13 th and included 6.0 near Poseyville, and 5.5 at Francisco. Two CoCoRaHS volunteers in Boonville had 5.0 as did an observer in Celestine. For the week the Francisco station summed 5.5 of snow while three Boonville gages had 5.3, 5.0, and 4.8. The city of Washington tallied 5.1. Rainfall was caught on 6 days including in the southern half of Indiana on January 8 th and 9 th, statewide on January 10 th, in northern and central Indiana on January 11 th, and in the southeast half of the state on January 12 th. On the weekly precipitation map 2 to 3 occurred in much of southwest Indiana and from there in a northeast band toward Wayne county. More than an inch fell generally south of a Vincennes to Portland line. In contrast less than 0.5 was measured in the western tier of counties between Lake and Vermillion. Elsewhere 0.5 to 1.0 was common. The heaviest single day precipitation was noted in the morning CoCoRaHS reports of January 12 th and included 1.85 at Francisco, 1.75 near Connersville, 1.53 at Paoli, and 1.49 in Morgantown and Homer. The heaviest weekly totals were reported in Francisco with 2.73, Huntingburg at 2.67, Paoli with 2.41, near to Shoals with 2.40, and 2.39 outside Boonville. Regionally about 0.7 of precipitation averaged across northern Indiana, 1.2 in central, and 1.7 across the south. These amounts equate to about 160% of normal in the north, 280% in central, and 310% of normal in southern Indiana. The arctic blast on January 12 th that brought freezing rain, sleet, and snow to Indiana snarled highway travel. Two drivers were killed in Laporte county due to icy roads. One was killed when his car crashed into a semitrailer on the Indiana Toll Road. Two other people were injured and hospitalized. The roadway was closed for 4 hours for cleanup. A few hours later another driver was killed in a crash in Michigan City when her car hit a utility pole and flipped over, pinning her inside.
6 Road conditions were as bad or worse in southwest Indiana. Travel was banned in Gibson county. Travel watches were in effect in 18 Indiana counties that day. Several roads were closed due to the ice and snow. Travel problems continued on January 13 th. Police in Vanderburgh county responded to at least 300 calls of vehicle slide offs and crashes, including two with injuries. At the north end of the state Porter county police also handled many vehicle slide off calls. Meanwhile in Lake county an ice jam was forming in the Kankakee River causing flooding. According to the January 16 th edition of the US Drought Monitor there was no change in Indiana soil moisture status. Abnormally dry soils persist in west central and southwest Indiana, accounting for 6% of total land area. No moisture shortages were noted in the remaining 94% of Indiana land area. January 15 th 21 st Huge temperature swings between abnormal cold and warmth continued. The arctic cold wave reached its extreme on January 16 th. A remarkable warmup commenced the next day to the end of the week, an ascent of 36 F in state average temperature over 5 days! Precipitation which began the week as all snow converted to all rain at the close of the week. But first the highway havoc created by the arctic blast persisted with jackknifed semitrailers and vehicle slide-offs in northwest Indiana on January 16 th. In southwest Indiana schools were closed for a 7th consecutive day on January 18 th due to poor road conditions. The arctic ridge positioned over Indiana moved to the Atlantic coast on January 15 th. The Indiana state temperature warmed to 10 F below normal as winds behind the ridge turned out of the southeast. A new surge of arctic air headed south from Canada to the Dakotas behind an occluded front moving through Illinois. The front triggered another round of snowfall throughout Indiana. The next day the occluded front easily pushed through the state and into Pennsylvania. The arctic cold surged south from the Dakotas into Texas, spilling into Indiana to the east. The state temperature fell to 19 F below normal as snowfall continued statewide.
7 The arctic high center dove south to Oklahoma rather than east on January 17 th, far enough south to turn Indiana winds out of the southwest. This marked the start of a long warmup for Indiana. The state temperature lifted to 16 F below normal. The southern high center moved to Mississippi the next day, allowing skies to clear and warming to continue. There were no storm systems nearby to alter this pattern. The Indiana state temperature continued rising to 8 F below normal. The southern ridge became stationary on January 19 th. Under sunny skies the Indiana state temperature climb continued to 2 F above normal. A new storm system in Kansas developed a stationary front across Iowa and Wisconsin the next day while the southern ridge drifted east to Alabama. Yet the warmup persisted without interruption and the Indiana state temperature advanced up the thermometer to 10 F above normal with continued southwesterly wind flow. The southern high center drifted further east to Georgia on January 21 st, losing its influence on Indiana weather. The Iowa stationary front moved into central Indiana, setting off rain showers. The state temperature rose to 17 F above normal to close out the week. Over the 7 days the Indiana state temperature averaged to 4 F below normal. Typically at this time in January the daily maximum temperature should range from 31 F in far northern counties to 41 F in the far southwest. Daily minimums normally vary between 17 F and 24 F north to south across the state. The warmest temperature of the week among cooperative network stations was 56 F at the Evansville Airport and Paoli on January 21 st. The coolest temperature among stations in this same network was -14 F at Wanatah 2wnw on January 16 th. Snowfall was recorded on the first 3 days of the week and rainfall on the last day. Snow was observed statewide on January 15 th and 16 th and in the region near Lake Michigan on January 17 th. Snow totals for the week were in the 8 to 11 range in the lake effect counties of Porter, Laporte, and Starke. Totals between 1 and 5 were the most common elsewhere across the state. The heaviest single day snow amounts were measured in the January 17 th morning CoCoRaHS reports and included 8.2 at Hanna, 8.1 in Porter, 8.0 near Portage, and 7.0 just outside Chesterton and Wanatah. For the week Portage snowfall summed to 11.0 while Laporte and Hanna had Porter tallied 10.7 while 10.5 was noted just outside Valparaiso. Precipitation totals for the week were light statewide. Less than 0.1 was summed generally in west central and east central Indiana. About 0.5 was found in the lake effect counties of Porter, Laporte, Marshall, and Starke, and in spots of Marion and Orange counties. Precipitation between 0.1 and 0.5 was common elsewhere across the state. Regionally about 0.2 was noted on average across northern Indiana, 0.1 in central areas, and 0.3 across the south. These amounts equate to about 40% of normal in northern and southern Indiana and about 25% of normal in the central part of the state. Among the heavier single day precipitation reports were Columbia City with 0.50, Paoli at 0.47, and Bremen with 0.43 on January 15 th. The next day 0.40 was caught outside Columbus. On January 21 st the Bremen volunteer collected For the week the Paoli gage captured 0.54 while 0.53 accumulated at Columbia City, 0.52 at Valparaiso, 0.47 in Laporte, and 0.46 near Trail Creek. Continued snowfall early in the week prolonged travel nightmares on Indiana highways, especially in the northwest and southwest parts of the state. On January 16 th a semitrailer jackknifed on I-94

8 in Porter county. A crash occurred a short distance ahead of this accident. No serious injuries were noted. Reports of vehicle slide-offs and crashes in Porter, Laporte, and Starke counties continued to pile up. Travel advisories and watches were in effect in these counties as well as in Jasper county just to the south. In Vanderburgh county students were given an extended snow recess. Schools were off for 7 consecutive days in extreme southwest Indiana due to persistently poor road conditions. Classes were also cancelled in Posey county. The Indiana soil moisture status remained unchanged according to the January 23 rd edition of the US Drought Monitor. Two areas of the state, one in west central and the other in southwest Indiana, continued to show abnormally dry soil conditions. Coverage by D0 category status continued at 6% of total Indiana land area. January 22 nd 31 st A strong warmup that began after mid-january largely persisted to the end of the month. The state temperature average dipped below normal just once in the final 10 days. Two cooling cycles within this 10 day interval damped any huge swings in temperature that were evident in prior weeks. Precipitation was frequent but amounts were generally a little less than normal. Power outages in thunderstorms and fallen trees due to wind gusts in northern and central Indiana were reported on January 22 nd. Slick icy roads resulted in many vehicle crashes and slide offs with injuries on January 24 th. There was no status change in dry soils located in southwest Indiana according to the latest US Drought Monitor. Dual low pressure centers moved into Kansas and Iowa on January 22 nd. A stationary front extended east from the centers along the Indiana-Michigan border while its cold front dropped south from Missouri to Louisiana. This positioned Indiana in a warm sector. A separate cold front had advanced to central Michigan. The multiple fronts in the area generated thunderstorms and windy conditions over Indiana. The state temperature was very warm at 19 F above normal. The next day the Iowa center moved into Michigan, dragging its cold front through Indiana toward Pennsylvania. The old central Michigan front retreated a bit north but stalled as a stationary front. The Indiana state temperature plunged to 6 F above normal.
9 On January 24 th the stationary front drifted south again to the Indiana border. The front was close enough that the cooler air was able to layer into the warmer air mass still hanging over Indiana and cause an icy mess on its highways. The state temperature lowered to 2 F above normal. The air masses had mixed sufficiently that the stationary front dissolved the next day. Precipitation stopped and high pressure over Alabama began transporting warmer air to Indiana. The state temperature started climbing again to 6 F above normal. The southern ridge traveled to the Virginia coast on January 26 th. New low pressure over North Dakota pulled its warm front through Indiana and much of the eastern half of the country. Its paired cold front ran from the Dakotas south through Nebraska to Arizona. A massive warm sector covering much of the country east of the Rocky Mountains was in place. Warm air pumped by the Virginia ridge lifted the Indiana state temperature to 15 F above normal. On January 27 th the Virginia ridge moved offshore, allowing the North Dakota cold front to surge east from Illinois to Texas. Indiana remained in the warm sector but barely so. The state temperature peaked at 18 F above normal. The Illinois cold front passed through Indiana and eastward to West Virginia the next day where it slowed waiting for another low pressure center to ride the front from Tennessee northeastward. Yet another cold front entered northern Illinois close behind the first. Indiana was positioned between these two cold fronts. The state temperature began its second cold cycle of the 10 day interval, falling to 13 F above normal. Arctic air surged from Canada into South Dakota on January 29 th, forcing the latest Illinois cold front south through Indiana and beyond. As colder air poured into Indiana the state temperature plunged to 4 F above normal. The cold dome of arctic air drifted east to Wisconsin the next day, clearing Indiana skies and cooling Indiana temperatures to 1 F below normal, the first and only subnormal temperature day over the 10 day interval. The cool down was short lived. On January 31 st the arctic ridge advanced to the Atlantic coast. A strong low pressure system was winding up just north of Lake Superior and in tandem with the departing arctic ridge, tapped into warmer air over the southern states. The Indiana state temperature rebounded to 7 F above normal to close out the 10 day interval and the month of January. Over the 10 days the state temperature averaged to 9 F above normal. Typically in the final week of January the daily maximum temperature should vary between 31 F and 42 F north to south across the state. The daily minimum temperature normally ranges from 18 F in the far northern counties to 24 F in the southwest corner of the state. The warmest daily temperature of the 10 day interval was 61 F at Myers Lock and Shoals 8s on January 22 nd, and at Cannelton on January 23 rd, among stations in the cooperative station network. The coolest temperature was 7 F at Terre Haute ISU on January 23 rd among stations in this same network. Snow was observed on 5 days and rainfall on 7 of the 10 days this interval. The 10 day snowfall totals map shows little to no snow fell over much of the state, generally south of a Crown Point to Portland line, except for some which was recorded in Henry county. A 2 to 3 band of snow was seen across the northern tier of counties and in Marshall, Noble, Dekalb, and a portion of Allen county. Mostly lake effect snow was noted on January 23 rd and 24 th, in the northern county tier on January 29 th and 30 th, in northeast Indiana on January 30 th, and scattered in the east on January 25 th.
10 In Valparaiso the single heaviest daily snow amount was 2.0. The heaviest daily snowfall near South Bend was 1.3 while outside Elkhart it was 1.2 with 1.0 in Portage and North Webster. Among the heaviest 10 day totals were the Chesterton vicinity with 2.1, near Elkhart and Porter at 1.8, in Porter with 1.5, and 1.4 in the Goshen region. The 10 day precipitation map indicated a 1 to 2 region generally within a New Harmony to Danville to Nashville to Rockport line. But less than 0.5 was measured in the northeast, mostly east of an Elkhart to Lafayette to Muncie line. Totals between 0.5 and 1.0 were most common around the state. Regionally about 0.5 was noted in the northern and southern thirds of Indiana and about 0.6 in central sections. These amounts equate to about 80% of normal in northern and central Indiana, and 90% of normal across the south. Precipitation was recorded statewide on January 23 rd and 24 th, in north and central counties on January 22 nd, 25 th, and 30 th, in the southern half of the state on January 27 th, and in central and southern Indiana on January 28 th. The heaviest daily precipitation fell on several dates. The highest daily amount was 1.30 near Oolitic according to morning CoCoRaHS reports, 1.00 in the region around Columbia City, 0.86 near Spencer and Brook, and 0.83 at Montgomery. Some locations with the heaviest 10 day totals included Oolitic with 2.31, Ellettsville at 2.01, 1.62 near Milltown, 1.55 outside Spencer, and 1.51 in the Gosport vicinity. Early morning thunderstorms rolled through northwest Indiana on January 22 nd, causing some power outages and sudden rises in river levels. Further south trees were reported blown down by wind gusts in Miami, Grant, Delaware, Hamilton, and Putnam counties. A tree in Hamilton county was uprooted and fell on to a house. Small hail was observed in thunderstorms. After the cold front moved through icy roads due to freezing rain or drizzle and snow caused havoc on Indiana highways two days later. Freezing drizzle in Lake county caused a serious 3 car accident on I-80. A ramp was closed for several hours during cleanup. On I-65 also in Lake county, semi jackknifes, rollovers, and slide offs caused extended delays. To the east in Laporte county multiple crashes closed ramps to the Indiana Toll Road. In Elkhart county some cars crashed into previous accidents that were still along the roadway. In Jasper county traffic was backed up on I-65 due to multiple slide offs and crashes caused by black ice on the roadway. Some semitrailers had flipped over. Long delays were experienced in Carroll county which resulted from slide offs there as well. Howard county police noted 57 accidents and slide offs for the day, four of those with injuries. Hospitals reported several pedestrian slip and fall accidents there. Black ice on bridges and overpasses due to freezing drizzle and sleet were especially problematic. Early on January 24 th hundreds of schools were either delayed or closed and bus travel suspended in central Indiana. Many vehicle crashes and slide offs were reported throughout the region. Marion county reported more than 350 car accidents, some with injuries, including a jackknifed semitrailer. Some major Indianapolis downtown roads were closed for hours by numerous accidents. Indiana soil moisture status remained unchanged according to the January 30 th edition of the US Drought Monitor. Two areas of the state, one in west central and the other in southwest Indiana, continued to show abnormally dry soil conditions. Coverage by D0 category status continued at 6% of total Indiana land area.
11
12 January 2018 Temperature Region Temperature Normal Deviation Northwest North Central Northeast West Central Central East Central Southwest South Central Southeast State Precipitation Region Precipitation Normal Deviation Percent of Normal Northwest North Central Northeast West Central Central East Central Southwest South Central Southeast State
13 Winter so far (Dec - Jan) Temperature Region Temperature Normal Deviation Northwest North Central Northeast West Central Central East Central Southwest South Central Southeast State Precipitation Region Precipitation Normal Deviation Percent of Normal Northwest North Central Northeast West Central Central East Central Southwest South Central Southeast State
14 2018 Annual so far Temperature Region Temperature Normal Deviation Northwest North Central Northeast West Central Central East Central Southwest South Central Southeast State Precipitation Region Precipitation Normal Deviation Percent of Normal Northwest North Central Northeast West Central Central East Central Southwest South Central Southeast State
15
16
17

18 Drought Summary from the U.S. Drought Monitor Below is a drought summary for the state of Indiana from the U.S. Drought Monitor. Areas in white are not experiencing any drought. Yellow areas are abnormally dry, but not considered a drought. Drought begins when the moisture levels become more severe, with beige, orange, red, and brown indicating increasing levels of drought (moderate, severe, extreme, and exceptional, respectively). The table below indicates what percentage of the state is drought free, and how much of the state is in drought by degree of severity (D1 - D4 category).
19 Jan 2 nd Drought Summary
20 Jan 9 th Drought Summary
21 Jan 16 th Drought Summary
22 Jan 23 rd Drought Summary
23 Jan 30 th Drought Summary
October 2011 Climate Summary
 Ken Scheeringa and Kayla Hudson Nov 4, 2011 http://www.iclimate.org October 2011 Climate Summary Month Summary October weather evolved as a two part story. Weather conditions the first half of the month
March 2014 Climate Summary
 Ken Scheeringa And Matt Price Apr 8, 2014 (765) 494-8105 http://www.iclimate.org March 2014 Climate Summary Month Summary Winter had officially ended by the calendar but snow and cold persisted in Indiana
January 2017 Climate Summary
 Ken Scheeringa And Andy Eggert Feb 8, 2017 (765) 494-8105 http://www.iclimate.org January 2017 Climate Summary Month Summary The warmest January in 11 years was nearly 4 F warmer than December 2016. An
December 2011 Climate Summary
 Ken Scheeringa and Kayla Hudson Jan 17, 2012 (765) 494-8105 http://www.iclimate.org December 2011 Climate Summary Month Summary What a difference a year makes! A year ago the misery of a harsh, cold, and
January 2008 Climate Summary
 Joseph Mays (765) 494-6574 Feb 5, 2008 http://www.iclimate.org Summary January 2008 Climate Summary January was a mix bag of conditions, with an oscillatory pattern developing. We experienced phases of
November 2012 Climate Summary
 Ken Scheeringa and Kayla Hudson Dec 6, 2012 (765) 494-8105 http://www.iclimate.org November 2012 Climate Summary Month Summary November was one of those rare weather months in Indiana when not much happened:
November 2014 Climate Summary
 Ken Scheeringa And Matt Price Dec 10, 2014 (765) 494-8105 http://www.iclimate.org November 2014 Climate Summary Month Summary Unseasonable cold headlined the Indiana and national news in November. The
August 2017 Climate Summary
 Ken Scheeringa And Andy Eggert Sep 7, 2017 (765) 494-8105 http://www.iclimate.org August 2017 Climate Summary Month Summary The coolest August in 13 years featured long cool and warm spells, below normal
May 2018 Climate Summary
 Ken Scheeringa and Andy Eggert Jun 7, 2018 (765) 494-8105 http://www.iclimate.org May 2018 Climate Summary Month Summary As the calendar turned from April to May temperatures flipped dramatically away
March 2018 Climate Summary
 Ken Scheeringa and Andy Eggert Apr 5, 2018 (765) 494-8105 http://www.iclimate.org March 2018 Climate Summary Month Summary March turned cold with below normal temperatures on two-thirds of its days. Along
August 2013 Climate Summary
 Ken Scheeringa and Matt Price Sep 6, 2013 (765) 494-8105 http://www.iclimate.org August 2013 Climate Summary Month Summary August weather began cool and wet but became progressively warmer and drier through
July 2007 Climate Summary
 Dan Bowman (765) 494-6574 Sep 3, 2007 http://www.iclimate.org Summary July 2007 Climate Summary The month of July ended as a very unusual month. Many events occurred during the month of July that is not
August 2006 Summary. August 1-5
 Ashley Brooks (765) 494-6574 Sep 8, 2006 http://www.iclimate.org August 1-5 August 2006 Summary The heat wave that started during the end of July continued into the beginning parts of August with temperatures
September 2016 Climate Summary
 Ken Scheeringa And Andy Eggert Oct 6, 2016 (765) 494-8105 http://www.iclimate.org September 2016 Climate Summary Month Summary The warmest September in 77 years brought alternating weeks of dry and wet
March 2016 Climate Summary
 Ken Scheeringa And Andy Eggert Apr 8, 2016 (765) 494-8105 http://www.iclimate.org March 2016 Climate Summary Month Summary Count March as the 7 th month in a row that the state average temperature has
November 2010 Climate Summary
 Ken Scheeringa (765) 494-8105 Dec 6, 2010 http://www.iclimate.org November 2010 Climate Summary Summary A four month drought in Indiana is collapsing as significant rain fell the final week of November.
February 2017 Climate Summary
 Ken Scheeringa And Andy Eggert Mar 9, 2017 (765) 494-8105 http://www.iclimate.org February 2017 Climate Summary Month Summary February 2017 was the warmest February in Indiana since state climate records
October 2014 Climate Summary
 Ken Scheeringa And Matt Price Nov 10, 2014 (765) 494-8105 http://www.iclimate.org October 2014 Climate Summary Month Summary October featured a mix of weather. A very wet first half of the month evolved
April 2016 Climate Summary
 Ken Scheeringa And Andy Eggert May 9, 2016 (765) 494-8105 http://www.iclimate.org April 2016 Climate Summary Month Summary One month but two seasons. The first half of April was cold with snow. Wind damage
January 2012 Climate Summary
 Ken Scheeringa and Kayla Hudson Feb 6, 2012 (765) 494-8105 http://www.iclimate.org January 2012 Climate Summary Month Summary Where is winter? This question found its way into many conversations throughout
January 2013 Climate Summary
 Ken Scheeringa and Kayla Hudson Feb 7, 2013 (765) 494-8105 http://www.iclimate.org January 2013 Climate Summary Month Summary Winter or spring? January featured several dramatic swings in temperature and
November 2015 Climate Summary
 Ken Scheeringa And Mary Rose Mangan Dec 8, 2015 (765) 494-8105 http://www.iclimate.org November 2015 Climate Summary Month Summary November was much warmer than normal while precipitation was very near
April 2017 Climate Summary
 Ken Scheeringa And Andy Eggert May 8, 2017 (765) 494-8105 http://www.iclimate.org April 2017 Climate Summary Month Summary April was a very warm and wet month in Indiana, nearly setting a new monthly temperature
August 2015 Climate Summary
 Ken Scheeringa And Mary Rose Mangan Sep 4, 2015 (765) 494-8105 http://www.iclimate.org August 2015 Climate Summary Month Summary A very active wet summer weather pattern turned much calmer and drier in
October 2017 Climate Summary
 Ken Scheeringa and Andy Eggert Nov 6, 2017 (765) 494-8105 http://www.iclimate.org October 2017 Climate Summary Month Summary After more than three weeks of warm temperatures October turned suddenly cold
February 2016 Climate Summary
 Ken Scheeringa And Andy Eggert Mar 9, 2016 (765) 494-8105 http://www.iclimate.org February 2016 Climate Summary Month Summary February was the 6 th consecutive month with an above normal state average
September 2005 Climate Summary
 Ashley Brooks (765) 494-6574 Oct 5, 2005 http://iclimate.org September 2005 Climate Summary September 1-7 A cold front came through on the 1 st of the month, however little moisture was associated with
May 2005 Climate Summary
 Ashley Brooks (765) 494-6574 Jun 7, 2005 http://iclimate.org May 2005 Climate Summary May 1-5 Early May was characterized by an upper-level trough that was in place over Indiana that brought in very cool
October 2016 Climate Summary
 Ken Scheeringa And Andy Eggert Nov 9, 2016 (765) 494-8105 http://www.iclimate.org October 2016 Climate Summary Month Summary October was the 9 th month so far this year to average above normal in temperature.
September 2011 Climate Summary
 Ken Scheeringa and Kayla Hudson Oct 5, 2011 (765) 494-8105 http://www.iclimate.org September 2011 Climate Summary Month Summary The final blast of summer heat arrived at the start of September. It lasted
January 2006 Climate Summary
 Ashley Brooks (765) 494-6574 Feb 9, 2006 http://www.iclimate.org January 1-3 January 2006 Climate Summary Unseasonably warm conditions welcomed in the New Year with highs in the 40s across the northern
March 2009 Climate Summary
 Joseph Mays (765) 494-6574 Apr 1, 2009 http://www.iclimate.org Summary March 2009 Climate Summary March is in the books and it continued the trend of extreme weather we have experienced during the first
April 2015 Climate Summary
 Ken Scheeringa And Mary Rose Mangan May 8, 2015 http://www iclimate org April 2015 Climate Summary Month Summary April was a month of extremes. Severe weather erupted on 4 days of the first week with multiple
October 2012 Climate Summary
 Ken Scheeringa and Kayla Hudson Nov 8, 2012 (765) 494-8105 http://www.iclimate.org October 2012 Climate Summary Month Summary In a reversal from the hot and dry summer, cooler and wetter than normal conditions
May 2016 Climate Summary
 Ken Scheeringa And Andy Eggert Jun 6, 2016 (765) 494-8105 http://www.iclimate.org May 2016 Climate Summary Month Summary Cold weather dominated in May until the last week of the month. May began wet but
Monthly Long Range Weather Commentary Issued: APRIL 18, 2017 Steven A. Root, CCM, Chief Analytics Officer, Sr. VP,
 Monthly Long Range Weather Commentary Issued: APRIL 18, 2017 Steven A. Root, CCM, Chief Analytics Officer, Sr. VP, sroot@weatherbank.com MARCH 2017 Climate Highlights The Month in Review The average contiguous
W I N T E R STORM HAZARD DESCRIPTION
 W I N T E R STORM HAZARD DESCRIPTION... 1 LOCATION... 2 EXTENT... 2 HISTORICAL OCCURRENCES... 4 SIGNIFICANT PAST EVENTS... 4 PROBABILITY OF FUTURE EVENTS... 5 VULNERABILITY AND IMPACT... 5 HAZARD DESCRIPTION
Weather and Climate Summary and Forecast Summer 2017
 Weather and Climate Summary and Forecast Summer 2017 Gregory V. Jones Southern Oregon University August 4, 2017 July largely held true to forecast, although it ended with the start of one of the most extreme
April 2013 Climate Summary
 Ken Scheeringa and Kayla Hudson May 6, 2013 (765) 494-8105 http://www.iclimate.org April 2013 Climate Summary Month Summary Temperatures bounced high and low this month, keeping Hoosiers guessing which
November 2016 Climate Summary
 Ken Scheeringa And Andy Eggert Dec 15, 2016 (765) 494-8105 http://www.iclimate.org November 2016 Climate Summary Month Summary Unseasonably warm, pleasant, and sunny weather the first half of the month
Monthly Long Range Weather Commentary Issued: July 18, 2014 Steven A. Root, CCM, President/CEO
 Monthly Long Range Weather Commentary Issued: July 18, 2014 Steven A. Root, CCM, President/CEO sroot@weatherbank.com JUNE 2014 REVIEW Climate Highlights The Month in Review The average temperature for
Summary of November Central U.S. Winter Storm By Christopher Hedge
 Summary of November 12-13 2010 Central U.S. Winter Storm By Christopher Hedge Event Overview The first significant snowfall of the 2010-2011 season affected portions of the plains and upper Mississippi
May 2015 Climate Summary
 Ken Scheeringa And Mary Rose Mangan Jun 8, 2015 (765) 494-8105 http://www.iclimate.org May 2015 Climate Summary Month Summary May was a very warm month. Rainfall averaged near normal but was distributed
Monthly Long Range Weather Commentary Issued: SEPTEMBER 19, 2016 Steven A. Root, CCM, Chief Analytics Officer, Sr. VP,
 Monthly Long Range Weather Commentary Issued: SEPTEMBER 19, 2016 Steven A. Root, CCM, Chief Analytics Officer, Sr. VP, sroot@weatherbank.com SEPTEMBER 2016 Climate Highlights The Month in Review The contiguous
The Pennsylvania Observer
 The Pennsylvania Observer April 2, 2009 March 2009 Pennsylvania Weather Recap Prepared by Curt Harpster For the month of March the saying, In like a lion and out like a lamb really fit the pattern quite
The Pennsylvania Observer
 The Pennsylvania Observer October 1, 2015 September 2015 - Pennsylvania Weather Recap By: Quinn Lease The month of September will be remembered for its above normal temperatures and dry conditions that
The Pennsylvania Observer
 The Pennsylvania Observer January 5, 2009 December 2008 Pennsylvania Weather Recap The final month of 2008 was much wetter than average and a bit colder than normal. In spite of this combination, most
National Wildland Significant Fire Potential Outlook
 National Wildland Significant Fire Potential Outlook National Interagency Fire Center Predictive Services Issued: September, 2007 Wildland Fire Outlook September through December 2007 Significant fire
September 2012 Climate Summary
 Ken Scheeringa and Kayla Hudson Oct 5, 2012 (765) 494-8105 http://www.iclimate.org September 2012 Climate Summary Month Summary Summer slipped away and it felt a lot more like autumn in Indiana this month
Champaign-Urbana 1998 Annual Weather Summary
 Champaign-Urbana 1998 Annual Weather Summary ILLINOIS STATE WATER SURVEY Audrey Bryan, Weather Observer 2204 Griffith Dr. Champaign, IL 61820 wxobsrvr@sparc.sws.uiuc.edu The development of the El Nìno
2011 Year in Review TORNADOES
 2011 Year in Review The year 2011 had weather events that will be remembered for a long time. Two significant tornado outbreaks in April, widespread damage and power outages from Hurricane Irene in August
NWS FORM E-5 U.S. DEPARTMENT OF COMMERCE I HYDRO SERVICE AREA NOAA, NATIONAL WEATHER SERVICE I Indianapolis, IN MONTHLY REPORT
 NWS FORM E-5 U.S. DEPARTMENT OF COMMERCE I HYDRO SERVICE AREA NOAA, NATIONAL WEATHER SERVICE I Indianapolis, IN. 1-------------------- MONTHLY REPORT OF RIVER AND FLOOD CONDITIONSI REPORT FOR I November
Weather and Climate Summary and Forecast February 2018 Report
 Weather and Climate Summary and Forecast February 2018 Report Gregory V. Jones Linfield College February 5, 2018 Summary: For the majority of the month of January the persistent ridge of high pressure
Weather and Climate Summary and Forecast Winter
 Weather and Climate Summary and Forecast Winter 2016-17 Gregory V. Jones Southern Oregon University February 7, 2017 What a difference from last year at this time. Temperatures in January and February
June 2016 Climate Summary
 Ken Scheeringa And Andy Eggert Jul 8, 2016 (765) 494-8105 http://www.iclimate.org June 2016 Climate Summary Month Summary June was a warm month with below normal temperature on just 6 days. Rainfall was
The hydrologic service area (HSA) for this office covers Central Kentucky and South Central Indiana.
 for this office covers Central Kentucky and South Central Indiana.") January 2012 February 13, 2012 An X inside this box indicates that no flooding occurred within this hydrologic service area. January 2012 continued the string of wet months this winter. Rainfall was generally
January 2012 February 13, 2012 An X inside this box indicates that no flooding occurred within this hydrologic service area. January 2012 continued the string of wet months this winter. Rainfall was generally
The hydrologic service area (HSA) for this office covers Central Kentucky and South Central Indiana.
 for this office covers Central Kentucky and South Central Indiana.") MONTH YEAR January 2011 February 15, 2011 X An X inside this box indicates that no flooding occurred within this hydrologic service area. January 2011 was drier than normal in all locations in the area.
MONTH YEAR January 2011 February 15, 2011 X An X inside this box indicates that no flooding occurred within this hydrologic service area. January 2011 was drier than normal in all locations in the area.
HAZARD DESCRIPTION... 1 LOCATION... 1 EXTENT... 1 HISTORICAL OCCURRENCES...
 WINTER STORM HAZARD DESCRIPTION... 1 LOCATION... 1 EXTENT... 1 HISTORICAL OCCURRENCES... 3 SIGNIFICANT PAST EVENTS... 4 PROBABILITY OF FUTURE EVENTS... 5 VULNERABILITY AND IMPACT... 5 Hazard Description
March 2011 Climate Summary
 Ken Scheeringa (765) 494-8105 Apr 5, 2011 http://www.iclimate.org March 2011 Climate Summary Summary The fast paced weather action of February slowed some in March. The major March weather features were
Crop / Weather Update
 Crop / Weather Update Corn Crop Condition Percent of Acreage Rated Good or Excellent 85 80 75 70 65 60 55 50 45 The U.S. corn crop was rated 69% good-to-excellent on September 23, up 1% from week-ago,
November 2017 Climate Summary
 Ken Scheeringa and Andy Eggert Dec 8, 2017 (765) 494-8105 http://www.iclimate.org November 2017 Climate Summary Month Summary November temperatures alternated spells of warm and cool while precipitation
June 2010 Climate Summary
 Ken Scheeringa (765) 494-8105 Jul 6, 2010 http://www.iclimate.org June 2010 Climate Summary Summary Summer like heat and humidity arrived in Indiana on May 22 nd and dominated our weather scene nearly
Weather and Climate Summary and Forecast March 2018 Report
 Weather and Climate Summary and Forecast March 2018 Report Gregory V. Jones Linfield College March 7, 2018 Summary: The ridge pattern that brought drier and warmer conditions from December through most
Champaign-Urbana 1999 Annual Weather Summary
 Champaign-Urbana 1999 Annual Weather Summary ILLINOIS STATE WATER SURVEY 2204 Griffith Dr. Champaign, IL 61820 wxobsrvr@sws.uiuc.edu Maria Peters, Weather Observer A major snowstorm kicked off the new
Weather and Climate Summary and Forecast January 2018 Report
 Weather and Climate Summary and Forecast January 2018 Report Gregory V. Jones Linfield College January 5, 2018 Summary: A persistent ridge of high pressure over the west in December produced strong inversions
National Wildland Significant Fire Potential Outlook
 National Wildland Significant Fire Potential Outlook National Interagency Fire Center Predictive Services Issued: April 1, 2008 Next Issue: May 1, 2008 Wildland Fire Outlook April 2008 through July 2008
NATIONAL WEATHER SERVICE
 NWS Form E-5 (PRES. BY NWS Instruction 10-924) MONTHLY REPORT OF HYDROLOGIC CONDITIONS HYDROLOGIC SERVICE AREA (HSA) NORTHERN INDIANA (IWX) MONTH YEAR TO: Hydrologic Information Center, W/OS31 NOAA s National
L.O Students will learn about factors that influences the environment
 Name L.O Students will learn about factors that influences the environment Date 1. At the present time, glaciers occur mostly in areas of A) high latitude or high altitude B) low latitude or low altitude
Weather and Climate Summary and Forecast October 2017 Report
 Weather and Climate Summary and Forecast October 2017 Report Gregory V. Jones Linfield College October 4, 2017 Summary: Typical variability in September temperatures with the onset of fall conditions evident
Monthly Long Range Weather Commentary Issued: February 15, 2015 Steven A. Root, CCM, President/CEO
 Monthly Long Range Weather Commentary Issued: February 15, 2015 Steven A. Root, CCM, President/CEO sroot@weatherbank.com JANUARY 2015 Climate Highlights The Month in Review During January, the average
X An X inside this box indicates that no flooding occurred within this Hydrologic Service Area.
 NWS FORM E-5 U.S. DEPARTMENT OF COMMERCE HSA OFFICE: NOAA, NATIONAL WEATHER SERVICE MONTHLY REPORT OF RIVER AND FLOOD CONDITIONS DATE: TO: North Webster, IN REPORT FOR (MONTH &YEAR): January, 2003 February
Weather and Climate Summary and Forecast August 2018 Report
 Weather and Climate Summary and Forecast August 2018 Report Gregory V. Jones Linfield College August 5, 2018 Summary: July 2018 will likely go down as one of the top five warmest July s on record for many
Monthly Long Range Weather Commentary Issued: May 15, 2014 Steven A. Root, CCM, President/CEO
 Monthly Long Range Weather Commentary Issued: May 15, 2014 Steven A. Root, CCM, President/CEO sroot@weatherbank.com APRIL 2014 REVIEW Climate Highlights The Month in Review The average temperature for
NWS FORM E-5 U.S. DEPARTMENT OF COMMERCE HSA OFFICE:
 NWS FORM E-5 U.S. DEPARTMENT OF COMMERCE HSA OFFICE: NOAA, NATIONAL WEATHER SERVICE MONTHLY REPORT OF RIVER AND FLOOD CONDITIONS DATE: TO: North Webster, IN REPORT FOR (MONTH &YEAR): July 1998 August 5,
The Pennsylvania Observer
 The Pennsylvania Observer January 5, 2016 December 2015 - Pennsylvania Weather Recap By: Arthur Person December is the first of the three coldest months of the year. Sometimes it can be naughty, and sometimes
July 2014 Climate Summary
 Ken Scheeringa And Matt Price Aug 8, 2014 (765) 494-8105 http://www.iclimate.org July 2014 Climate Summary Month Summary July was unseasonably cool and drier than normal. Rainfall was light in parts of
NATIONAL WEATHER SERVICE
 NWS Form E-5 (PRES. BY NWS Instruction 10-924) MONTHLY REPORT OF HYDROLOGIC CONDITIONS HYDROLOGIC SERVICE AREA (HSA) MONTH YEAR TO: Hydrologic Information Center, W/OS31 NOAA s National Weather Service
Weather and Climate Summary and Forecast December 2017 Report
 Weather and Climate Summary and Forecast December 2017 Report Gregory V. Jones Linfield College December 5, 2017 Summary: November was relatively cool and wet from central California throughout most of
2012 Growing Season Weather Summary for North Dakota. Adnan Akyüz and Barbara A. Mullins Department of Soil Science October 30, 2012
 2012 Growing Season Weather Summary for North Dakota Adnan Akyüz and Barbara A. Mullins Department of Soil Science October 30, 2012 Introduction The 2012 growing season (the period from April through September)
New Hampshire State Climate Office Dr. Mary D. Stampone, State Climatologist
 New Hampshire State Climate Office Dr. Mary D. Stampone, State Climatologist University of New Hampshire c/o Department of Geography 73 Main Street Durham, NH 03824 Phone: 603-862-3136 Fax: 603-862-4362
Crop / Weather Update
 Crop / Weather Update Corn Crop Condition Percent of Acreage Rated Good or Excellent 85 80 75 70 65 60 55 50 45 As of September 9, USDA rates the crop at 68% good to excellent. The rating is up one point
Flood warnings were issued for the Maumee, St. Marys, Blanchard, St. Joseph (Ohio), Tippecanoe, Tiffin, Eel and Wabash Rivers on the 30 th and 31 st.
, Tippecanoe, Tiffin, Eel and Wabash Rivers on the 30 th and 31 st.") NWS FORM E-5 U.S. DEPARTMENT OF COMMERCE HSA OFFICE: NOAA, NATIONAL WEATHER SERVICE MONTHLY REPORT OF RIVER AND FLOOD CONDITIONS DATE: TO: North Webster, IN REPORT FOR (MONTH &YEAR): January 2002 February
NWS FORM E-5 U.S. DEPARTMENT OF COMMERCE HSA OFFICE: NOAA, NATIONAL WEATHER SERVICE MONTHLY REPORT OF RIVER AND FLOOD CONDITIONS DATE: TO: North Webster, IN REPORT FOR (MONTH &YEAR): January 2002 February
The hydrologic service area (HSA) for this office covers Central Kentucky and South Central Indiana.
 for this office covers Central Kentucky and South Central Indiana.") NWS Form E-5 (04-2006) NATIONAL OCEANIC AND ATMOSPHERIC ADMINISTRATION (PRES. BY NWS Instruction 10-924) NATIONAL WEATHER SERVICE MONTHLY REPORT OF HYDROLOGIC CONDITIONS HYDROLOGIC SERVICE AREA (HSA) Louisville
NWS Form E-5 (04-2006) NATIONAL OCEANIC AND ATMOSPHERIC ADMINISTRATION (PRES. BY NWS Instruction 10-924) NATIONAL WEATHER SERVICE MONTHLY REPORT OF HYDROLOGIC CONDITIONS HYDROLOGIC SERVICE AREA (HSA) Louisville
SEPTEMBER 2013 REVIEW
 Monthly Long Range Weather Commentary Issued: October 21, 2013 Steven A. Root, CCM, President/CEO sroot@weatherbank.com SEPTEMBER 2013 REVIEW Climate Highlights The Month in Review The average temperature
Arizona Climate Summary May 2012
 Arizona Climate Summary May 2012 Summary of conditions for April 2012 April 2012 Temperature and Precipitation Summary April 1 st 16 th : Although April began with another low pressure system sweeping
August 2016 Climate Summary
 Ken Scheeringa And Andy Eggert Sep 12, 2016 (765) 494-8105 http://www.iclimate.org August 2016 Climate Summary Month Summary Hot but tranquil weather the first half of August transitioned to a tormented
The Pennsylvania Observer
 The Pennsylvania Observer September 3, 2008 Summer 2008 Weather Summary Written by: Brian Thompson The opening days of June started dry, but a warm front brought a widespread rain a couple of days into
Weather and Climate Summary and Forecast November 2017 Report
 Weather and Climate Summary and Forecast November 2017 Report Gregory V. Jones Linfield College November 7, 2017 Summary: October was relatively cool and wet north, while warm and very dry south. Dry conditions
July 2011 Climate Summary
 Ken Scheeringa (765) 494-8105 Aug 8, 2011 http://www.iclimate.org July 2011 Climate Summary Month Summary The upper atmospheric high pressure dome which baked the Texas area in heat and drought the past
The Pennsylvania Observer
 The Pennsylvania Observer August 3, 2015 July 2015 - Pennsylvania Weather Recap By: Arthur Person Although this seventh month of 2015 was fairly normal across Pennsylvania as a whole, the details reveal
Weather and Climate Summary and Forecast October 2018 Report
 Weather and Climate Summary and Forecast October 2018 Report Gregory V. Jones Linfield College October 4, 2018 Summary: Much of Washington, Oregon, coastal California and the Bay Area and delta region
Guided Notes Weather. Part 2: Meteorology Air Masses Fronts Weather Maps Storms Storm Preparation
 Guided Notes Weather Part 2: Meteorology Air Masses Fronts Weather Maps Storms Storm Preparation The map below shows North America and its surrounding bodies of water. Country borders are shown. On the
Crop / Weather Update
 Crop / Weather Update Corn Crop Condition Percent of Acreage Rated Good or Excellent 85 80 75 70 65 60 55 50 45 Corn condition this week is the same as the last two weeks in the good/excellent category,
JEFF JOHNSON S Winter Weather Outlook
 JEFF JOHNSON S 2017-2018 Winter Weather Outlook TABLE OF CONTENTS ABOUT THE AUTHOR Components of the seasonal outlook... 2 ENSO state/ocean temperatures... 3 Sub-seasonal outlooks... 4 Forecast models...
Weather and Climate Summary and Forecast March 2019 Report
 Weather and Climate Summary and Forecast March 2019 Report Gregory V. Jones Linfield College March 2, 2019 Summary: Dramatic flip from a mild winter to a top five coldest February on record in many locations
Arizona Climate Summary February 2012
 Arizona Climate Summary February 2012 Summary of conditions for January 2012 January 2012 Temperature and Precipitation Summary January 1 st 20 th : The New Year has started on a very dry note. The La
Colorado CoCoRaHS. Colorado CoCoRaHS. Because Every Drop Counts! November 2014 Volume 2, Issue 11
 U.S. PRECIPITATION (% OF AVERAGE) LOOKING BACK AT OCTOBER 2014 October was a fairly dry month for much of the nation with the exception of the Pacific Northwest, portions of New England and the Tennessee
July 2010 Climate Summary
 Ken Scheeringa (765) 494-8105 Aug 4, 2010 http://www.iclimate.org July 2010 Climate Summary Summary The warm summer of 2010 continues. Daily state average temperatures were above normal on all but seven
SIGNIFICANT EVENTS Severe Storms November 1994 January 1996 August 1998 and May 2000 March 2002 May 2002 Champaign County
 SIGNIFICANT EVENTS Severe Storms November 1994 On Nov. 1, 1994, high winds gusted over 60 mph at times across the northwest third of Ohio. The highest measured wind gust was 63 mph at Columbus Grove (Putnam).
The Pennsylvania Observer
 The Pennsylvania Observer May 31, 2012 May 2012 - Pennsylvania Weather Recap By: Paul Knight The majority of the fifth month had temperatures averaging well above seasonal levels with two distinct hot