August 2013 Climate Summary
|
|
|
- Matthew Ross
- 5 years ago
- Views:
Transcription

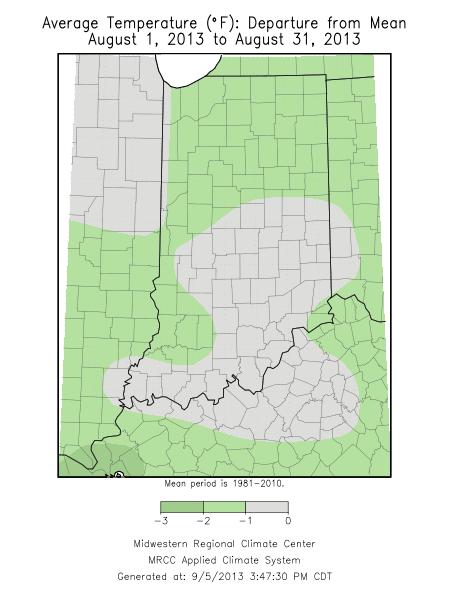
1 Ken Scheeringa and Matt Price Sep 6, 2013 (765) August 2013 Climate Summary Month Summary August weather began cool and wet but became progressively warmer and drier through the month. The overall cooler than normal conditions limited severe weather to mostly minor events on a handful of August days. A heat wave with little rainfall developed the last week of the month. The previous heat wave had occurred more than 5 weeks earlier, an indicator of how cool this late summer has been. The late month heat and dryness has hurt Indiana crops which at the start of this month were forecast to produce record or near record yields. The August state average temperature was 72.1 F, or 0.6 F below normal. This ties 5 other years as the 44 th coolest August in Indiana since state records began in August of last year was slightly cooler at 72.0 F as the 2012 drought relented. Some other recent cool Augusts include 2009 at 71.7 F, tied for 19 th coolest, and 2008 with its 71.0 F coming in at 24 th place. August 2004 was quite cool, ranking in 4 th place with 68.6 F, but the coldest August on record was a 67.2 value of long ago in The day split in August 2013 was 13 days of below normal temperature, 15 days above normal, and 3 days right at normal. The daily state average temperature was 10 F or more below normal on 2 days. A scorching 100 recorded at the Evansville Museum on August 30 th was the warmest official temperature in the state this month. Wanatah was again the cold spot in Indiana with a 40 F reading on August 16 th. August state precipitation averaged 1.84 inch, or 1.94 inch below normal. This ranks August 2013 as the 3 rd driest August on record. In 2 nd place is August 1996 with a 1.67 inch state average. Some other recent dry Augusts include a 1.87 inch value in 2010, good for 4 th place. In August 2008 the state number was 2.08 inches, coming in at 9 th driest. The all-time driest August was in 1897 when only 1.59 inch was recorded. Regionally August 2013 precipitation was about 75% of normal in northern Indiana, and about 40% of normal in central and southern counties. Normal August precipitation is about 3.8 inches statewide. The highest single day precipitation this month came on August 3 rd at Warsaw when the cooperative station there reported 3.60 inches and the nearby CoCoRaHS station posted 4.97 inches. Widespread rain fell on about 10 days this month. Severe weather occurred on August 2 nd, 7 th, 12 th, 30 th, and 31 st. causing minor damage. Details on all these storms can be found in the weekly narratives which follow. Abnormal dryness in 6 east-central Indiana counties as noted in the August 6 th edition of the US Drought Monitor was erased by rains the following week. But rainfall after mid-august came less often, allowing abnormal dryness to return to the central third of Indiana and to four extreme northwest counties. This situation persisted to the end of the month.
2 August 1 st 10 th A series of weak cold fronts dipped southward into Indiana to start off August. A mostly zonal jet stream pattern in the upper atmosphere has impacted these fronts on their journey, causing slowing and eventual stalls into stationary fronts over our state. State average temperatures fell just a few degrees with each frontal passage. The first 6 days of August were a little cooler than normal, then a warm up followed to the end of the 10 day period. Rain fell every day at least somewhere in the state but the only significant amounts were tallied on August 3 rd and 9 th. The month began with state average temperatures just a shade cool at 1 F below normal as a first cold front crossed Indiana. This cold front raced to the Atlantic shore the next day, pushed from behind by a high pressure center that quickly moved southeast of Indiana. A second cold front was already on the move toward Illinois but stalled in northern Indiana on August 3 rd. State temperatures held steady at about 3 F below normal. The next day strong Canadian high pressure kick started the stationary front into a cold front that traveled to the Gulf states. Indiana temperatures fell to their coldest of the 10 day interval at 6 F below normal. Cool but pleasant Canadian air was transported into our state. On August 5 th and 6 th the ridge slid east to New England. Indiana temperatures now rebounded to normal on southerly winds, peaking at nearly 3 F above normal by August 7 th. Indiana was then squeezed by a new cold front to the north and warm front south of the state, triggering locally severe weather in a few far northern counties. This third cold front slowed to a stop in southern Indiana on August 9 th. The stationary front remained there to the end of the 10 day interval. Daily state average temperatures held at 1 F to 2 F above normal after August 7 th. Overall for the 10 days the state temperature averaged about 1 F below normal. In this first August week daily maximum temperatures normally range between 82 F in far northern Indiana to 88 F in the far southwest. Daily minimums typically will vary between 63 F and 67 F north to south across the state. Rainfall was noted somewhere in Indiana on all 10 days and except for two days amounts were light. Moderate to heavy rainfall was noted the morning of August 3 rd, trending heavier northward. Some of the heaviest local rainfall of all 10 days fell on that day as recorded by CoCoRaHS observers in Kosciusko county. Two volunteers in Warsaw measured 4.97 and 4.63 inches. Two Leesburg gages collected 4.44 and 4.42 inches. A Fort Wayne CoCoRaHS observer had 4.33 inches. Reports on August 9 th showed central and southern Indiana had received about a half inch in this later event. Regional totals for the 10 days in northern Indiana averaged about 2.1 inches, while 1.3 inches fell in central sections, and 0.8 inch covered the south. These totals equate to about 170% of normal in northern Indiana, near normal in central, and 60% of normal in southern Indiana. A Laporte observer accumulated the most rainfall over the 10 days with 5.87 inches. In northeast Indiana some 10 day totals included the two Leesburg observers with 5.71 and 5.26 inches, 4.07 inches in Columbia City, and 4.02 inches in Fort Wayne. The slowing of the second cold front into a stationary system caused locally severe weather in a few northern counties late on August 2 nd. Very heavy rain in north central and northeast Indiana caused flooding of creeks, streams, and underpasses in Kosciusko, Marshall, and Fulton counties. In
3 Kosciusko and Wabash counties high winds tore down many trees. In Allen county trees fell on power lines. On August 7 th the squeeze play put on by cold and warm fronts near Indiana resulted in another round of local severe weather. In St Joseph and Marshall counties, 60 mph gusts were reported with 1.25 inch diameter hail. High winds in Noble county caused trees to fall on power lines which blocked local roads. Locally heavy rains hammered the northeast but showers missed dry soils in eastern Indiana. The August 6 th edition of the US Drought Monitor indicated no improvement in the abnormally dry (D0 category) soils of six eastern Indiana counties: Wayne, Union, Fayette, Henry, Rush, and Hancock. The dryness in this region is considered short term by the Drought Monitor and is expected to be eliminated by future rain events. Some agricultural experts are predicting a near record Indiana corn crop this year if the weather continues to be highly favorable. The August 5 th edition of the Indiana Crop and Weather Report notes recent weather has been nearly ideal for crop development. August 11 th 17 th This week overall was much cooler than normal but quite pleasant for summer. Very little rain fell even as cooler temperatures arrived, resulting in a mostly dry week. A stationary front drifted south of the Ohio River on August 11 th. Weak high pressure moved in but was coaxed eastward the next day as two warm fronts, one along the Michigan border and the other on the Ohio River, squeezed Indiana between them. Daily state temperatures were right about normal. The weather map changed markedly on August 13 th as very strong high pressure in Manitoba converted the two warm fronts surrounding Indiana into cold fronts. The first cold front had already passed the state by early August 13 th. The second cold front was right behind the first in central Indiana. Daily state temperatures fell to 5 F below normal. By the next day the strong Canadian ridge had claimed the eastern two-thirds of the country, clearing storms from Indiana and the
4 Midwest. State temperatures sank further, bottoming out at 13 F below normal, the coldest of the week. The ridge moved rapidly east of Indiana on August 15 th and a gradual warm up commenced to the end of the week. Temperatures had risen to 12 F below normal and continued rising to 9 F below normal by August 16 th. That same day a reinforcement of high pressure dipped out of Canada into the Midwest, forcing storm systems and their fronts further from Indiana. Daily state temperatures continued to rise, however, ending the week nearly 6 F below normal. Overall for the week the state temperature averaged 6 F below normal. Typically in mid-august daily maximum temperatures should vary between 81 F and 88 F north to south across the state. Normal daily minimums should range from 62 F in far northern counties to 66 F in far southwest Indiana. Rainfall was scarce this week. Amounts were very light before the two cold fronts arrived on August 13 th, and afterward generally less than a quarter inch was noted. The second half of the week was dry as high pressure suppressed storm development throughout Indiana. For the week regional rainfall totals were about 0.2 inch in northern Indiana, less than 0.1 inch in central sections, and about 0.4 inch across southern Indiana. These totals equate to about 20% of normal in the north, 5% of normal in central counties, and about half of normal in southern areas. The highest single day rainfall amounts were measured on August 13 th, mostly in southern Indiana. That morning Holland recorded 1.31 inch, Leopold 1.26 inch, New Salisbury 1.21 inch, and Boonville 1.20 inch. For the week overall the largest totals were found in southwest Indiana and a few more spots elsewhere. Fredericksburg had 1.80 inch, Holland 1.31 inch, Leopold 1.27 inch and New Salisbury 1.21 inch for the week. Crown Point in northwest Indiana received 1.13 inch. Only one minor report of storm damage was recorded this week. On August 12 th gusty winds blew down a tree in Floyd county just before the cold fronts moved through. The general lack of normal rainfall late in the week is not considered in the August 13 th US Drought Monitor assessment. This early week report has eliminated the east central Indiana abnormally dry area and returned the entire state to normal soil moisture status.
5 August 18 th 24 th It was a quiet weather week with only a single front passing through Indiana. The inactivity kept rainfall totals low while temperatures stayed fairly close to normal all week long. The previous week was cold and temperatures were on the rebound to start this week. On August 18 th a large high pressure ridge was centered over Pennsylvania, sending southerly winds over Indiana to continue the warming trend the first half of this week. Daily state average temperatures rose from 4 F below normal to right at normal by August 20 th. The expanding ridge was now rebuilding westward into Missouri, pushing back a front in South Dakota and extending Indiana s fair weather spell a few more days. This allowed the warming to continue until August 21 st when temperatures peaked for the week at 3 F above normal. The next day the ridge began to relent and a storm system moved closer into Wisconsin. Temperatures now began a slow decline the rest of the week as clouds and rainfall replaced the sunshine. On August 23 rd the cold front pushed through Indiana. A new high pressure center entered the Great Lakes and shuttled northeast of Indiana as the week came to an end. State temperatures drifted only slightly lower, ending the week at normal. Overall for the week Indiana temperatures averaged to normal. Usually at this point in August daily maximum temperatures should range between 81 F and 88 F north to south across the state. Daily minimums normally vary from 62 F in far northern Indiana to 65 F in the far southwest. In the upper atmosphere a strong massive high pressure ridge nearly dominated the country coast to coast this week. In the Midwest a small upper trough of low pressure allowed storms to develop yet kept rainfall amounts scattered and mostly light. Tiny amounts of rain fell several days this week statewide except for heavier amounts on two days when nearly a half inch fell generally in northern Indiana. Regional totals for the week ranged from about 0.4 inch across northern Indiana with about 0.1 inch elsewhere. These totals are about half of normal in the north and less than 20% of normal in central and southern Indiana. There were locally heavier amounts mostly in northeast Indiana. On the morning of August 23 rd three CoCoRaHS volunteers in Bluffton reported 2.12 inches, 2.02 inches, and 1.55 inch. A Laporte observer had 1.62 inch while 1.50 inch was noted in New Carlisle. The largest totals in the state for the week were only slightly more at these same locations. The August 20 th edition of the US Drought Monitor indicated a large area of abnormal soil dryness had reappeared and covered 38% of the state. Nearly all of central Indiana, portions of 30 counties, were in this abnormally dry status (D0 category) along with Lake, Porter, Newton, and Jasper counties in northwest Indiana. The same coverage continues in Indiana in the August 27 th edition of US Drought Monitor. The Indiana Weather and Crop report also notes that soil water had been rapidly depleted by August 24 th. In its soil moisture survey the USDA concluded that Indiana top soils were 55% short or very short of moisture. Subsoils were rated at 44% in these same categories. Irrigation was running at full capacity as corn on light soils was showing stress. Soybeans are in the pod fill stage and are in need of rain. While livestock remain in mostly good condition due to the recent mild temperatures, pasture and hay were deteriorating.
6 August 25 th 31 st The first heat wave to invade Indiana since mid-july and the ongoing dry spell highlight this final week of the month. A maximum temperature of 100 F was recorded on August 30 th at the Evansville Museum, the hottest reading in the state all month. Rainfall amounts have been meager statewide since the last significant rains in early August. At the start of the week a massive ridge in the upper atmosphere dominated nearly all the continental US states except in the Pacific northwest and New England. High pressure at ground level generated lots of heat and sunshine but little rainfall. Daily temperatures had climbed steadily over 4 days, initially at 1 F above normal before peaking at 8 F above normal on August 28 th. The upper ridge then retreated southwest, allowing a stationary front to sag to the southern Michigan border. This front drifted southward the next day to the Ohio River. A new weather system came on scene on August 31 st, sending its warm front across Indiana. On these last 3 days of the week the state average temperature held steady at nearly 7 F above normal. Typically at this time of year daily maximum temperatures should vary between 80 F in northern Indiana to 87 F in the far southwest. Normal daily minimum temperatures range between 60 F and 64 F this last week of August. Clouds and rainfall are suppressed by the sinking air flow inside a high pressure system. No rain was observed this week through August 27 th and then daily amounts were generally tiny until August 31 st. A few tenths of an inch were recorded that morning except for larger amounts in locally heavy showers. Two CoCoRaHS observers in Hebron measured 1.31 inch and 1.00 inch that day. A gage in Fishers collected 1.19 inch. In Highland 0.98 inch fell and a Crown Point volunteer noted 0.96 inch. Regionally for the week about 0.1 inch of rain fell in northern and central counties while 0.2 inch was recorded in the south. These totals equate to just 10% of normal in northern and central Indiana and 20% of normal in the south. Severe weather broke out on August 30 th and 31 st during the passage of the last warm front. Trees were forced down in Lake county on August 30 th. The next day the weather action moved to central and southern Indiana. One inch hail was observed in Marion county. More typical were reports of wind gust damage. In the far southwest, power lines came down in Knox and Vanderburgh

7 counties while many tree limbs were ripped to the ground in Gibson and Vanderburgh counties. Wind gusts to 60 mph downed trees and power lines in Putnam county. In Jefferson county besides tree damage a home lost its shingles and siding, and metal objects were thrown high into the air. An analysis of the Jefferson county event concluded the damage there was caused by a microburst. There were no significant changes in the US Drought Monitor rating of Indiana soil conditions in its August 27 th edition. About 38% of the state continued to be classified as abnormally dry (D0 category). The heat and dry weather this week stressed corn and soybean fields. The September 3 rd edition of the USDA Indiana Weather and Crops report stated that corn is being forced to mature earlier than expected. Corn condition is rated at 66% good to excellent. Soybeans are turning color and moving faster to maturity but are also stressed due to disease issues and spider mites. Soybean condition is rated at 62% good to excellent. Livestock are in mostly good condition showing only minor heat stress. Pastures have declined to just 36% rated in good to excellent condition. The weekly soil moisture survey results show topsoils are drying out with 65% now rated short of very short of moisture. Subsoils have deteriorated to 56% short or very short of moisture.
8 August 2013 Temperature Region Temperature Normal Deviation Northwest North Central Northeast West Central Central East Central Southwest South Central Southeast State Precipitation Region Precipitation Normal Deviation Percent of Normal Northwest North Central Northeast West Central Central East Central Southwest South Central Southeast State
9 Summer (June - August) Temperature Region Temperature Normal Deviation Northwest North Central Northeast West Central Central East Central Southwest South Central Southeast State Precipitation Region Precipitation Normal Deviation Percent of Normal Northwest North Central Northeast West Central Central East Central Southwest South Central Southeast State
10 2013 Annual (through August) Temperature Region Temperature Normal Deviation Northwest North Central Northeast West Central Central East Central Southwest South Central Southeast State Precipitation Region Precipitation Normal Deviation Percent of Normal Northwest North Central Northeast West Central Central East Central Southwest South Central Southeast State
11
12
13

14 Drought Summary from the U.S. Drought Monitor Below is a drought summary for the state of Indiana from the U.S. drought monitor. Areas in white are not experiencing any drought. Yellow areas are abnormally dry, but not considered a drought. Drought begins when the moisture levels become more severe, with beige, orange, red, and brown indicating increasing levels of drought (moderate, severe, extreme, and exceptional, respectively). The table below indicates how much of the state is not under drought conditions, and also how much of the state is under drought conditions from its respective column upwards. For example, August 27 th has 37.6% of Indiana under at least D0- D4 status. Normal soil moisture status (Nothing) for this time of year existed in 62.4% of all Indiana area. There were no other drought categories active at that time so D0 stands at 37.6% coverage. The D0 category (abnormally dry) is not a drought category in and of itself. Therefore there was no drought anywhere in Indiana on this date.
15 August 6 th Drought Summary
16 August 13 th Drought Summary

17 August 20 th Drought Summary
18 August 27 th Drought Summary
October 2011 Climate Summary
 Ken Scheeringa and Kayla Hudson Nov 4, 2011 http://www.iclimate.org October 2011 Climate Summary Month Summary October weather evolved as a two part story. Weather conditions the first half of the month
July 2007 Climate Summary
 Dan Bowman (765) 494-6574 Sep 3, 2007 http://www.iclimate.org Summary July 2007 Climate Summary The month of July ended as a very unusual month. Many events occurred during the month of July that is not
November 2012 Climate Summary
 Ken Scheeringa and Kayla Hudson Dec 6, 2012 (765) 494-8105 http://www.iclimate.org November 2012 Climate Summary Month Summary November was one of those rare weather months in Indiana when not much happened:
December 2011 Climate Summary
 Ken Scheeringa and Kayla Hudson Jan 17, 2012 (765) 494-8105 http://www.iclimate.org December 2011 Climate Summary Month Summary What a difference a year makes! A year ago the misery of a harsh, cold, and
August 2017 Climate Summary
 Ken Scheeringa And Andy Eggert Sep 7, 2017 (765) 494-8105 http://www.iclimate.org August 2017 Climate Summary Month Summary The coolest August in 13 years featured long cool and warm spells, below normal
August 2006 Summary. August 1-5
 Ashley Brooks (765) 494-6574 Sep 8, 2006 http://www.iclimate.org August 1-5 August 2006 Summary The heat wave that started during the end of July continued into the beginning parts of August with temperatures
January 2008 Climate Summary
 Joseph Mays (765) 494-6574 Feb 5, 2008 http://www.iclimate.org Summary January 2008 Climate Summary January was a mix bag of conditions, with an oscillatory pattern developing. We experienced phases of
March 2014 Climate Summary
 Ken Scheeringa And Matt Price Apr 8, 2014 (765) 494-8105 http://www.iclimate.org March 2014 Climate Summary Month Summary Winter had officially ended by the calendar but snow and cold persisted in Indiana
September 2011 Climate Summary
 Ken Scheeringa and Kayla Hudson Oct 5, 2011 (765) 494-8105 http://www.iclimate.org September 2011 Climate Summary Month Summary The final blast of summer heat arrived at the start of September. It lasted
May 2016 Climate Summary
 Ken Scheeringa And Andy Eggert Jun 6, 2016 (765) 494-8105 http://www.iclimate.org May 2016 Climate Summary Month Summary Cold weather dominated in May until the last week of the month. May began wet but
September 2016 Climate Summary
 Ken Scheeringa And Andy Eggert Oct 6, 2016 (765) 494-8105 http://www.iclimate.org September 2016 Climate Summary Month Summary The warmest September in 77 years brought alternating weeks of dry and wet
May 2005 Climate Summary
 Ashley Brooks (765) 494-6574 Jun 7, 2005 http://iclimate.org May 2005 Climate Summary May 1-5 Early May was characterized by an upper-level trough that was in place over Indiana that brought in very cool
January 2006 Climate Summary
 Ashley Brooks (765) 494-6574 Feb 9, 2006 http://www.iclimate.org January 1-3 January 2006 Climate Summary Unseasonably warm conditions welcomed in the New Year with highs in the 40s across the northern
August 2015 Climate Summary
 Ken Scheeringa And Mary Rose Mangan Sep 4, 2015 (765) 494-8105 http://www.iclimate.org August 2015 Climate Summary Month Summary A very active wet summer weather pattern turned much calmer and drier in
September 2012 Climate Summary
 Ken Scheeringa and Kayla Hudson Oct 5, 2012 (765) 494-8105 http://www.iclimate.org September 2012 Climate Summary Month Summary Summer slipped away and it felt a lot more like autumn in Indiana this month
May 2018 Climate Summary
 Ken Scheeringa and Andy Eggert Jun 7, 2018 (765) 494-8105 http://www.iclimate.org May 2018 Climate Summary Month Summary As the calendar turned from April to May temperatures flipped dramatically away
October 2014 Climate Summary
 Ken Scheeringa And Matt Price Nov 10, 2014 (765) 494-8105 http://www.iclimate.org October 2014 Climate Summary Month Summary October featured a mix of weather. A very wet first half of the month evolved
May 2015 Climate Summary
 Ken Scheeringa And Mary Rose Mangan Jun 8, 2015 (765) 494-8105 http://www.iclimate.org May 2015 Climate Summary Month Summary May was a very warm month. Rainfall averaged near normal but was distributed
October 2012 Climate Summary
 Ken Scheeringa and Kayla Hudson Nov 8, 2012 (765) 494-8105 http://www.iclimate.org October 2012 Climate Summary Month Summary In a reversal from the hot and dry summer, cooler and wetter than normal conditions
October 2016 Climate Summary
 Ken Scheeringa And Andy Eggert Nov 9, 2016 (765) 494-8105 http://www.iclimate.org October 2016 Climate Summary Month Summary October was the 9 th month so far this year to average above normal in temperature.
The hydrologic service area (HSA) for this office covers Central Kentucky and South Central Indiana.
 for this office covers Central Kentucky and South Central Indiana.") January 2012 February 13, 2012 An X inside this box indicates that no flooding occurred within this hydrologic service area. January 2012 continued the string of wet months this winter. Rainfall was generally
January 2012 February 13, 2012 An X inside this box indicates that no flooding occurred within this hydrologic service area. January 2012 continued the string of wet months this winter. Rainfall was generally
September 2005 Climate Summary
 Ashley Brooks (765) 494-6574 Oct 5, 2005 http://iclimate.org September 2005 Climate Summary September 1-7 A cold front came through on the 1 st of the month, however little moisture was associated with
November 2015 Climate Summary
 Ken Scheeringa And Mary Rose Mangan Dec 8, 2015 (765) 494-8105 http://www.iclimate.org November 2015 Climate Summary Month Summary November was much warmer than normal while precipitation was very near
2012 Growing Season Weather Summary for North Dakota. Adnan Akyüz and Barbara A. Mullins Department of Soil Science October 30, 2012
 2012 Growing Season Weather Summary for North Dakota Adnan Akyüz and Barbara A. Mullins Department of Soil Science October 30, 2012 Introduction The 2012 growing season (the period from April through September)
The Pennsylvania Observer
 The Pennsylvania Observer August 3, 2015 July 2015 - Pennsylvania Weather Recap By: Arthur Person Although this seventh month of 2015 was fairly normal across Pennsylvania as a whole, the details reveal
The Pennsylvania Observer
 The Pennsylvania Observer October 1, 2015 September 2015 - Pennsylvania Weather Recap By: Quinn Lease The month of September will be remembered for its above normal temperatures and dry conditions that
January 2017 Climate Summary
 Ken Scheeringa And Andy Eggert Feb 8, 2017 (765) 494-8105 http://www.iclimate.org January 2017 Climate Summary Month Summary The warmest January in 11 years was nearly 4 F warmer than December 2016. An
2011 Year in Review TORNADOES
 2011 Year in Review The year 2011 had weather events that will be remembered for a long time. Two significant tornado outbreaks in April, widespread damage and power outages from Hurricane Irene in August
WeatherManager Weekly
 Issue 288 July 14, 2016 WeatherManager Weekly Industries We Serve Agriculture Energy/Utilities Construction Transportation Retail Our Weather Protection Products Standard Temperature Products Lowest Daily
April 2013 Climate Summary
 Ken Scheeringa and Kayla Hudson May 6, 2013 (765) 494-8105 http://www.iclimate.org April 2013 Climate Summary Month Summary Temperatures bounced high and low this month, keeping Hoosiers guessing which
NWS FORM E-5 U.S. DEPARTMENT OF COMMERCE HSA OFFICE:
 NWS FORM E-5 U.S. DEPARTMENT OF COMMERCE HSA OFFICE: NOAA, NATIONAL WEATHER SERVICE MONTHLY REPORT OF RIVER AND FLOOD CONDITIONS DATE: TO: North Webster, IN REPORT FOR (MONTH &YEAR): July 1998 August 5,
October 2017 Climate Summary
 Ken Scheeringa and Andy Eggert Nov 6, 2017 (765) 494-8105 http://www.iclimate.org October 2017 Climate Summary Month Summary After more than three weeks of warm temperatures October turned suddenly cold
July 2010 Climate Summary
 Ken Scheeringa (765) 494-8105 Aug 4, 2010 http://www.iclimate.org July 2010 Climate Summary Summary The warm summer of 2010 continues. Daily state average temperatures were above normal on all but seven
UNITED STATES AND SOUTH AMERICA OUTLOOK (FULL REPORT) Wednesday, April 18, 2018
 Wednesday, April 18, 2018") T-storm Weather Summary Coolness continues over the next week in much of the central U.S., most likely producing the coldest April since 1907 in the Corn Belt, but followed by seasonable to mild weather
T-storm Weather Summary Coolness continues over the next week in much of the central U.S., most likely producing the coldest April since 1907 in the Corn Belt, but followed by seasonable to mild weather
National Drought Summary August 14, 2018
 National Drought Summary August 14, 2018 The discussion in the Looking Ahead section is a description of what the official national guidance from the National Weather Service (NWS) National Centers for
Weather and Climate Summary and Forecast October 2017 Report
 Weather and Climate Summary and Forecast October 2017 Report Gregory V. Jones Linfield College October 4, 2017 Summary: Typical variability in September temperatures with the onset of fall conditions evident
November 2010 Climate Summary
 Ken Scheeringa (765) 494-8105 Dec 6, 2010 http://www.iclimate.org November 2010 Climate Summary Summary A four month drought in Indiana is collapsing as significant rain fell the final week of November.
Monthly Long Range Weather Commentary Issued: July 18, 2014 Steven A. Root, CCM, President/CEO
 Monthly Long Range Weather Commentary Issued: July 18, 2014 Steven A. Root, CCM, President/CEO sroot@weatherbank.com JUNE 2014 REVIEW Climate Highlights The Month in Review The average temperature for
June 2016 Climate Summary
 Ken Scheeringa And Andy Eggert Jul 8, 2016 (765) 494-8105 http://www.iclimate.org June 2016 Climate Summary Month Summary June was a warm month with below normal temperature on just 6 days. Rainfall was
November 2014 Climate Summary
 Ken Scheeringa And Matt Price Dec 10, 2014 (765) 494-8105 http://www.iclimate.org November 2014 Climate Summary Month Summary Unseasonable cold headlined the Indiana and national news in November. The
The Pennsylvania Observer
 The Pennsylvania Observer April 2, 2009 March 2009 Pennsylvania Weather Recap Prepared by Curt Harpster For the month of March the saying, In like a lion and out like a lamb really fit the pattern quite
March 2009 Climate Summary
 Joseph Mays (765) 494-6574 Apr 1, 2009 http://www.iclimate.org Summary March 2009 Climate Summary March is in the books and it continued the trend of extreme weather we have experienced during the first
The hydrologic service area (HSA) for this office covers Central Kentucky and South Central Indiana.
 for this office covers Central Kentucky and South Central Indiana.") MONTH YEAR January 2011 February 15, 2011 X An X inside this box indicates that no flooding occurred within this hydrologic service area. January 2011 was drier than normal in all locations in the area.
MONTH YEAR January 2011 February 15, 2011 X An X inside this box indicates that no flooding occurred within this hydrologic service area. January 2011 was drier than normal in all locations in the area.
March 2016 Climate Summary
 Ken Scheeringa And Andy Eggert Apr 8, 2016 (765) 494-8105 http://www.iclimate.org March 2016 Climate Summary Month Summary Count March as the 7 th month in a row that the state average temperature has
The Pennsylvania Observer
 The Pennsylvania Observer September 3, 2008 Summer 2008 Weather Summary Written by: Brian Thompson The opening days of June started dry, but a warm front brought a widespread rain a couple of days into
April 2015 Climate Summary
 Ken Scheeringa And Mary Rose Mangan May 8, 2015 http://www iclimate org April 2015 Climate Summary Month Summary April was a month of extremes. Severe weather erupted on 4 days of the first week with multiple
The Pennsylvania Observer
 The Pennsylvania Observer May 31, 2012 May 2012 - Pennsylvania Weather Recap By: Paul Knight The majority of the fifth month had temperatures averaging well above seasonal levels with two distinct hot
UNITED STATES AND SOUTH AMERICA WEATHER ROUNDUP Sunday, December 17, 2017
 T-storm Weather Summary Extreme heat was followed by heavy rain in some key areas of Argentina yesterday. T-storms affect much of the driest Argentina, southern Brazil, and Paraguay through 7 to 10 days,
Weather and Climate Summary and Forecast Summer 2017
 Weather and Climate Summary and Forecast Summer 2017 Gregory V. Jones Southern Oregon University August 4, 2017 July largely held true to forecast, although it ended with the start of one of the most extreme
UNITED STATES AND SOUTH AMERICA OUTLOOK (FULL REPORT) Thursday, December 28, 2017
 Thursday, December 28, 2017") T-storm Weather Summary Despite scattered t-storms Sat.-Sun. in central and northern areas in Argentina, more will likely be needed especially in sunflower areas of the southwest. Some t-storms likely
T-storm Weather Summary Despite scattered t-storms Sat.-Sun. in central and northern areas in Argentina, more will likely be needed especially in sunflower areas of the southwest. Some t-storms likely
February 2017 Climate Summary
 Ken Scheeringa And Andy Eggert Mar 9, 2017 (765) 494-8105 http://www.iclimate.org February 2017 Climate Summary Month Summary February 2017 was the warmest February in Indiana since state climate records
July 2011 Climate Summary
 Ken Scheeringa (765) 494-8105 Aug 8, 2011 http://www.iclimate.org July 2011 Climate Summary Month Summary The upper atmospheric high pressure dome which baked the Texas area in heat and drought the past
NATIONAL WEATHER SERVICE
 January 2016 February 9, 2016 This was a dry month across the HSA despite one large and several smaller snowfalls. Most locations ended up 1-2 inches below normal for the month. The driest locations at
Champaign-Urbana 1998 Annual Weather Summary
 Champaign-Urbana 1998 Annual Weather Summary ILLINOIS STATE WATER SURVEY Audrey Bryan, Weather Observer 2204 Griffith Dr. Champaign, IL 61820 wxobsrvr@sparc.sws.uiuc.edu The development of the El Nìno
MIAMI-SOUTH FLORIDA National Weather Service Forecast Office
 MIAMI-SOUTH FLORIDA National Weather Service Forecast Office http://www.weather.gov/miami June 2015 South Florida Weather Summary Dry East, Wet West...Drought Remains SE Florida July 3, 2015: Depending
KANSAS CLIMATE SUMMARY August 2015
 KANSAS CLIMATE SUMMARY August 2015 Cool and Dry August was drier than normal in most of the state. State-wide average precipitation was 2.80 inches or 85 percent of normal. The Northeast division of the
Nebraska experienced a wide
 Issue 1 August 2016 CLIMATE UPDATE A MONTHLY SUMMARY FROM THE neclimate.unl.edu August saw reprieve from dryness, cooler temps Overview Nebraska experienced a wide range of conditions across the state
Arizona Climate Summary May 2012
 Arizona Climate Summary May 2012 Summary of conditions for April 2012 April 2012 Temperature and Precipitation Summary April 1 st 16 th : Although April began with another low pressure system sweeping
April 2017 Climate Summary
 Ken Scheeringa And Andy Eggert May 8, 2017 (765) 494-8105 http://www.iclimate.org April 2017 Climate Summary Month Summary April was a very warm and wet month in Indiana, nearly setting a new monthly temperature
NWS FORM E-5 U.S. DEPARTMENT OF COMMERCE I HYDRO SERVICE AREA NOAA, NATIONAL WEATHER SERVICE I Indianapolis, IN MONTHLY REPORT
 NWS FORM E-5 U.S. DEPARTMENT OF COMMERCE I HYDRO SERVICE AREA NOAA, NATIONAL WEATHER SERVICE I Indianapolis, IN. 1-------------------- MONTHLY REPORT OF RIVER AND FLOOD CONDITIONSI REPORT FOR I November
June 2010 Climate Summary
 Ken Scheeringa (765) 494-8105 Jul 6, 2010 http://www.iclimate.org June 2010 Climate Summary Summary Summer like heat and humidity arrived in Indiana on May 22 nd and dominated our weather scene nearly
Weather and Climate Summary and Forecast August 2018 Report
 Weather and Climate Summary and Forecast August 2018 Report Gregory V. Jones Linfield College August 5, 2018 Summary: July 2018 will likely go down as one of the top five warmest July s on record for many
Weather and Climate Summary and Forecast March 2018 Report
 Weather and Climate Summary and Forecast March 2018 Report Gregory V. Jones Linfield College March 7, 2018 Summary: The ridge pattern that brought drier and warmer conditions from December through most
January 25, Summary
 January 25, 2013 Summary Precipitation since the December 17, 2012, Drought Update has been slightly below average in parts of central and northern Illinois and above average in southern Illinois. Soil
National Wildland Significant Fire Potential Outlook
 National Wildland Significant Fire Potential Outlook National Interagency Fire Center Predictive Services Issued: September, 2007 Wildland Fire Outlook September through December 2007 Significant fire
Weather and Climate Summary and Forecast January 2019 Report
 Weather and Climate Summary and Forecast January 2019 Report Gregory V. Jones Linfield College January 4, 2019 Summary: December was mild and dry over much of the west, while the east was much warmer than
November 2016 Climate Summary
 Ken Scheeringa And Andy Eggert Dec 15, 2016 (765) 494-8105 http://www.iclimate.org November 2016 Climate Summary Month Summary Unseasonably warm, pleasant, and sunny weather the first half of the month
UNITED STATES AND SOUTH AMERICA SNAPSHOT REPORT Thursday, December 21, 2017
 T-storm Weather Summary A small but key corn and soybean area in western Argentina was wetter than expected overnight. T-storms affect varying areas of South America at varying times into January, but
CropCast Corn and Soybean Report Kenny Miller Tuesday, March 14, 2017
 Accumulated Rainfall (inches) Accumulated GDDs Temperature ( F)/Wind Speed (mph) Precipitation (inches) CropCast Corn and Soybean Report Kenny Miller Tuesday, March 14, 2017 Peoria, IL Regional Forecast
CropCast Corn and Soybean Report Kyle Tapley Monday, March 20, 2017
 Accumulated Rainfall (inches) Accumulated GDDs Temperature ( F)/Wind Speed (mph) Precipitation (inches) CropCast Corn and Soybean Report Kyle Tapley Monday, March 20, 2017 Peoria, IL Regional Forecast
What a Hurricane Needs to Develop
 Weather Weather is the current atmospheric conditions, such as air temperature, wind speed, wind direction, cloud cover, precipitation, relative humidity, air pressure, etc. 8.10B: global patterns of atmospheric
UNITED STATES AND SOUTH AMERICA SNAPSHOT REPORT Wednesday, December 20, 2017
 T-storm Weather Summary T-storms affect all growing areas of South America at one time or another over the next two weeks, but abovenormal rainfall is only likely for corn and soybeans in southern Brazil
CropCast Corn and Soybean Report Kenny Miller Friday, March 17, 2017
 Accumulated Rainfall (inches) Accumulated GDDs Temperature ( F)/Wind Speed (mph) Precipitation (inches) CropCast Corn and Soybean Report Kenny Miller Friday, March 17, 2017 Peoria, IL Regional Forecast
TFS WEATHER BRIEF. Monday, March 25
 TFS WEATHER BRIEF Monday, March 25 Review: The leading edge of cooler and drier air was pushing through Central and East TX this morning. A few lingering thunderstorms were in progress south of I-20 in
NIDIS Intermountain West Drought Early Warning System October 17, 2017
 NIDIS Drought and Water Assessment NIDIS Intermountain West Drought Early Warning System October 17, 2017 Precipitation The images above use daily precipitation statistics from NWS COOP, CoCoRaHS, and
Weather and Climate Summary and Forecast December 2017 Report
 Weather and Climate Summary and Forecast December 2017 Report Gregory V. Jones Linfield College December 5, 2017 Summary: November was relatively cool and wet from central California throughout most of
The Pennsylvania Observer
 The Pennsylvania Observer January 5, 2016 December 2015 - Pennsylvania Weather Recap By: Arthur Person December is the first of the three coldest months of the year. Sometimes it can be naughty, and sometimes
SEPTEMBER 2013 REVIEW
 Monthly Long Range Weather Commentary Issued: October 21, 2013 Steven A. Root, CCM, President/CEO sroot@weatherbank.com SEPTEMBER 2013 REVIEW Climate Highlights The Month in Review The average temperature
Table 1. August average temperatures and departures from normal ( F) for selected cities.
 for selected cities.") Climate Summary for Florida August 2016 Prepared by Lydia Stefanova and David Zierden Florida Climate Center, The Florida State University, Tallahassee, Florida Online at: http://climatecenter.fsu.edu/products-services/summaries
Climate Summary for Florida August 2016 Prepared by Lydia Stefanova and David Zierden Florida Climate Center, The Florida State University, Tallahassee, Florida Online at: http://climatecenter.fsu.edu/products-services/summaries
Foundations of Earth Science, 6e Lutgens, Tarbuck, & Tasa
 Foundations of Earth Science, 6e Lutgens, Tarbuck, & Tasa Weather Patterns and Severe Weather Foundations, 6e - Chapter 14 Stan Hatfield Southwestern Illinois College Air masses Characteristics Large body
Weather and Climate Risks and Effects on Agriculture
 Weather and Climate Risks and Effects on Agriculture Dr. Eric Snodgrass Official Journal of the Fluid Fertilizer Foundation Vol. 26, No. 2, Issue #100 DOWNLOAD Summary: So, what do we need to watch for?
August 2016 Climate Summary
 Ken Scheeringa And Andy Eggert Sep 12, 2016 (765) 494-8105 http://www.iclimate.org August 2016 Climate Summary Month Summary Hot but tranquil weather the first half of August transitioned to a tormented
Monthly Long Range Weather Commentary Issued: May 15, 2014 Steven A. Root, CCM, President/CEO
 Monthly Long Range Weather Commentary Issued: May 15, 2014 Steven A. Root, CCM, President/CEO sroot@weatherbank.com APRIL 2014 REVIEW Climate Highlights The Month in Review The average temperature for
The Pennsylvania Observer
 The Pennsylvania Observer January 5, 2009 December 2008 Pennsylvania Weather Recap The final month of 2008 was much wetter than average and a bit colder than normal. In spite of this combination, most
Weather and Climate Summary and Forecast February 2018 Report
 Weather and Climate Summary and Forecast February 2018 Report Gregory V. Jones Linfield College February 5, 2018 Summary: For the majority of the month of January the persistent ridge of high pressure
Champaign-Urbana 1999 Annual Weather Summary
 Champaign-Urbana 1999 Annual Weather Summary ILLINOIS STATE WATER SURVEY 2204 Griffith Dr. Champaign, IL 61820 wxobsrvr@sws.uiuc.edu Maria Peters, Weather Observer A major snowstorm kicked off the new
Monthly Long Range Weather Commentary Issued: SEPTEMBER 19, 2016 Steven A. Root, CCM, Chief Analytics Officer, Sr. VP,
 Monthly Long Range Weather Commentary Issued: SEPTEMBER 19, 2016 Steven A. Root, CCM, Chief Analytics Officer, Sr. VP, sroot@weatherbank.com SEPTEMBER 2016 Climate Highlights The Month in Review The contiguous
April 2016 Climate Summary
 Ken Scheeringa And Andy Eggert May 9, 2016 (765) 494-8105 http://www.iclimate.org April 2016 Climate Summary Month Summary One month but two seasons. The first half of April was cold with snow. Wind damage
Monthly Long Range Weather Commentary Issued: February 15, 2015 Steven A. Root, CCM, President/CEO
 Monthly Long Range Weather Commentary Issued: February 15, 2015 Steven A. Root, CCM, President/CEO sroot@weatherbank.com JANUARY 2015 Climate Highlights The Month in Review During January, the average
Climate versus Weather
 Climate versus Weather What is climate? Climate is the average weather usually taken over a 30-year time period for a particular region and time period. Climate is not the same as weather, but rather,
Fronts. Direction of Front
 Fronts Direction of Front Direction of Front Warm Front A cold air mass meets and displaces a warm air mass. Because the moving cold air is more dense, it moves under the less-dense warm air, pushing it
Air Masses, Fronts, Storm Systems, and the Jet Stream
 Air Masses, Fronts, Storm Systems, and the Jet Stream Air Masses When a large bubble of air remains over a specific area of Earth long enough to take on the temperature and humidity characteristics of
Precipitation. Standardized Precipitation Index. NIDIS Intermountain West Drought Early Warning System September 5, 2017
 9/6/2017 NIDIS Drought and Water Assessment NIDIS Intermountain West Drought Early Warning System September 5, 2017 Precipitation The images above use daily precipitation statistics from NWS COOP, CoCoRaHS,
but 2012 was dry Most farmers pulled in a crop
 After a winter that wasn t, conditions late in the year pointed to a return to normal snow and cold conditions Most farmers pulled in a crop but 2012 was dry b y M i k e Wr o b l e w s k i, w e a t h e
January 2012 Climate Summary
 Ken Scheeringa and Kayla Hudson Feb 6, 2012 (765) 494-8105 http://www.iclimate.org January 2012 Climate Summary Month Summary Where is winter? This question found its way into many conversations throughout
NIDIS Weekly Climate, Water and Drought Assessment Summary. Upper Colorado River Basin
 NIDIS Weekly Climate, Water and Drought Assessment Summary Upper Colorado River Basin August 3, 2010 Precipitation and Snowpack Fig. 1: July precipitation in inches Fig. 2: July precip as percent of average
Weather and Climate Summary and Forecast January 2018 Report
 Weather and Climate Summary and Forecast January 2018 Report Gregory V. Jones Linfield College January 5, 2018 Summary: A persistent ridge of high pressure over the west in December produced strong inversions
NIDIS Weekly Climate, Water and Drought Assessment Summary. Upper Colorado River Basin July 31, 2012
 NIDIS Weekly Climate, Water and Drought Assessment Summary Upper Colorado River Basin July 31, 2012 Fig. 1: July month-to-date precipitation in inches. Fig. 2: SNOTEL WYTD precipitation percentiles (50%
Impacts of the April 2013 Mean trough over central North America
 Impacts of the April 2013 Mean trough over central North America By Richard H. Grumm National Weather Service State College, PA Abstract: The mean 500 hpa flow over North America featured a trough over
Arizona Climate Summary
 August 2015 Temperature and Precipitation Summary Arizona Climate Summary September 2015 Summary of conditions for August 2015 August 1 st 16 th : August was a wet month across the state with only 3 days