September 2012 Climate Summary
|
|
|
- Stanley Fleming
- 5 years ago
- Views:
Transcription

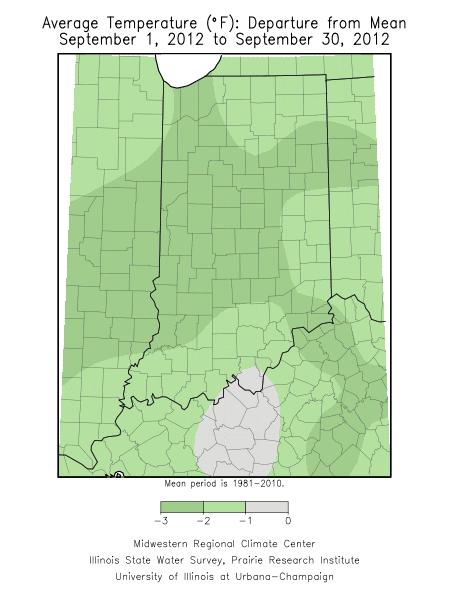
1 Ken Scheeringa and Kayla Hudson Oct 5, 2012 (765) September 2012 Climate Summary Month Summary Summer slipped away and it felt a lot more like autumn in Indiana this month with cool temperatures and much above normal rainfall. The remnants of Hurricane Isaac didn t live up to the hype at the start of the month, spawning a tornado nobody even noticed and at most delivering about 4.5 inches of rainfall. There were 4 severe weather days in September, all but one of these during the first week. The cool and wet weather trend helped relieve but not eliminate Indiana drought conditions. At the end of the month corn harvest was 8 days ahead of schedule and mandatory burn bans remain in just 3 Indiana counties. The first autumn freeze occurred at a few locations on September 24 th. The state average September temperature was 64.2 F, a cool 1.5 F below normal. This created a 4- way tie with 1937, 1950, and 1994, as the 29 th coolest September on record. The most recent cooler September in 2006 had a 62.4 F temperature, ranking in 8 th place. Other recent cool Septembers include a 63.5 F temperature in 2001 in 20 th place, and 63.4 F in 2003, good for 19 th place. The day split for September 2012 shows 18 days of below normal temperature, 2 days at normal, and 10 days with above normal temperature. On one day the state average temperature was at least 10 F below normal. The warmest official temperature in the state was 96 F on September 2 nd at Mount Vernon and Poseyville. The lowest daily official September temperature was 28 F recorded on September 24 th at Wanatah. The first freezing temperature of the autumn season was noted at 15 of 100 cooperative stations reporting September data so far. The state precipitation total was 5.38 inches, a surplus of 2.29 inches above normal. This ranks this month as the 12 th wettest September on record since The most recent wetter September was last year with 5.48 inches, falling in at 11 th place. Some other recent wetter Septembers were the 6.16 inches of 1993, ranking at 5 th, and the 6.21 inches noted in 2003, good for 4 th place. Rainfall this month was generally about 90% of normal in northern Indiana and 220% of normal in central and southern Indiana. The highest daily cooperative station rainfall measurement this month was 3.79 inches as recorded on September 8 th at Middletown. Among CoCoRaHS reports the heaviest single day rainfall reading was 5.33 inches at Darmstadt on September 18 th. Precipitation generally fell on about 17 days around Indiana this month. Severe weather occurred on four September days. The remnants of Hurricane Isaac spawned a 38- second long EF-0 tornado, captured on a news webcam in downtown Indianapolis on September 1 st. Were it not for the webcam the event would have gone unnoticed. High wind damage occurred in far southwest and southeast Indiana on September 5 th. Two days later wind damage was far more
2 extensive and widespread across much of the state. Later in the month on September 21 st a west to east band of hail and high wind caused damage across central Indiana. Details on all the severe weather events follow in the weekly narratives. September 1 st 8 th Two significant storms impacted Indiana this week: the remnants of Hurricane Isaac and a strong cold front a few days later. The remnants of Isaac moved so slowly northward from Louisiana, finally reaching Missouri as September arrived. Warm temperatures and the transport of tropical humidity into Indiana were quite noticeable this week. Rain fell every day in our state and temperatures held above normal until the last day. The week opened with temperatures 4 F above normal, peaking at 9 F above normal by September 4 th. Then the remnants of Isaac moved east of Indiana and temperatures slipped lower each day, to 4 F above normal on September 7 th, just before a strong cold front moved through. The week closed at 4 F below normal in a cooler, more pleasant air mass. Overall this week temperatures averaged 4 F above normal. Typically this first week of September daily maximum temperatures would be expected to range from 78 F in far northern Indiana to 85 F in the far southwest. Normal daily minimums range between 58 F and 61 F north to south across the state. Light to moderate rain fell every day this week as fronts lingered in the state all week long. The heaviest rain coincided with the arrival of the two significant storms. Initial forecasts were for 6 to 9 inches of rain in Indiana from the remnants of Isaac. But very dry air over northern drought states infiltrated the core of Isaac as it moved slowly due north, drying out the storm from its inside out. The storm weakened as it sprawled over an ever larger area, unable to concentrate huge amounts of rain. In Indiana rainfall totals from Isaac ranged from just a half inch in northeast Indiana to a maximum of 4.5 inches in far southwest counties over 3 days. The storm had crossed Indiana as a typical warm and cold front pair, with the warm front moving through the state on September 3 rd and the cold front the next day. The tail end of the Isaac cold front stalled over Indiana on September 5 th. A new cold front behind it pushed the initial front east of the state but itself then stalled over Indiana on September 7 th. The air mass behind this complex of fronts was much drier and cooler and clashed with the warm humid air over Indiana, generating strong thunderstorms with heavy rainfall, commonly 2 to 4 inches. Yet another cold front reached Indiana on September 8 th, finally sweeping the unsettled weather out of the state and starting a spell of autumn-like cooler and drier weather. For the week rainfall totals averaged about 1.9 inch in northern Indiana and near 4.1 inches in central and southern regions. These totals equate to two and a half times the normal in northern Indiana and a whopping 6 times normal in central and southern parts of the state! The heaviest single day CoCoRaHS rainfall reports were received the morning of September 8 th : 4.32 inches at Eaton, 3.95 inches at Winchester, 3.85 inches in Frankfort, and 3.82 inches at Plainfield. Weekly rainfall totals were impressive. The CoCoRaHS observer at Shoals measured 7.65 inches while the Noblesville gauge collected 6.64 inches. The volunteer in Eaton recorded 6.42 inches. The rainfall sum at Morristown was 6.15 inches and 6.06 inches was noted at Winchester. The near absence of severe weather reports in Indiana the first days of September reflects just how weakened Isaac had become. On September 1 st a downtown Indianapolis television webcam
3 tracked a spin-up tornado as it briefly touched down. The lifetime of the tornado was 38 seconds. No other severe weather reports were noted during the stay of Isaac remnants in Indiana. Later in the week, however, there was a lot more severe weather activity. On September 5 th high wind damage was observed in far southwest and southeast Indiana. In Gibson county trees fell on a car, a home, and took down power poles. A tree fell on a garage in Pike county. In southeast Indiana 60 mph winds snapped trees in Harrison, Floyd, and Clark counties, falling onto roads and power lines. Wind damage was far more extensive on September 7 th. Many reports of trees ripping down power lines and falling across roads were noted in Fulton, Cass, Miami, Howard, Grant, Madison, Blackford, Wells, and Adams counties. Telephone poles were snapped by high winds in Fulton county. Winds over 60 mph tore off a barn roof in Hendricks county while trees crushed cars and fell on roads and power lines in Wayne county. Fallen trees closed roads in Switzerland and Orange counties. Wind gusts brought down still more trees in Franklin, Jennings, Washington, Clark, and Floyd counties. In southwest Indiana high winds tore roofs off 3 houses and trees tangled with power lines in Posey county. In Vanderburgh county 70 mph winds blew a barn into a road. Lightning struck trees which fell and snagged power lines, causing many power outages. Gusts in Warrick county tore a roof off a carwash. Other reports noted falling trees took out power in Spencer, Pike, and Gibson counties. While there were numerous reports of wind damage this day, there was a lone report of large hail, at 1.0 inch diameter, in Madison county. Given the heavy rainfall amounts there are big changes for Indiana on the US Drought Monitor map this week. The September 4 th edition shows all extreme (D3 category) and exceptional (D4 category) drought areas in the state have reverted to the lesser severe drought classification (D2 category). The net result of this change is the southern half of the state is almost entirely within the severe drought category. The northern boundary of severe drought has generally shifted about one county south since a week ago, now located just north of central Indiana. The remaining northern region of Indiana is rated in moderate (D1 category) drought. On an area percentage basis this leaves about 55% of Indiana in severe drought (D2 category), 33% in moderate drought (D1 category), and 12% of the state rated as abnormally dry (D0 category). Weekly Indiana Drought Monitor maps are attached near the end of this monthly summary. Progress toward drought recovery is reflected in the September 9 th edition of the Indiana Weekly Weather and Crop bulletin. The soil moisture survey finds 48% of Indiana topsoils rated as short or very short of moisture while 76% of subsoils are in these classes. The report notes that while improving, the drought is not over. Even though water content of topsoils is obviously increasing, water is not yet running through field tiles. The report states that frequent rainfall this week has slowed the drying of cut hay although this third cutting is almost finished. Pastures are improving due to the recent rains and are rated at 13% good to excellent condition. The end of hot and dry weather continues to benefit livestock which are in mostly good condition. About 47% of the state corn crop is mature and 9% has been harvested. Soybeans are rapidly changing color, are rated in 24% good to excellent condition, and 1% of the crop has been harvested. As the rains continue this month more counties are lifting burn bans. The list of counties which have lifted their mandatory burn bans this week and the effective dates are: September 1 Jefferson September 4 Clay, Gibson, Monroe, Owen, Ripley
4 September 5 Dearborn, Orange September 6 Scott September 8 Switzerland September 9 th 15 th This second week of September weather conditions were quite the opposite of a week ago. Gone are the mostly above normal temperatures and every day rain carried in by two major storms, the first the remnants of Hurricane Isaac. In its place was a week of cool temperatures with mostly light rainfall on just a few days. Also noticeably missing was severe weather. There were no severe weather days this week. A cold front moved through Indiana on September 9 th. Temperatures began the week very cool with the daily state average temperature at 6 F below normal. A high pressure center passed overhead the next day, then slid to the east on September 11 th. The sunny skies and southerly winds caused daily temperatures to climb steadily over the next 4 days, peaking at 1 F above normal by September 13 th. A second cold front inched southward across Indiana the next day, then slowed to a stop near the Ohio River. A helpful push from another high pressure system in Canada reenergized the stagnant front to move it on to the southeastern states. Cooler weather returned as temperatures fell a few degrees to 3 F below normal, where it remained to the end of the week. Overall this week daily state temperatures averaged about 3 F below normal. Typical for this time of year is daily maximum temperatures ranging from 76 F to 83 F north to south across the state. Daily minimums normally vary between 55 F in northern Indiana to 58 F in far southwest counties. The two cold fronts produced the only rainfall this week. Generally in northern Indiana about 0.3 inch total rainfall was noted while central Indiana recorded near 0.1 inch. Just sprinkles fell in the south. These totals represent just a third of normal rainfall across northern Indiana, a scant 15% of normal in central sections, and less than 5% of normal in southern counties. But as is typical in summer months some local thunderstorms dumped much heavier amounts. On the morning of September 9 th the CoCoRaHS observer in Avon measured 3.52 inches, the highest single day report around the state. The Fishers rain gage collected 2.51 inches while the La Fontaine volunteer recorded 1.15 inch for that date. The Avon location received a total of 3.64 inches for the full week.
5 The September 11 th edition of the US Drought Monitor showed some improvement in Indiana drought conditions due to the rain received so far this month. About 28% of Indiana land area was reclassified this week from severe drought (D2 category) into moderate drought status (D1 category), primarily in central Indiana. Southern Indiana generally south of a Vincennes to Liberty line accounts for 27% of Indiana area which remains in severe drought status. Nine counties in the northwest corner of Indiana continue to be rated abnormally dry (D0 category), about 12% of total Indiana area. The remaining 61% of state area is in moderate drought status (D1 category). Weekly Indiana drought maps are found at the end of this monthly report. The Indiana Weekly Weather and Crop bulletin of September 16 th tells a similar story of improvement. About 17% of Indiana corn has been harvested while corn remaining in the fields is rated in 11% good to excellent condition. There is high variability in corn yields even within same fields due to the summer drought. Soybean harvest is slow to start but most fields are now mature. Remaining soybean fields are rated in 28% good to excellent condition. Pastures are rated in 15% good to excellent condition with the final cutting of hay considered the best of the season by many farmers. Livestock are holding on in mostly good condition according to the bulletin. The weekly soil moisture survey says topsoils stand at 47% short or very short of moisture. Subsoils are rated at 70% in these same categories. Very few Indiana counties still have burn bans in effect. This week Floyd county lifted its mandatory county burn ban effective September 15 th, leaving only 3 counties with burn bans still in force. September 16 th 22 nd The chilly weather continued with below normal temperatures every day this week. A low pressure trough in the upper atmosphere above Canada greatly intensified as the week progressed, supporting a persistent flow of cold air into Indiana. At ground level a high pressure system was east of Indiana on September 16 th, trying to coax warmer air our way from southern states. Yet state average temperatures only peaked at about 2 F below normal to start the week, the warmest day of the seven. A cold front was advancing toward Indiana, suppressing temperatures gradually at first, then rapidly to 11 F below normal as the cold
6 front passed through on September 18 th. A high pressure ridge behind the front moved quickly overhead Indiana the next day, then east to the Atlantic coast by September 20 th. As it departed temperatures rebounded to 4 F below normal. On September 21 st the second cold front of the week entered the state but slowed to a stop across central Indiana. This storm spawned hail and high wind damage, spread west to east across central Indiana. The next day a new cold front to the northwest nudged the stationary front, enough to resume its movement southward again. Temperatures fell a few degrees to close the week at 6 F below normal. Overall for the week daily state temperatures averaged about 5 F below normal. Usually daily maximum temperatures vary from 73 F to 80 F north to south across Indiana this third week of September. Daily minimums normally range from 53 F in far northern Indiana to 56 F in the southwest corner of the state. Moderate rain fell when each of the two cold fronts moved through Indiana this week. Light rain was seen off and on during the remaining days. The heaviest single day rainfall was measured by CoCoRaHS volunteers on the morning of September 18 th. In Vanderburgh county two Darmstadt gages collected 5.33 and 3.10 inches, while Evansville recorded 3.67 inches, Melody Hill 4.65 inches, and Elberfeld 3.24 inches. The heaviest weekly total rainfall included 5.45 inches in Darmstadt, 3.75 inches in Evansville, and 2.83 inches in New Castle. Regionally this week about 0.50 inch of total rainfall was observed in northern Indiana, 1.3 inch in central areas, and 0.6 inch across the south. These totals equate to about 70% of normal rainfall in northern Indiana, near 90% in southern, but double normal in the central third of the state. Severe weather broke out across central Indiana on September 21 st when the second cold front stalled and became a stationary front. A west to east zone of wind and hail damage was reported in central counties that day. In Fountain county high winds tore off a barn roof and brought down power lines. Downed and uprooted trees were reported in Boone, Putnam, Hendricks, and Wayne counties. Wind gusts reached 60 mph in Hendricks county where shingles and siding were ripped off a house. Utility poles were blown down in Montgomery and Wayne counties. One inch hail was reported in Putnam and Hancock county. Larger hail up to 1.75 inch was observed in Hendricks, Marion, Hancock, and Rush counties. Hail broke home windows in Montgomery county. In Marion county power outages impacted more than 10,000 customers. Rainfall this week was little help in reduction of existing state drought conditions. The September 18 th edition of the US Drought Monitor shows only a minor change in Indiana drought ratings. Small parts of 4 counties in southwest Indiana, just northeast of Evansville, improved from severe drought status (D2 category) into the moderate drought class (D1 category). All other areas remained the same. Nearly two-thirds of the state is now in moderate drought status while the one quarter of Indiana generally south of a Vincennes to Liberty line remains in severe drought condition. Extreme northwest counties are considered abnormally dry (D0 category), not in drought. Weekly maps of Indiana drought status are available at the end of this monthly report. The September 23 rd edition of the Indiana Weather and Crop bulletin states rain this week has slowed some harvest progress as crops are drying more slowly in the field. The report says Indiana corn is now 82% mature with 26% harvested. Corn in the field is rated 11% in good to excellent condition. Soybean harvest is 10% complete with 27% of field crop in good to excellent condition. Livestock continue in mostly good condition with pastures rated at 18% in good to excellent condition. The weekly soil moisture survey counts 42% of topsoil as short or very short of moisture while subsoil is at 68% in these same categories. Improvement in soil moisture has slowed in recent weeks.

7 Outside burn bans continue in only 3 southern Indiana counties: Clark, Crawford, and Martin. With so few burn bans remaining no burn bans were lifted in Indiana this week. September 23 rd 30 th The cool trend this second half of September continues. Only two of these last 8 days of the month featured temperatures above normal. The week opened with strong high pressure centered over Indiana, resulting in mostly dry weather and temperatures around 8 F below normal. The high pressure center drifted east the next day, allowing southerly winds behind it to lift Indiana temperatures. Two warm fronts, one to the north of the state and one to the south, teamed up to quicken the warm up to 2 F above, then 3 F above normal by September 26 th, the warmest of the 8 days. A sluggish cold front moved into Indiana the next day, stalled briefly, then reached the Ohio River on September 28 th. Unlike this front, a second cold front right behind it raced southward from Minnesota to Alabama in just a single day. Yet another cold front, the third to cross Indiana in just 4 days, reinforced cool temperatures in the state. The thermometer had slid again behind this relentless cool push, ending the month at 4 F below normal. Given the strong warm up the first half of the week versus the sudden cool down in the second half, temperatures over the 8 days averaged to 3 F below normal. Normally in late September daily maximum temperatures range from 70 F in far northern Indiana to 77 F in the extreme southwest. Typical daily minimums vary from 49 F to 52 F north to south across the state. With the many fronts in the area rainfall was measured somewhere in the state on 7 of the 8 days. But the two more significant rainfall days came with the warm air surge early in the week and accounted for much of the 8 day total precipitation. Regionally for the week only about 0.2 inch of rain fell across northern and 0.7 inch in central Indiana. But in southern counties the average was 2.0 inches! On a percentage basis this translates to 25% of normal in northern Indiana, about 90% of normal in central, and around 220% of normal in the south. The much heavier rain in southern Indiana is evidenced by single day rainfall amounts reported on the morning of September 26 th by CoCoRaHS volunteers. On that morning two Huntingburg observers each noted 3.70 inches, while a third measured 3.40 inches in that city. The Hazleton gage collected 3.53 inches while Patoka had 3.50 inches that day. The heaviest totals over the entire 8 days included 5.45 inches at Mauckport, 4.97 inches in Hazleton, 4.35 inches at Elizabeth, and 4.19 inches in Birdseye.
8 Soil moisture conditions have improved dramatically in southwest and south central Indiana due to the heavy rains according to the October 2 nd edition of the US Drought Monitor. The area of Indiana generally south of a Vincennes to Salem line but north of a New Harmony to Wyandotte line jumped from severe drought status (D2 category) a week ago to the no-drought classification of abnormally dry (D0 category). The southern portion of Indiana counties in the Evansville area retained their severe (D2 category) designation this week as did most of southeast Indiana. The drought status of northern and central Indiana is unchanged over the past two weeks. The Indiana weekly drought maps for September are found at the end of this monthly summary. The September 30 th edition of the Indiana Weekly Weather and Crop bulletin reports that corn and soybean harvest advanced rapidly this past week. Corn harvest is 8 days ahead of schedule while soybeans are only 2 days behind an average harvest year. Corn still in the field is rated in 11% good to excellent condition while soybeans are at 29% in these categories. Livestock continues in mostly good condition with pastures now rated in 24% good to excellent condition, showing good improvement from the height of the drought in early August. The latest cutting of hay has helped supplies but there will still be some farms with a feed shortage going into winter. The report puts Indiana topsoil at 30% short or very short of moisture while 60% of subsoil is rated in these categories. With the topsoil moisture gains wheat planting is now underway. There is no change in county burn ban status. Three counties: Clark, Crawford, and Martin are continuing their mandatory outdoor burn bans as the calendar turns to October.
9 September 2012 Temperature Region Temperature Normal Deviation Northwest North Central Northeast West Central Central East Central Southwest South Central Southeast State Precipitation Region Precipitation Normal Deviation Percent of Normal Northwest North Central Northeast West Central Central East Central Southwest South Central Southeast State
10 Autumn so far (same as September) Temperature Region Temperature Normal Deviation Northwest North Central Northeast West Central Central East Central Southwest South Central Southeast State Precipitation Region Precipitation Normal Deviation Percent of Normal Northwest North Central Northeast West Central Central East Central Southwest South Central Southeast State
11 2012 Annual (through September) Temperature Region Temperature Normal Deviation Northwest North Central Northeast West Central Central East Central Southwest South Central Southeast State Precipitation Region Precipitation Normal Deviation Percent of Normal Northwest North Central Northeast West Central Central East Central Southwest South Central Southeast State
12
13
14

15 Drought Summary from the U.S. Drought Monitor Below is a drought summary for the state of Indiana from the U.S. drought monitor. Areas in white are not experiencing any drought. Yellow areas are abnormally dry, but not considered a drought. Drought begins when the moisture levels become more severe, with beige, orange, red, and brown indicating increasing levels of drought (moderate, severe, extreme, and exceptional, respectively). The table below indicates how much of the state is not under drought conditions, and also how much of the state is under drought conditions from its respective column upwards. For example, September 4 th has 54.7% of Indiana under at least D2- D4 drought status, 88.4% under at least D1-D4 status, and 100.0% under D0-D4. Subtracting the D2-D4 category (54.7%) from the D1-D4 category (88.4%), tells us that 33.7% of Indiana is in the D1 category alone (moderate drought). Please note, however, that these areas are not exact, and much of this drought map has been created from reports throughout the state and in estimation, so use this information as a general view rather than for specifics.
16 September 4 th Drought Summary
17 September 11 th Drought Summary

18 September 18 th Drought Summary
19 September 25 th Drought Summary
November 2012 Climate Summary
 Ken Scheeringa and Kayla Hudson Dec 6, 2012 (765) 494-8105 http://www.iclimate.org November 2012 Climate Summary Month Summary November was one of those rare weather months in Indiana when not much happened:
October 2011 Climate Summary
 Ken Scheeringa and Kayla Hudson Nov 4, 2011 http://www.iclimate.org October 2011 Climate Summary Month Summary October weather evolved as a two part story. Weather conditions the first half of the month
August 2013 Climate Summary
 Ken Scheeringa and Matt Price Sep 6, 2013 (765) 494-8105 http://www.iclimate.org August 2013 Climate Summary Month Summary August weather began cool and wet but became progressively warmer and drier through
July 2007 Climate Summary
 Dan Bowman (765) 494-6574 Sep 3, 2007 http://www.iclimate.org Summary July 2007 Climate Summary The month of July ended as a very unusual month. Many events occurred during the month of July that is not
August 2006 Summary. August 1-5
 Ashley Brooks (765) 494-6574 Sep 8, 2006 http://www.iclimate.org August 1-5 August 2006 Summary The heat wave that started during the end of July continued into the beginning parts of August with temperatures
September 2011 Climate Summary
 Ken Scheeringa and Kayla Hudson Oct 5, 2011 (765) 494-8105 http://www.iclimate.org September 2011 Climate Summary Month Summary The final blast of summer heat arrived at the start of September. It lasted
October 2012 Climate Summary
 Ken Scheeringa and Kayla Hudson Nov 8, 2012 (765) 494-8105 http://www.iclimate.org October 2012 Climate Summary Month Summary In a reversal from the hot and dry summer, cooler and wetter than normal conditions
September 2005 Climate Summary
 Ashley Brooks (765) 494-6574 Oct 5, 2005 http://iclimate.org September 2005 Climate Summary September 1-7 A cold front came through on the 1 st of the month, however little moisture was associated with
August 2015 Climate Summary
 Ken Scheeringa And Mary Rose Mangan Sep 4, 2015 (765) 494-8105 http://www.iclimate.org August 2015 Climate Summary Month Summary A very active wet summer weather pattern turned much calmer and drier in
November 2010 Climate Summary
 Ken Scheeringa (765) 494-8105 Dec 6, 2010 http://www.iclimate.org November 2010 Climate Summary Summary A four month drought in Indiana is collapsing as significant rain fell the final week of November.
October 2014 Climate Summary
 Ken Scheeringa And Matt Price Nov 10, 2014 (765) 494-8105 http://www.iclimate.org October 2014 Climate Summary Month Summary October featured a mix of weather. A very wet first half of the month evolved
August 2017 Climate Summary
 Ken Scheeringa And Andy Eggert Sep 7, 2017 (765) 494-8105 http://www.iclimate.org August 2017 Climate Summary Month Summary The coolest August in 13 years featured long cool and warm spells, below normal
May 2016 Climate Summary
 Ken Scheeringa And Andy Eggert Jun 6, 2016 (765) 494-8105 http://www.iclimate.org May 2016 Climate Summary Month Summary Cold weather dominated in May until the last week of the month. May began wet but
2011 Year in Review TORNADOES
 2011 Year in Review The year 2011 had weather events that will be remembered for a long time. Two significant tornado outbreaks in April, widespread damage and power outages from Hurricane Irene in August
December 2011 Climate Summary
 Ken Scheeringa and Kayla Hudson Jan 17, 2012 (765) 494-8105 http://www.iclimate.org December 2011 Climate Summary Month Summary What a difference a year makes! A year ago the misery of a harsh, cold, and
January 2008 Climate Summary
 Joseph Mays (765) 494-6574 Feb 5, 2008 http://www.iclimate.org Summary January 2008 Climate Summary January was a mix bag of conditions, with an oscillatory pattern developing. We experienced phases of
September 2016 Climate Summary
 Ken Scheeringa And Andy Eggert Oct 6, 2016 (765) 494-8105 http://www.iclimate.org September 2016 Climate Summary Month Summary The warmest September in 77 years brought alternating weeks of dry and wet
January 2006 Climate Summary
 Ashley Brooks (765) 494-6574 Feb 9, 2006 http://www.iclimate.org January 1-3 January 2006 Climate Summary Unseasonably warm conditions welcomed in the New Year with highs in the 40s across the northern
May 2018 Climate Summary
 Ken Scheeringa and Andy Eggert Jun 7, 2018 (765) 494-8105 http://www.iclimate.org May 2018 Climate Summary Month Summary As the calendar turned from April to May temperatures flipped dramatically away
May 2015 Climate Summary
 Ken Scheeringa And Mary Rose Mangan Jun 8, 2015 (765) 494-8105 http://www.iclimate.org May 2015 Climate Summary Month Summary May was a very warm month. Rainfall averaged near normal but was distributed
July 2010 Climate Summary
 Ken Scheeringa (765) 494-8105 Aug 4, 2010 http://www.iclimate.org July 2010 Climate Summary Summary The warm summer of 2010 continues. Daily state average temperatures were above normal on all but seven
November 2015 Climate Summary
 Ken Scheeringa And Mary Rose Mangan Dec 8, 2015 (765) 494-8105 http://www.iclimate.org November 2015 Climate Summary Month Summary November was much warmer than normal while precipitation was very near
October 2017 Climate Summary
 Ken Scheeringa and Andy Eggert Nov 6, 2017 (765) 494-8105 http://www.iclimate.org October 2017 Climate Summary Month Summary After more than three weeks of warm temperatures October turned suddenly cold
April 2016 Climate Summary
 Ken Scheeringa And Andy Eggert May 9, 2016 (765) 494-8105 http://www.iclimate.org April 2016 Climate Summary Month Summary One month but two seasons. The first half of April was cold with snow. Wind damage
The hydrologic service area (HSA) for this office covers Central Kentucky and South Central Indiana.
 for this office covers Central Kentucky and South Central Indiana.") January 2012 February 13, 2012 An X inside this box indicates that no flooding occurred within this hydrologic service area. January 2012 continued the string of wet months this winter. Rainfall was generally
January 2012 February 13, 2012 An X inside this box indicates that no flooding occurred within this hydrologic service area. January 2012 continued the string of wet months this winter. Rainfall was generally
June 2016 Climate Summary
 Ken Scheeringa And Andy Eggert Jul 8, 2016 (765) 494-8105 http://www.iclimate.org June 2016 Climate Summary Month Summary June was a warm month with below normal temperature on just 6 days. Rainfall was
The Pennsylvania Observer
 The Pennsylvania Observer August 3, 2015 July 2015 - Pennsylvania Weather Recap By: Arthur Person Although this seventh month of 2015 was fairly normal across Pennsylvania as a whole, the details reveal
The Pennsylvania Observer
 The Pennsylvania Observer October 1, 2015 September 2015 - Pennsylvania Weather Recap By: Quinn Lease The month of September will be remembered for its above normal temperatures and dry conditions that
April 2017 Climate Summary
 Ken Scheeringa And Andy Eggert May 8, 2017 (765) 494-8105 http://www.iclimate.org April 2017 Climate Summary Month Summary April was a very warm and wet month in Indiana, nearly setting a new monthly temperature
October 2016 Climate Summary
 Ken Scheeringa And Andy Eggert Nov 9, 2016 (765) 494-8105 http://www.iclimate.org October 2016 Climate Summary Month Summary October was the 9 th month so far this year to average above normal in temperature.
June 2011 Climate Summary
 Ken Scheeringa (765) 494-8105 Jul 8, 2011 http://www.iclimate.org June 2011 Climate Summary Month Summary The abundance of extreme weather this year extended yet another month into June. This month has
November 2016 Climate Summary
 Ken Scheeringa And Andy Eggert Dec 15, 2016 (765) 494-8105 http://www.iclimate.org November 2016 Climate Summary Month Summary Unseasonably warm, pleasant, and sunny weather the first half of the month
June 2010 Climate Summary
 Ken Scheeringa (765) 494-8105 Jul 6, 2010 http://www.iclimate.org June 2010 Climate Summary Summary Summer like heat and humidity arrived in Indiana on May 22 nd and dominated our weather scene nearly
2012 Growing Season Weather Summary for North Dakota. Adnan Akyüz and Barbara A. Mullins Department of Soil Science October 30, 2012
 2012 Growing Season Weather Summary for North Dakota Adnan Akyüz and Barbara A. Mullins Department of Soil Science October 30, 2012 Introduction The 2012 growing season (the period from April through September)
March 2014 Climate Summary
 Ken Scheeringa And Matt Price Apr 8, 2014 (765) 494-8105 http://www.iclimate.org March 2014 Climate Summary Month Summary Winter had officially ended by the calendar but snow and cold persisted in Indiana
January 2012 Climate Summary
 Ken Scheeringa and Kayla Hudson Feb 6, 2012 (765) 494-8105 http://www.iclimate.org January 2012 Climate Summary Month Summary Where is winter? This question found its way into many conversations throughout
Champaign-Urbana 1998 Annual Weather Summary
 Champaign-Urbana 1998 Annual Weather Summary ILLINOIS STATE WATER SURVEY Audrey Bryan, Weather Observer 2204 Griffith Dr. Champaign, IL 61820 wxobsrvr@sparc.sws.uiuc.edu The development of the El Nìno
April 2013 Climate Summary
 Ken Scheeringa and Kayla Hudson May 6, 2013 (765) 494-8105 http://www.iclimate.org April 2013 Climate Summary Month Summary Temperatures bounced high and low this month, keeping Hoosiers guessing which
January 2013 Climate Summary
 Ken Scheeringa and Kayla Hudson Feb 7, 2013 (765) 494-8105 http://www.iclimate.org January 2013 Climate Summary Month Summary Winter or spring? January featured several dramatic swings in temperature and
Champaign-Urbana 1999 Annual Weather Summary
 Champaign-Urbana 1999 Annual Weather Summary ILLINOIS STATE WATER SURVEY 2204 Griffith Dr. Champaign, IL 61820 wxobsrvr@sws.uiuc.edu Maria Peters, Weather Observer A major snowstorm kicked off the new
May 2005 Climate Summary
 Ashley Brooks (765) 494-6574 Jun 7, 2005 http://iclimate.org May 2005 Climate Summary May 1-5 Early May was characterized by an upper-level trough that was in place over Indiana that brought in very cool
The Pennsylvania Observer
 The Pennsylvania Observer September 3, 2008 Summer 2008 Weather Summary Written by: Brian Thompson The opening days of June started dry, but a warm front brought a widespread rain a couple of days into
October 2010 Climate Summary
 Ken Scheeringa (765) 494-8105 Nov 5, 2010 http://www.iclimate.org October 2010 Climate Summary Summary Rain fell on about 10 days in October but did little to slow the drought raging across Indiana. For
Monthly Long Range Weather Commentary Issued: SEPTEMBER 19, 2016 Steven A. Root, CCM, Chief Analytics Officer, Sr. VP,
 Monthly Long Range Weather Commentary Issued: SEPTEMBER 19, 2016 Steven A. Root, CCM, Chief Analytics Officer, Sr. VP, sroot@weatherbank.com SEPTEMBER 2016 Climate Highlights The Month in Review The contiguous
February 2017 Climate Summary
 Ken Scheeringa And Andy Eggert Mar 9, 2017 (765) 494-8105 http://www.iclimate.org February 2017 Climate Summary Month Summary February 2017 was the warmest February in Indiana since state climate records
July 2011 Climate Summary
 Ken Scheeringa (765) 494-8105 Aug 8, 2011 http://www.iclimate.org July 2011 Climate Summary Month Summary The upper atmospheric high pressure dome which baked the Texas area in heat and drought the past
Table 1. August average temperatures and departures from normal ( F) for selected cities.
 for selected cities.") Climate Summary for Florida August 2016 Prepared by Lydia Stefanova and David Zierden Florida Climate Center, The Florida State University, Tallahassee, Florida Online at: http://climatecenter.fsu.edu/products-services/summaries
Climate Summary for Florida August 2016 Prepared by Lydia Stefanova and David Zierden Florida Climate Center, The Florida State University, Tallahassee, Florida Online at: http://climatecenter.fsu.edu/products-services/summaries
August 2016 Climate Summary
 Ken Scheeringa And Andy Eggert Sep 12, 2016 (765) 494-8105 http://www.iclimate.org August 2016 Climate Summary Month Summary Hot but tranquil weather the first half of August transitioned to a tormented
April 2015 Climate Summary
 Ken Scheeringa And Mary Rose Mangan May 8, 2015 http://www iclimate org April 2015 Climate Summary Month Summary April was a month of extremes. Severe weather erupted on 4 days of the first week with multiple
Champaign-Urbana 2001 Annual Weather Summary
 Champaign-Urbana 2001 Annual Weather Summary ILLINOIS STATE WATER SURVEY 2204 Griffith Dr. Champaign, IL 61820 wxobsrvr@sws.uiuc.edu Maria Peters, Weather Observer January: After a cold and snowy December,
Weather and Climate Summary and Forecast October 2017 Report
 Weather and Climate Summary and Forecast October 2017 Report Gregory V. Jones Linfield College October 4, 2017 Summary: Typical variability in September temperatures with the onset of fall conditions evident
March 2016 Climate Summary
 Ken Scheeringa And Andy Eggert Apr 8, 2016 (765) 494-8105 http://www.iclimate.org March 2016 Climate Summary Month Summary Count March as the 7 th month in a row that the state average temperature has
July 2015 Climate Summary
 Ken Scheeringa And Mary Rose Mangan Aug 6, 2015 (765) 494-8105 http://www.iclimate.org July 2015 Climate Summary Month Summary Record setting rainfall in June persisted into the first three weeks of July.
UNITED STATES AND SOUTH AMERICA WEATHER ROUNDUP Sunday, December 17, 2017
 T-storm Weather Summary Extreme heat was followed by heavy rain in some key areas of Argentina yesterday. T-storms affect much of the driest Argentina, southern Brazil, and Paraguay through 7 to 10 days,
January 2017 Climate Summary
 Ken Scheeringa And Andy Eggert Feb 8, 2017 (765) 494-8105 http://www.iclimate.org January 2017 Climate Summary Month Summary The warmest January in 11 years was nearly 4 F warmer than December 2016. An
November 2017 Climate Summary
 Ken Scheeringa and Andy Eggert Dec 8, 2017 (765) 494-8105 http://www.iclimate.org November 2017 Climate Summary Month Summary November temperatures alternated spells of warm and cool while precipitation
Crop / Weather Update
 Crop / Weather Update Corn Crop Condition Percent of Acreage Rated Good or Excellent 85 80 75 70 65 60 55 50 45 As of September 9, USDA rates the crop at 68% good to excellent. The rating is up one point
March 2012 Climate Summary
 Ken Scheeringa and Kayla Hudson Apr 4, 2012 (765) 494-8105 http://www.iclimate.org March 2012 Climate Summary Month Summary March was a month of weather extremes with records shattered almost as a daily
April 2011 Climate Summary
 Ken Scheeringa (765) 494-8105 May 9, 2011 http://www.iclimate.org April 2011 Climate Summary Summary After somewhat of a respite in March Indiana weather ramped up with a vengeance in April. Extreme weather
NATIONAL WEATHER SERVICE
 January 2016 February 9, 2016 This was a dry month across the HSA despite one large and several smaller snowfalls. Most locations ended up 1-2 inches below normal for the month. The driest locations at
Monthly Long Range Weather Commentary Issued: May 15, 2014 Steven A. Root, CCM, President/CEO
 Monthly Long Range Weather Commentary Issued: May 15, 2014 Steven A. Root, CCM, President/CEO sroot@weatherbank.com APRIL 2014 REVIEW Climate Highlights The Month in Review The average temperature for
KANSAS CLIMATE SUMMARY August 2015
 KANSAS CLIMATE SUMMARY August 2015 Cool and Dry August was drier than normal in most of the state. State-wide average precipitation was 2.80 inches or 85 percent of normal. The Northeast division of the
UNITED STATES AND SOUTH AMERICA OUTLOOK (FULL REPORT) Thursday, December 28, 2017
 Thursday, December 28, 2017") T-storm Weather Summary Despite scattered t-storms Sat.-Sun. in central and northern areas in Argentina, more will likely be needed especially in sunflower areas of the southwest. Some t-storms likely
T-storm Weather Summary Despite scattered t-storms Sat.-Sun. in central and northern areas in Argentina, more will likely be needed especially in sunflower areas of the southwest. Some t-storms likely
The hydrologic service area (HSA) for this office covers Central Kentucky and South Central Indiana.
 for this office covers Central Kentucky and South Central Indiana.") MONTH YEAR January 2011 February 15, 2011 X An X inside this box indicates that no flooding occurred within this hydrologic service area. January 2011 was drier than normal in all locations in the area.
MONTH YEAR January 2011 February 15, 2011 X An X inside this box indicates that no flooding occurred within this hydrologic service area. January 2011 was drier than normal in all locations in the area.
Nebraska experienced a wide
 Issue 1 August 2016 CLIMATE UPDATE A MONTHLY SUMMARY FROM THE neclimate.unl.edu August saw reprieve from dryness, cooler temps Overview Nebraska experienced a wide range of conditions across the state
MIAMI-SOUTH FLORIDA National Weather Service Forecast Office
 MIAMI-SOUTH FLORIDA National Weather Service Forecast Office http://www.weather.gov/miami June 2015 South Florida Weather Summary Dry East, Wet West...Drought Remains SE Florida July 3, 2015: Depending
March 2009 Climate Summary
 Joseph Mays (765) 494-6574 Apr 1, 2009 http://www.iclimate.org Summary March 2009 Climate Summary March is in the books and it continued the trend of extreme weather we have experienced during the first
Weather and Climate Summary and Forecast Summer 2017
 Weather and Climate Summary and Forecast Summer 2017 Gregory V. Jones Southern Oregon University August 4, 2017 July largely held true to forecast, although it ended with the start of one of the most extreme
November 2014 Climate Summary
 Ken Scheeringa And Matt Price Dec 10, 2014 (765) 494-8105 http://www.iclimate.org November 2014 Climate Summary Month Summary Unseasonable cold headlined the Indiana and national news in November. The
Fronts. Direction of Front
 Fronts Direction of Front Direction of Front Warm Front A cold air mass meets and displaces a warm air mass. Because the moving cold air is more dense, it moves under the less-dense warm air, pushing it
Crop / Weather Update
 Crop / Weather Update Corn Crop Condition Percent of Acreage Rated Good or Excellent 85 80 75 70 65 60 55 50 45 Corn condition this week is the same as the last two weeks in the good/excellent category,
The Weather Wire. Contents: Summer 2018 Outlook. Summer 2018 Outlook Drought Monitor May Summary/Statistics June Preview Rainfall Totals
 The Weather Wire June 2018 Volume 25 Number 6 Contents: Summer 2018 Outlook Drought Monitor May Summary/Statistics June Preview Rainfall Totals Summer 2018 Outlook June 1 st marked the first day of meteorological
but 2012 was dry Most farmers pulled in a crop
 After a winter that wasn t, conditions late in the year pointed to a return to normal snow and cold conditions Most farmers pulled in a crop but 2012 was dry b y M i k e Wr o b l e w s k i, w e a t h e
July 2014 Climate Summary
 Ken Scheeringa And Matt Price Aug 8, 2014 (765) 494-8105 http://www.iclimate.org July 2014 Climate Summary Month Summary July was unseasonably cool and drier than normal. Rainfall was light in parts of
Crop / Weather Update
 Crop / Weather Update Corn Crop Condition Percent of Acreage Rated Good or Excellent 85 80 75 70 65 60 55 50 45 In its weekly Crop Progress Report for September 16, the USDA stated the 18-state average
The Pennsylvania Observer
 The Pennsylvania Observer April 2, 2009 March 2009 Pennsylvania Weather Recap Prepared by Curt Harpster For the month of March the saying, In like a lion and out like a lamb really fit the pattern quite
SEPTEMBER 2013 REVIEW
 Monthly Long Range Weather Commentary Issued: October 21, 2013 Steven A. Root, CCM, President/CEO sroot@weatherbank.com SEPTEMBER 2013 REVIEW Climate Highlights The Month in Review The average temperature
SIGNIFICANT EVENTS Severe Storms November 1994 January 1996 August 1998 and May 2000 March 2002 May 2002 Champaign County
 SIGNIFICANT EVENTS Severe Storms November 1994 On Nov. 1, 1994, high winds gusted over 60 mph at times across the northwest third of Ohio. The highest measured wind gust was 63 mph at Columbus Grove (Putnam).
NWS FORM E-5 U.S. DEPARTMENT OF COMMERCE I HYDRO SERVICE AREA NOAA, NATIONAL WEATHER SERVICE I Indianapolis, IN MONTHLY REPORT
 NWS FORM E-5 U.S. DEPARTMENT OF COMMERCE I HYDRO SERVICE AREA NOAA, NATIONAL WEATHER SERVICE I Indianapolis, IN. 1-------------------- MONTHLY REPORT OF RIVER AND FLOOD CONDITIONSI REPORT FOR I November
The Pennsylvania Observer
 The Pennsylvania Observer May 31, 2012 May 2012 - Pennsylvania Weather Recap By: Paul Knight The majority of the fifth month had temperatures averaging well above seasonal levels with two distinct hot
Weather and Climate 1. Elements of the weather
 Weather and Climate 1 affect = to have an effect on, influence, change altitude = the height of a place above the sea axis = the line around which an object rotates certain = special consist of = to be
Crop / Weather Update
 Crop / Weather Update Corn Crop Condition Percent of Acreage Rated Good or Excellent 85 80 75 70 65 60 55 50 45 The U.S. corn crop was rated 69% good-to-excellent on September 23, up 1% from week-ago,
Ch. 3: Weather Patterns
 Ch. 3: Weather Patterns Sect. 1: Air Mass & Fronts Sect. 2: Storms Sect. 3: Predicting the Weather Sect. 4: Weather forecasters use advanced technologies Ch. 3 Weather Fronts and Storms Objective(s) 7.E.1.3
Monthly Long Range Weather Commentary Issued: NOVEMBER 16, 2015 Steven A. Root, CCM, Chief Analytics Officer, Sr. VP, sales
 Monthly Long Range Weather Commentary Issued: NOVEMBER 16, 2015 Steven A. Root, CCM, Chief Analytics Officer, Sr. VP, sales sroot@weatherbank.com OCTOBER 2015 Climate Highlights The Month in Review The
Arizona Climate Summary
 May 2015 Temperature and Precipitation Summary Arizona Climate Summary June 2015 Summary of conditions for May 2015 May 1 st 14 th : May began with high pressure in the west, and May 1 st was dry statewide,
Chapter 3: Weather Fronts & Storms
 Chapter 3: Weather Fronts & Storms An AIR MASS is a large body of air that has similar characteristics (temperature, humidity) throughout. Air masses can be massively large. Air masses are classified by
2018 Year in Review for Central and Southeast Illinois By: Chris Geelhart, Meteorologist National Weather Service, Lincoln IL
 By: Chris Geelhart, Meteorologist National Weather Service, Lincoln IL While 2018 featured some significant out-of-season weather, including below zero temperatures in April and 90-degree highs in early
WeatherManager Weekly
 Issue 288 July 14, 2016 WeatherManager Weekly Industries We Serve Agriculture Energy/Utilities Construction Transportation Retail Our Weather Protection Products Standard Temperature Products Lowest Daily
2012 Growing Season. Niagara Report. Wayne Heinen
 2012 Growing Season Niagara Report Wayne Heinen Overview The 2012 growing season was a phenomenal one for grapes. Vines entered bud break in good shape following a mild winter. The spring of 2012 was similar
National Wildland Significant Fire Potential Outlook
 National Wildland Significant Fire Potential Outlook National Interagency Fire Center Predictive Services Issued: September, 2007 Wildland Fire Outlook September through December 2007 Significant fire
Weather and Climate Summary and Forecast August 2018 Report
 Weather and Climate Summary and Forecast August 2018 Report Gregory V. Jones Linfield College August 5, 2018 Summary: July 2018 will likely go down as one of the top five warmest July s on record for many
Monthly Long Range Weather Commentary Issued: July 18, 2014 Steven A. Root, CCM, President/CEO
 Monthly Long Range Weather Commentary Issued: July 18, 2014 Steven A. Root, CCM, President/CEO sroot@weatherbank.com JUNE 2014 REVIEW Climate Highlights The Month in Review The average temperature for
The Pennsylvania Observer
 The Pennsylvania Observer The Pennsylvania Observer September 16, 2004 Recap of Pennsylvania's weather from August 6 - September 12, 2004. http://pasc.met.psu.edu/pa_climatologist/nl/archive/20040916/sec1.php
Community Collaborative Rain, Hail & Snow Network
 Community Collaborative Rain, Hail & Snow Network NWS Gray and Matt Spies September 2016 Hello Observers! This is the first edition of a newsletter that we will be sending out to our current CoCoRaHS observers.
Crop / Weather Update
 Crop / Weather Update The next will be published November 13, 2018, due to the Veteran s Day holiday on Monday. Corn Harvesting Progress 100% 90% 80% 70% 60% 50% 40% 30% 20% 10% 0% 9/9 9/16 9/23 9/30 10/7
March 2011 Climate Summary
 Ken Scheeringa (765) 494-8105 Apr 5, 2011 http://www.iclimate.org March 2011 Climate Summary Summary The fast paced weather action of February slowed some in March. The major March weather features were
UNITED STATES AND SOUTH AMERICA SNAPSHOT REPORT Thursday, December 21, 2017
 T-storm Weather Summary A small but key corn and soybean area in western Argentina was wetter than expected overnight. T-storms affect varying areas of South America at varying times into January, but
June 2015 Climate Summary
 Ken Scheeringa And Mary Rose Mangan Jul 10, 2015 (765) 494-8105 http://www.iclimate.org June 2015 Climate Summary Month Summary Indiana set a new June rainfall record this month with a state average 8.99.
Arizona Climate Summary May 2012
 Arizona Climate Summary May 2012 Summary of conditions for April 2012 April 2012 Temperature and Precipitation Summary April 1 st 16 th : Although April began with another low pressure system sweeping
Weekly Weather. Flash. Europe. September 18 October 1
 Weekly Weather September 18 October 1 Flash US THIS WEEK: The Official Start of Fall Brings Cooler Temperatures to the West, While the East Holds On to the Heat; Rain Expected Across the Northern Tier