March 2018 Climate Summary
|
|
|
- Stephany Cain
- 5 years ago
- Views:
Transcription

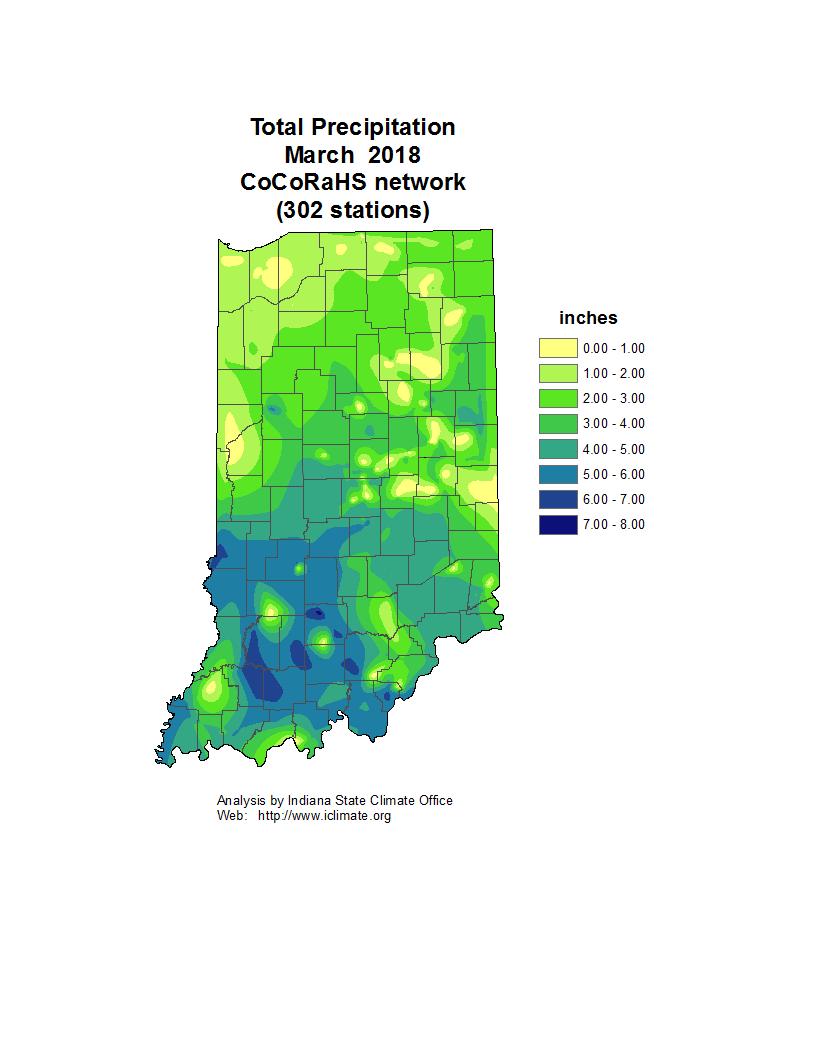
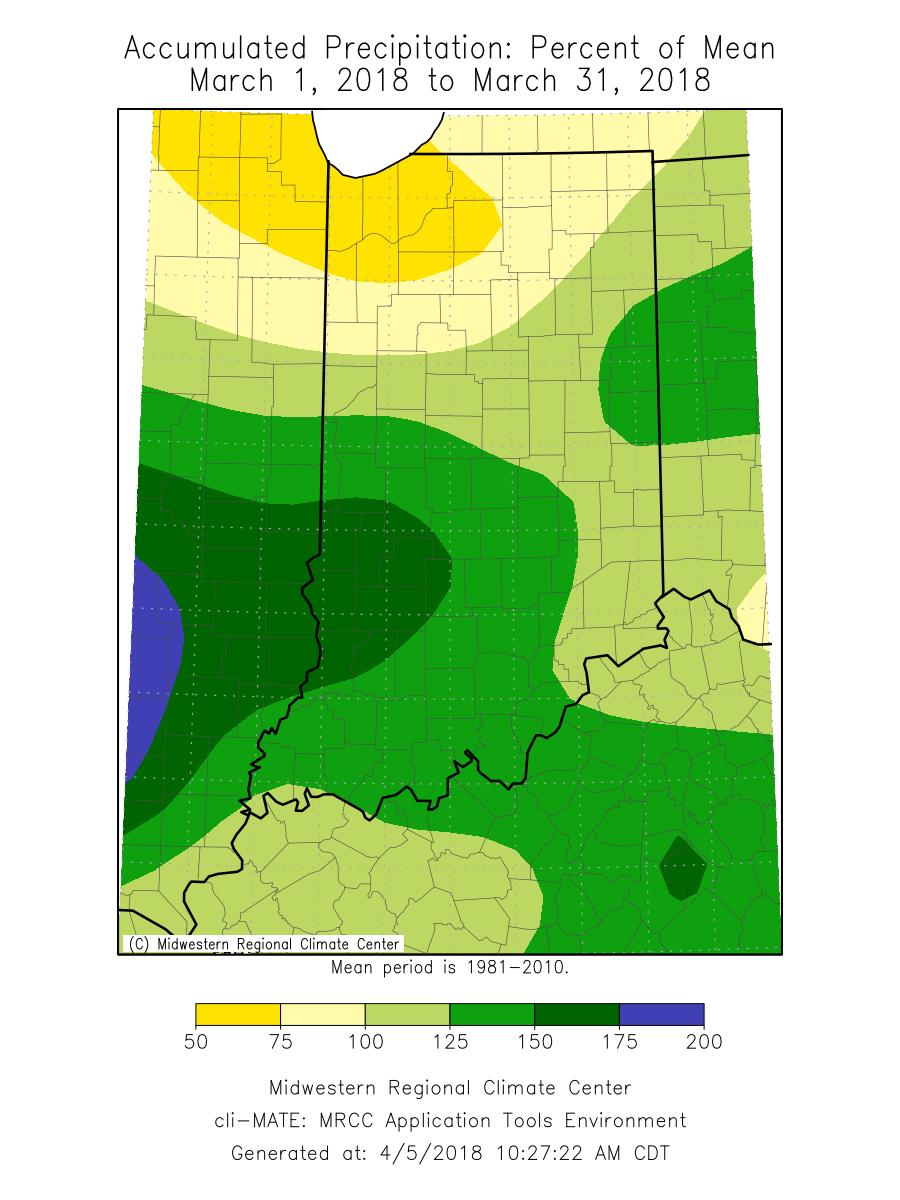
1 Ken Scheeringa and Andy Eggert Apr 5, 2018 (765) March 2018 Climate Summary Month Summary March turned cold with below normal temperatures on two-thirds of its days. Along with the cold came snow but the heaviest amounts were not in the usual lake effect region. A surprise snow fell in far southwest Indiana. Later a New England nor easter spread snow into eastern Indiana. Then a southern warm front laid down a thin strip of heavy snow across central Indiana counties. Hazardous roads on 4 days caused multiple vehicle accidents with at least 3 deaths attributed to snow and ice. The number of counties eligible for state disaster assistance was raised to 35 in the aftermath of the February flooding. The state average temperature in March was 38.0 F, a chilly 2.7 below normal. This ranks the month as the 48 th coldest March on record. Some recent colder Marches since 2000 include 2005 as the 42 nd coldest, March 2015 tied with 2001 at 40 th coldest, and 2013 in the 18 th slot. March 2014 ranks as the 13 th coldest on the list. The record coldest March took place in 1960 with its state average temperature of 25.4 F. The day split in March 2018 was 21 days of below normal temperature, 7 days above normal, and 3 days at normal. There was 1 day when the daily state average temperature was 10 F or more above normal. Despite the persistent cold weather there were no days at 10 F or more below normal. The highest temperature of the month was 68 F at Mount Vernon on March 16 th. The coldest was 8 F on March 21 st at Columbia City. March state average precipitation came in at This is 0.54 above normal and ranks March 2018 as the 44 th wettest March on record since state records began in Some recent wet Marches since 2000 include last year as the 41 st wettest March, 2002 pegged at 31 st wettest, and 2016 in a tie with 1991 as 28 th wettest. March 2006 ranks as the 15 th wettest while 2008 comes in as the 8 th wettest March on record. The infamous floods of March 1913 were triggered in part by the 8.74 of state average precipitation recorded that month, topping the list as the wettest March on record in Indiana. The heaviest single day precipitation in March 2018 among cooperative network stations was 2.00 on March 28 th at French Lick 3n. The highest in the CoCoRaHS network was 3.70 on March 1 st at West Lafayette 4.9w. The largest month total in the cooperative network was 6.91 at Greensburg. In the CoCoRaHS network the largest total was 7.81 at Oolitic 2.2n. Widespread precipitation fell on about 13 days this month. Regionally March 2018 precipitation summed to near 85% of normal across northern Indiana and 125% of normal across central and southern Indiana. Normal March precipitation ranges from 2.7 in northeast Indiana to 4.2 in southwest counties.
2 The largest single day snowfall among cooperative stations was 10.2 on March 24 th at the Indianapolis Airport. In the CoCoRaHS network it was 12.6 on March 25 th at Avon 1.6nnw. The greatest month total in the cooperative network was 14.1 at Danville 3sw and in the CoCoRaHS network 14.7 at Clayton 0.4wnw. Widespread snow fell on about 4 days this month. March 1 st 10 th The warm spell the last two weeks of February ended a few days into March. Indiana temperatures the first 10 days of the new month trended from above normal, to normal, then below normal to finish out the interval. Both rain and snow fell in Indiana but amounts were more reasonable than the deluge experienced the previous two weeks. Damages from the February floods continued to be tallied. The governor added 5 more counties to the state disaster declaration on March 9 th. Icy roads in Lake county on March 8 th caused vehicle accidents with injuries on the interstates. March opened with a state temperature at a very warm 11 F above normal. A cold front was crossing Indiana with moderate rain, pushed east by high pressure and a cold air mass moving out of the Great Plains. By the next day the cold front had accelerated beyond the Atlantic shoreline, merging with another storm to form an intense New England nor easter. The Plains high center had now arrived in Indiana, ending the precipitation and providing sunny skies. The Indiana state temperature began its long slide, falling to 3 F above normal. On March 3 rd the high center took control of weather across the eastern half of the country except New England where the nor easter was departing. The Indiana state temperature dipped slightly to 2 F above normal under sunny skies with light northerly winds. The high pressure ridge extended southward from Hudson Bay all the way to the Gulf coast the next day. The state temperature settled to right at normal for this date in March. The extended ridge weakened on March 5 th. Low pressure over Nebraska was able to puncture the ridge core with a stationary front positioned over Tennessee. Indiana skies began to cloud over. The state temperature remained at normal. The Nebraska storm drifted east into Iowa the next day as it occluded. Warmer air outran the low center as the occluded front whipped east through Indiana and wrapped around the Iowa core. The Indiana state temperature rose temporarily to 2 F above normal. The mature Iowa center weakened on March 7 th, transferring its energy to a new low center in Michigan. Cooler air filtered into Indiana behind the new low center. The state temperature resumed its fall to 5 F below normal. Storms began to depart Indiana the next day. A ridge extended from Canada through Kansas and Texas, drawing in colder air ahead of it into the Midwest. The Indiana state temperature bottomed out at 9 F below normal. The ridge traveled overhead Indiana on March 9 th. With mostly sunny skies the state temperature rebounded slightly to 5 F below normal. The next day the weather map repeated its positioning of 4 days earlier. The southern portion of the ridge weakened as another stationary front formed over Tennessee. The Indiana state temperature responded by rising to 3 F below normal to close out the 10 day interval. Over the 10 days the Indiana state temperature averaged right at normal. Usually at the start of March the daily maximum temperature should vary from 42 F in far northern Indiana counties to
3 53 F in the southwest corner of the state. Daily minimums normally range between 25 F and 32 F north to south across the state. The warmest temperature among cooperative network stations over the 10 day interval was 66 F at Mount Vernon on March 7 th. The coolest temperature among stations in this same network was 12 F at Terre Haute ISU on March 4 th. Snow the first 10 days of March fell generally east of a Lowell to Spencer to Madison line. The heaviest band of 1 to 6 was located in the usual lake effect region, mostly north of a Valparaiso to Fort Wayne line. Snowfall was scattered over northeast Indiana on March 2 nd and 9 th, across the northern tier of counties on March 6 th, across the north half of Indiana on March 7 th, and in northern and central Indiana on March 8 th. The highest single day snowfalls were recorded on March 8 th. On that date the CoCoRaHS observer near Chesterton measured 3.0 while 2.3 was noted outside Mishawaka, and 2.0 was received near Wanatah. Over the 10 days the Chesterton volunteer summed to 4.8 of snowfall and Mishawaka had 3.7. The Wanatah observer totaled 3.1, Albion 2.9, and the Wakarusa station had 2.7. On the 10 day precipitation map more than 0.75 was measured across the north half of Indiana and in some southwestern counties. A region of 1 to 2 was noted across the eastern part of Indiana generally northeast of a line from Laporte to Fort Wayne, then on to Crawfordsville, then to Winchester. Regionally about 1.0 of precipitation was recorded across northern and central Indiana with 0.6 in the south. These amounts equate to about 110% of normal in northern Indiana, 90% in central counties, and 50% of normal across the southern third of the state. The greatest single day precipitation was recorded on March 2 nd. On that day the Granger observer caught 1.30 in the gage while the volunteers near Muncie and Hamilton had In Lagrange 1.17 was collected and in Goshen Over the 10 days the Granger station summed to 1.68 while Milford and Ossian tallied Southeast of Fort Wayne the total was Rainfall was seen statewide on March 1 st, 2 nd, and on the 6 th except in the north tier of counties, in the south half of the state on March 7 th, in the south third on March 10 th, and in scattered locations on March 8 th and 9 th. Road conditions were slick on March 7 th in Lake county. There were many crashes along the I-80/I-94 interstate, impeding traffic for hours. An officer investigating a previous accident was injured along with two other people when they were hit by another motorist who lost control on the highway. The full impacts of February flooding continued to be realized over time. The governor of Indiana declared 5 more counties eligible for state disaster assistance including Laporte, Noble, Wabash, Warren, and Posey counties, bringing the updated total to 31 affected counties.
4 March 11 th 17 th A cold spell which began March 7 th persisted all week long. Precipitation continued to trend lower since the February flooding. Total amounts were much below normal this week. A heavy snowfall in extreme southwest Indiana on March 11 th caused numerous vehicle accidents as it caught many drivers by surprise. Counties impacted by last month s floods continued to tally the damage for potential disaster declarations. The governor of Indiana added 4 more Indiana counties to his disaster emergency declaration, increasing the total to 35 counties, more than a third of the state. Northern Indiana weather was controlled by Michigan high pressure on March 11 th. A stationary front over Tennessee brought clouds and snow to southern counties. The state temperature opened the week at 3 F below normal. The southern front weakened and shuffled east while the high center traveled to Maine the next day. A trough passed through Indiana, drawing in cooler air from the northwest. The state temperature fell to 6 F below normal. The northern trough headed to New York as a nor easter raged off the New England coast on March 13 th. A ridge of high pressure over the Dakotas and Nebraska began to clear Indiana skies and transport colder air into the state. The ridge dove south to Oklahoma the next day. The west edge of the nor easter backed into eastern Indiana where snow and rain were scattered. This and the previous day were the coldest of the week at 8 F below normal. High pressure traveled from northern Canada into Manitoba on March 15 th. A cold front ahead of the Canadian ridge passed through Indiana. A second cold front was immediately behind in Wisconsin and Michigan. The southern high center had yielded, heading southward into the Gulf of Mexico. Warmer air in advance of the cold front lifted the Indiana state temperature to 2 F below normal. By the next morning both cold fronts had moved through Indiana and merged as a stationary front in Tennessee. This front was attached to a vigorous low pressure system over Kansas. The Manitoba high center had progressed into Wisconsin. With the passage of the second cold front the Indiana state temperature dipped to 6 F below normal. On March 17 th the Kansas low shifted east to Missouri. Its warm front set up along the Ohio River. Warmer moist air overran this warm front
5 and brought statewide showers to Indiana. The state temperature rose slightly to 4 F below normal to close out the week. Over the 7 days the state temperature averaged to 5 F below normal. Typically by mid-march the daily maximum temperature should range between 46 F and 56 F north to south across the state. The daily minimum normally varies from 28 F in far northern counties to 35 F in the southwest corner of the state. The warmest temperature of the week among cooperative network stations was 68 F at Mount Vernon on March 16 th. The coolest temperature among stations in this same network was 11 F at Rockville on March 14 th. Snowfall covered much of the state except along the west central border and in a wedge area between Rensselaer and Brookville. A 2 to 6 band in far northern Indiana in St Joseph and Marshall counties and in the far south between Warrick and Clark counties were the heaviest snow regions in the state. Up to 1 was common elsewhere. Snowfall was measured along the Ohio River on March 12 th, across the north tier of counties on March 13 th, was scattered statewide on March 14 th, and in the Lake effect region on March 17 th. The heaviest single day snowfall readings were logged on March 12 th when the Leopold observer captured 6.8, and the Elizabeth volunteer had 3.8. At Santa Claus 3.2 was collected while the amount in Carefree was 3.0. For the week the Leopold gage tallied 6.8, Plymouth noted 5.3, and outside Walkerton 5.0 fell. The CoCoRaHS volunteers in Carefree and near Galena each had 3.7. On the weekly precipitation map 0.5 to 1.0 was noted along the Ohio River generally south of a Vincennes to Madison line. Totals of 0.25 to 0.50 were common across the rest of the state except totals under 0.1 were the least in northeast Indiana counties. Regionally about 0.1 fell on average across northern Indiana with 0.2 in the central section of the state and 0.3 across the south. These amounts equate to about 25% of normal in the north, 35% in central, and 30% of normal in the southern third of Indiana. Rain was found in gages along the Ohio border on March 13 th, in scattered areas across the state on March 14 th, and statewide on March 17 th. The heaviest single day precipitation amounts were recorded on March 12 th and included 0.79 at Newburgh, 0.74 in Leopold, 0.55 in the Holland vicinity, 0.54 in Boonville, and 0.53 at Santa Claus. For the week the sum at Newburgh was Leopold had The total close to Holland was 0.75, Santa Claus had 0.69, and 0.66 was tallied near Boonville. Heavy snowfall on March 11 th caught residents of Vanderburgh county off guard. Roads were very slick that evening resulting in multiple minor accidents and vehicle slide offs. The aftermath of February flooding continued. Residents of cities and towns in St Joseph and neighboring counties were assessing individual damages to help the state prepare applications for federal disaster aid. About 600 homes were estimated to have been damaged in St Joseph county and 1200 in Elkhart county alone. On March 16 th the governor of Indiana added 4 more counties to the list of those he previously declared eligible for expanded state emergency services. This brings to 35 the total number of counties eligible for state assistance. This is a required legal step to apply for federal disaster
6 emergency funds for the state. The 4 added counties were Gibson, Lagrange, Vanderburgh, and Vermillion. March 18 th 24 th According to the calendar spring began this week! But Indiana winter wasn t ready to go away. Indiana temperatures averaged slightly above normal to start the week then abruptly returned to colder than normal. Two snow storms hit Indiana immediately after spring began, one caused by another New England nor easter and the other by a southern warm front. Both storms delivered surprisingly heavy spring snowfall. At least 3 people died in vehicle accidents due to these storms. Precipitation for the week trended from very light amounts in northern Indiana to heavy across the south. High pressure was centered over Indiana on March 18 th. A stationary front was positioned over the Great Lakes and a cold front near the Gulf of Mexico. The Indiana state temperature opened the week at 1 F above normal, ending an 11 day cold spell. The next day the stationary front surged south, working its way through Indiana. The state temperature remained stable initially. The cold front completed its passage through Indiana and attached to a Kentucky low center, extending to the eastern edges of Tennessee, North Carolina, and Georgia on March 20 th. Cold air from Canada funneled in behind the low center, lowering the Indiana temperature suddenly to 7 F below normal. This low center joined forces with another southern low the next day and moved off the Delaware shore. The joint system developed into another nor easter headed for New England. Other low pressure centers had formed just west of the nor easter with troughs linked as far away as eastern Indiana. This important feature allowed ocean moisture to be easily circulated around the nor easter and into the troughs over Indiana. The cold air over Indiana allowed the moisture to condense into accumulating snowfall which pestered eastern Indiana counties most of the day. On March 22 nd the nor easter trekked to Maine and beyond the reach of Indiana. The snow stopped over eastern counties and a ridge that spread from Ontario to Arkansas cleared Indiana skies. The state temperature barely changed over these 3 days and stood at 6 F below normal. The ridge drifted east the next day and extended from Hudson Bay to Indiana to Georgia. Two fronts formed
7 southwest of Indiana but neither had real impact on current weather. Once again the state temperature held steady at 6 F below normal. A Colorado low center moved to Missouri on March 24 th. Its warm front stretched from Missouri to Georgia. Precipitation spread over much of the southern half of Indiana. The state temperature average dipped to 8 F below normal to close out the week. Overall the state temperature over the 7 days averaged to 4 F below normal. Usually at this point in March the daily maximum temperature should vary between 49 F in far northern Indiana to 59 F in the far southwest corner of the state. Daily minimums normally range between 30 F and 37 F north to south across the state. The warmest temperature of the week within the cooperative station network was 67 F at Patoka Lake on March 19 th. The coolest temperature among stations in this same network was 8 F at Columbia City on March 21 st. No snow fell this week generally north of a Clinton to Angola line. To the south snowfall trended heavier towards south central Indiana. This is a reversal of the usual lighter south to heavier north snowfall gradient typical of Indiana. Amounts in the 6 to 10 range fell mostly in Lawrence, Orange, Washington, Clark, Floyd, Harrison, Crawford, and Dubois counties. Snow was observed in the southeast two-thirds of Indiana in the March 21 st CoCoRaHS report, and in central and southeast areas of the state on March 24 th. These were the major snow events this week. Scattered snow amounts were measured around the state on March 18 th and 20 th, and along the Ohio border on March 22 nd. The heaviest single day snowfall measurements were taken on March 21 st. On that day the CoCoRaHS observer near New Albany recorded 11.0 while two Galena volunteers had 8.2 and 7.5. In New Salisbury 8.0 was collected while in Elizabeth 7.4 was noted. For the week some of the heavier snow totals included 10.3 in Castleton, 9.7 and 9.5 summed by two observers near Galena, 8.8 in New Salisbury, and 8.5 at Jeffersonville. On the weekly precipitation map generally nothing was received across the northern tier of Indiana counties and in parts of Jasper, Starke, Pulaski, White, Tippecanoe, and Carroll counties. At least 0.5 was recorded mostly south of an Attica to Spencer to Brookville line. More than 1.0 fell mostly south of a Rockville to Sellersburg line. The heaviest amounts in excess of 2.0 were caught in Sullivan county and in other pocket areas of southwest and south central Indiana. Regionally less than 0.1 of average precipitation was observed across northern Indiana, about 0.5 in central, and 1.4 across the south. These amounts equate to about 10% of normal in the northern third of Indiana, 70% of normal in central sections, and 140% of normal throughout the south. Separating out rainfall, measurements show rain was scattered across the state on March 18 th and across the southern half of the state on March 20 th. Rain fell in much of east central and southeast Indiana on March 22 nd and across the southwest quarter of the state on March 24 th. The heaviest single day of precipitation was noted on March 24 th and included 1.35 in the West Terre Haute vicinity, 1.20 at Stendal, 1.00 in Oolitic, and 0.95 at Newburgh. Some large total precipitation numbers for the week included 1.85 and 1.66 in Jeffersonville, 1.76 and 1.71 according to two rain gages in Galena, and 1.66 near Milltown. Some eastern Indiana residents were amazed at the long reach of the March 21 st nor easter off the Atlantic coast to Indiana. More than 8 of snow impacted southern and eastern counties of the state
8 as moisture was transported from the Atlantic ocean over the Appalachian Mountains to as far west as Indiana. The cities hit hardest directly by the nor easter seemed to be Salem and Floyds Knobs at 8 of snowfall while adjacent areas had at least 6. Numerous accidents occurred east of Indianapolis on I-70 and along I-74 in southeast Indiana. Even Indianapolis far to the west received nearly 2 from the nor easter. Three days later an unusual weather system unloaded more snowfall on Indiana. North of a warm front a very narrow 15 mile wide band of heavy snow formed parallel to this front which extended over 1400 miles from North Dakota to North Carolina, passing directly over Indiana. While cities in the direct path of the snow band received 10 of snow or more, just a few miles on either side of the band no snow was observed! The rate of snowfall was intense in the core of the band, prompting 4 counties to issue travel warnings due to very low driving visibility. The intense snowfall caused many accidents, including at least 150 in Indianapolis alone. There were injuries in 17 of those accidents. In nearby Speedway two people died in a vehicle accident there. In Jackson county a vehicle on an interstate overpass slid on the bridge pavement, broke through the guard rail, and crushed another vehicle passing under the structure at the time. The motorist on top the overpass was critically injured. In Jennings county a young driver was killed in a two vehicle crash in an intersection just outside a city. March 25 th 31 st It was another cool week in Indiana. The daily state average temperature registered below normal on 6 of the final 7 days of the month. Snowfall was reported on just the first day. While there was no measurable snow the rest of the week it did rain moderately on 5 more days. The frequent precipitation placed week totals well above normal in all regions of the state. Fortunately there was no severe weather and no additional flood impacts. A high pressure center expanded to Indiana through the back door, via Quebec, an unusual path from the northeast rather than the far more common northwest. The state temperature on March 25 th was a cold 6 F below normal. The next day the Quebec ridge drifted to Maine and sprawled
9 south to Virginia. This location positioned Indiana on the warmer backside of the ridge and helped lift the state temperature to 2 F below normal. On March 27 th a low pressure system from Oklahoma traveled to Wisconsin. The storm s warm front made its way through Indiana and placed the state into a warm sector ahead of its paired cold front in Illinois. The daily Indiana state temperature rose a few more degrees to right at normal for this date. A rainy period began which would continue the next several days. The next day the Wisconsin low moved to New York, dragging its cold front through Indiana. This front slowed and finally stalled as a stationary front at the Ohio River. The weak front had little impact on the state temperature which rose a bit more to 2 F above normal. This was the warmest day of the week. The stationary front reversed direction and drifted north into southern Indiana on March 29 th. Meanwhile another high center moved out of central Canada into North Dakota, led by a cold front crossing into Michigan and Illinois. Two fronts were in close proximity, the stationary front over southern Indiana, and the cold front in Illinois, with a series of low pressure centers riding along the southern front. The state temperature dipped to 1 F below normal. The North Dakota high center muscled both fronts through Indiana to Maryland the next day. High pressure took over Midwest states from Iowa to Oklahoma, tapping into cooler Canadian air and ending days of rainfall. The Indiana state temperature fell to 3 F below normal. On March 31 st the Midwest ridge slid east to Virginia and swept the old fronts into the Atlantic Ocean. Indiana was repositioned behind the high center, permitting a break from the rain and drawing a drier southerly wind backflow into the state. The state temperature remained at 3 F below normal as the month came to an end. Over the 7 days the Indiana state temperature averaged to 2 F below normal. Usually in this last week of March the state daily maximum temperature should range between 52 F and 61 F north to south across the state. The daily minimum typically varies from 32 F in far northern counties to 39 F in the far southwest corner of the state. The warmest daily temperature among cooperative network stations was 67 F at Cannelton on March 28 th. The coolest daily temperature among stations in this same network was 12 F at Huntington on March 25 th. Snow was reported just one day this week, March 25 th, so the daily measurements also represent the weekly totals. The snowfall pattern was unique for Indiana in that no snow was found in the northern third of the state, including the Lake Michigan effect region. Rather snow was limited to a northwest to southeast band across central Indiana, mostly south of a Fowler to Liberty line and north of a Vincennes to Spencer to Scottsburg line. Snow totals trended higher toward the center of this band with a heavy concentration of 6 to 12 in Hendricks county. Some specific heavier snowfall amounts noted by CoCoRaHS observers included 12.6 in Avon, 11.5 at Clayton, 10.2 near the Indianapolis airport, 9.9 outside Speedway, and 10.6 in Mooresville. On the weekly precipitation map the heaviest amounts fell in the southern half of the state, trending lighter northward to Lake Michigan. Higher amounts of 3 to 5 fell mostly south of a Clinton to Lebanon to Lawrenceburg line. Less than 1 was noted mostly north of a Fowler to Plymouth to Angola line. A few spots had 4 to 5 in Owen, Daviess, Lawrence, Martin, and Washington counties. Regionally about 1.2 was the average across the northern third of Indiana, 2.5 in central
10 counties, and 3.0 across the south. These totals equate to about 160% of normal in northern Indiana, 290% of normal in central, and 280% of normal in the south. Precipitation was heavy on 3 of the 6 wet days according to CoCoRaHS observers. Some of the heavier single day amounts included 1.90 at Spencer on March 25 th and 1.85 near Terre Haute on March 27 th. On March 28 th the CoCoRaHS volunteer at Poseyville collected 2.13 in the gage while 1.88 was captured outside Campbellsburg. At Francisco 1.86 was measured. For the entire week the Spencer gage tallied 5.02 while 4.71 was summed near Mitchell. Some other week numbers were 4.49 near Gosport, 4.44 at Oolitic, and 4.41 in the vicinity of Greenwood. Looking just at the rainfall portion of precipitation, rain was reported statewide on March 27 th, 28 th, 29 th, and 30 th. On March 31 st rainfall was scattered across the southeast half of the state.
11 March 2018 Temperature Region Temperature Normal Deviation Northwest North Central Northeast West Central Central East Central Southwest South Central Southeast State Precipitation Region Precipitation Normal Deviation Percent of Normal Northwest North Central Northeast West Central Central East Central Southwest South Central Southeast State
12 Spring so far(same as March) Temperature Region Temperature Normal Deviation Northwest North Central Northeast West Central Central East Central Southwest South Central Southeast State Precipitation Region Precipitation Normal Deviation Percent of Normal Northwest North Central Northeast West Central Central East Central Southwest South Central Southeast State
13 2018 Annual so far Temperature Region Temperature Normal Deviation Northwest North Central Northeast West Central Central East Central Southwest South Central Southeast State Precipitation Region Precipitation Normal Deviation Percent of Normal Northwest North Central Northeast West Central Central East Central Southwest South Central Southeast State
14
15
16

17

18 Drought Summary from the U.S. Drought Monitor Below is a drought summary for the state of Indiana from the U.S. Drought Monitor. Areas in white are not experiencing any drought. Yellow areas are abnormally dry, but not considered a drought. Drought begins when the moisture levels become more severe, with beige, orange, red, and brown indicating increasing levels of drought (moderate, severe, extreme, and exceptional, respectively). The table below indicates what percentage of the state is drought free, and how much of the state is in drought by degree of severity (D1 - D4 category).
19 Mar 6 th Drought Summary
20 Mar 13 th Drought Summary
21 Mar 20 th Drought Summary
22 Mar 27 th Drought Summary
October 2011 Climate Summary
 Ken Scheeringa and Kayla Hudson Nov 4, 2011 http://www.iclimate.org October 2011 Climate Summary Month Summary October weather evolved as a two part story. Weather conditions the first half of the month
March 2014 Climate Summary
 Ken Scheeringa And Matt Price Apr 8, 2014 (765) 494-8105 http://www.iclimate.org March 2014 Climate Summary Month Summary Winter had officially ended by the calendar but snow and cold persisted in Indiana
December 2011 Climate Summary
 Ken Scheeringa and Kayla Hudson Jan 17, 2012 (765) 494-8105 http://www.iclimate.org December 2011 Climate Summary Month Summary What a difference a year makes! A year ago the misery of a harsh, cold, and
November 2015 Climate Summary
 Ken Scheeringa And Mary Rose Mangan Dec 8, 2015 (765) 494-8105 http://www.iclimate.org November 2015 Climate Summary Month Summary November was much warmer than normal while precipitation was very near
January 2008 Climate Summary
 Joseph Mays (765) 494-6574 Feb 5, 2008 http://www.iclimate.org Summary January 2008 Climate Summary January was a mix bag of conditions, with an oscillatory pattern developing. We experienced phases of
August 2017 Climate Summary
 Ken Scheeringa And Andy Eggert Sep 7, 2017 (765) 494-8105 http://www.iclimate.org August 2017 Climate Summary Month Summary The coolest August in 13 years featured long cool and warm spells, below normal
July 2007 Climate Summary
 Dan Bowman (765) 494-6574 Sep 3, 2007 http://www.iclimate.org Summary July 2007 Climate Summary The month of July ended as a very unusual month. Many events occurred during the month of July that is not
August 2006 Summary. August 1-5
 Ashley Brooks (765) 494-6574 Sep 8, 2006 http://www.iclimate.org August 1-5 August 2006 Summary The heat wave that started during the end of July continued into the beginning parts of August with temperatures
March 2016 Climate Summary
 Ken Scheeringa And Andy Eggert Apr 8, 2016 (765) 494-8105 http://www.iclimate.org March 2016 Climate Summary Month Summary Count March as the 7 th month in a row that the state average temperature has
May 2018 Climate Summary
 Ken Scheeringa and Andy Eggert Jun 7, 2018 (765) 494-8105 http://www.iclimate.org May 2018 Climate Summary Month Summary As the calendar turned from April to May temperatures flipped dramatically away
January 2017 Climate Summary
 Ken Scheeringa And Andy Eggert Feb 8, 2017 (765) 494-8105 http://www.iclimate.org January 2017 Climate Summary Month Summary The warmest January in 11 years was nearly 4 F warmer than December 2016. An
October 2014 Climate Summary
 Ken Scheeringa And Matt Price Nov 10, 2014 (765) 494-8105 http://www.iclimate.org October 2014 Climate Summary Month Summary October featured a mix of weather. A very wet first half of the month evolved
January 2018 Climate Summary
 Ken Scheeringa and Andy Eggert Feb 8, 2018 (765) 494-8105 http://www.iclimate.org January 2018 Climate Summary Month Summary January temperature swings were amazing. In the first few days arctic cold pushed
September 2016 Climate Summary
 Ken Scheeringa And Andy Eggert Oct 6, 2016 (765) 494-8105 http://www.iclimate.org September 2016 Climate Summary Month Summary The warmest September in 77 years brought alternating weeks of dry and wet
November 2014 Climate Summary
 Ken Scheeringa And Matt Price Dec 10, 2014 (765) 494-8105 http://www.iclimate.org November 2014 Climate Summary Month Summary Unseasonable cold headlined the Indiana and national news in November. The
April 2016 Climate Summary
 Ken Scheeringa And Andy Eggert May 9, 2016 (765) 494-8105 http://www.iclimate.org April 2016 Climate Summary Month Summary One month but two seasons. The first half of April was cold with snow. Wind damage
August 2013 Climate Summary
 Ken Scheeringa and Matt Price Sep 6, 2013 (765) 494-8105 http://www.iclimate.org August 2013 Climate Summary Month Summary August weather began cool and wet but became progressively warmer and drier through
February 2017 Climate Summary
 Ken Scheeringa And Andy Eggert Mar 9, 2017 (765) 494-8105 http://www.iclimate.org February 2017 Climate Summary Month Summary February 2017 was the warmest February in Indiana since state climate records
October 2017 Climate Summary
 Ken Scheeringa and Andy Eggert Nov 6, 2017 (765) 494-8105 http://www.iclimate.org October 2017 Climate Summary Month Summary After more than three weeks of warm temperatures October turned suddenly cold
November 2012 Climate Summary
 Ken Scheeringa and Kayla Hudson Dec 6, 2012 (765) 494-8105 http://www.iclimate.org November 2012 Climate Summary Month Summary November was one of those rare weather months in Indiana when not much happened:
May 2016 Climate Summary
 Ken Scheeringa And Andy Eggert Jun 6, 2016 (765) 494-8105 http://www.iclimate.org May 2016 Climate Summary Month Summary Cold weather dominated in May until the last week of the month. May began wet but
April 2017 Climate Summary
 Ken Scheeringa And Andy Eggert May 8, 2017 (765) 494-8105 http://www.iclimate.org April 2017 Climate Summary Month Summary April was a very warm and wet month in Indiana, nearly setting a new monthly temperature
January 2012 Climate Summary
 Ken Scheeringa and Kayla Hudson Feb 6, 2012 (765) 494-8105 http://www.iclimate.org January 2012 Climate Summary Month Summary Where is winter? This question found its way into many conversations throughout
September 2011 Climate Summary
 Ken Scheeringa and Kayla Hudson Oct 5, 2011 (765) 494-8105 http://www.iclimate.org September 2011 Climate Summary Month Summary The final blast of summer heat arrived at the start of September. It lasted
January 2006 Climate Summary
 Ashley Brooks (765) 494-6574 Feb 9, 2006 http://www.iclimate.org January 1-3 January 2006 Climate Summary Unseasonably warm conditions welcomed in the New Year with highs in the 40s across the northern
April 2015 Climate Summary
 Ken Scheeringa And Mary Rose Mangan May 8, 2015 http://www iclimate org April 2015 Climate Summary Month Summary April was a month of extremes. Severe weather erupted on 4 days of the first week with multiple
February 2016 Climate Summary
 Ken Scheeringa And Andy Eggert Mar 9, 2016 (765) 494-8105 http://www.iclimate.org February 2016 Climate Summary Month Summary February was the 6 th consecutive month with an above normal state average
October 2016 Climate Summary
 Ken Scheeringa And Andy Eggert Nov 9, 2016 (765) 494-8105 http://www.iclimate.org October 2016 Climate Summary Month Summary October was the 9 th month so far this year to average above normal in temperature.
May 2005 Climate Summary
 Ashley Brooks (765) 494-6574 Jun 7, 2005 http://iclimate.org May 2005 Climate Summary May 1-5 Early May was characterized by an upper-level trough that was in place over Indiana that brought in very cool
November 2010 Climate Summary
 Ken Scheeringa (765) 494-8105 Dec 6, 2010 http://www.iclimate.org November 2010 Climate Summary Summary A four month drought in Indiana is collapsing as significant rain fell the final week of November.
August 2015 Climate Summary
 Ken Scheeringa And Mary Rose Mangan Sep 4, 2015 (765) 494-8105 http://www.iclimate.org August 2015 Climate Summary Month Summary A very active wet summer weather pattern turned much calmer and drier in
January 2013 Climate Summary
 Ken Scheeringa and Kayla Hudson Feb 7, 2013 (765) 494-8105 http://www.iclimate.org January 2013 Climate Summary Month Summary Winter or spring? January featured several dramatic swings in temperature and
November 2016 Climate Summary
 Ken Scheeringa And Andy Eggert Dec 15, 2016 (765) 494-8105 http://www.iclimate.org November 2016 Climate Summary Month Summary Unseasonably warm, pleasant, and sunny weather the first half of the month
September 2005 Climate Summary
 Ashley Brooks (765) 494-6574 Oct 5, 2005 http://iclimate.org September 2005 Climate Summary September 1-7 A cold front came through on the 1 st of the month, however little moisture was associated with
April 2013 Climate Summary
 Ken Scheeringa and Kayla Hudson May 6, 2013 (765) 494-8105 http://www.iclimate.org April 2013 Climate Summary Month Summary Temperatures bounced high and low this month, keeping Hoosiers guessing which
2011 Year in Review TORNADOES
 2011 Year in Review The year 2011 had weather events that will be remembered for a long time. Two significant tornado outbreaks in April, widespread damage and power outages from Hurricane Irene in August
November 2017 Climate Summary
 Ken Scheeringa and Andy Eggert Dec 8, 2017 (765) 494-8105 http://www.iclimate.org November 2017 Climate Summary Month Summary November temperatures alternated spells of warm and cool while precipitation
July 2010 Climate Summary
 Ken Scheeringa (765) 494-8105 Aug 4, 2010 http://www.iclimate.org July 2010 Climate Summary Summary The warm summer of 2010 continues. Daily state average temperatures were above normal on all but seven
June 2016 Climate Summary
 Ken Scheeringa And Andy Eggert Jul 8, 2016 (765) 494-8105 http://www.iclimate.org June 2016 Climate Summary Month Summary June was a warm month with below normal temperature on just 6 days. Rainfall was
March 2009 Climate Summary
 Joseph Mays (765) 494-6574 Apr 1, 2009 http://www.iclimate.org Summary March 2009 Climate Summary March is in the books and it continued the trend of extreme weather we have experienced during the first
May 2015 Climate Summary
 Ken Scheeringa And Mary Rose Mangan Jun 8, 2015 (765) 494-8105 http://www.iclimate.org May 2015 Climate Summary Month Summary May was a very warm month. Rainfall averaged near normal but was distributed
National Wildland Significant Fire Potential Outlook
 National Wildland Significant Fire Potential Outlook National Interagency Fire Center Predictive Services Issued: April 1, 2008 Next Issue: May 1, 2008 Wildland Fire Outlook April 2008 through July 2008
Monthly Long Range Weather Commentary Issued: APRIL 18, 2017 Steven A. Root, CCM, Chief Analytics Officer, Sr. VP,
 Monthly Long Range Weather Commentary Issued: APRIL 18, 2017 Steven A. Root, CCM, Chief Analytics Officer, Sr. VP, sroot@weatherbank.com MARCH 2017 Climate Highlights The Month in Review The average contiguous
NWS FORM E-5 U.S. DEPARTMENT OF COMMERCE HSA OFFICE:
 NWS FORM E-5 U.S. DEPARTMENT OF COMMERCE HSA OFFICE: NOAA, NATIONAL WEATHER SERVICE MONTHLY REPORT OF RIVER AND FLOOD CONDITIONS DATE: TO: North Webster, IN REPORT FOR (MONTH &YEAR): July 1998 August 5,
National Wildland Significant Fire Potential Outlook
 National Wildland Significant Fire Potential Outlook National Interagency Fire Center Predictive Services Issued: September, 2007 Wildland Fire Outlook September through December 2007 Significant fire
NWS FORM E-5 U.S. DEPARTMENT OF COMMERCE I HYDRO SERVICE AREA NOAA, NATIONAL WEATHER SERVICE I Indianapolis, IN MONTHLY REPORT
 NWS FORM E-5 U.S. DEPARTMENT OF COMMERCE I HYDRO SERVICE AREA NOAA, NATIONAL WEATHER SERVICE I Indianapolis, IN. 1-------------------- MONTHLY REPORT OF RIVER AND FLOOD CONDITIONSI REPORT FOR I November
October 2012 Climate Summary
 Ken Scheeringa and Kayla Hudson Nov 8, 2012 (765) 494-8105 http://www.iclimate.org October 2012 Climate Summary Month Summary In a reversal from the hot and dry summer, cooler and wetter than normal conditions
March 2011 Climate Summary
 Ken Scheeringa (765) 494-8105 Apr 5, 2011 http://www.iclimate.org March 2011 Climate Summary Summary The fast paced weather action of February slowed some in March. The major March weather features were
April 2011 Climate Summary
 Ken Scheeringa (765) 494-8105 May 9, 2011 http://www.iclimate.org April 2011 Climate Summary Summary After somewhat of a respite in March Indiana weather ramped up with a vengeance in April. Extreme weather
The Pennsylvania Observer
 The Pennsylvania Observer April 2, 2009 March 2009 Pennsylvania Weather Recap Prepared by Curt Harpster For the month of March the saying, In like a lion and out like a lamb really fit the pattern quite
NATIONAL WEATHER SERVICE
 January 2016 February 9, 2016 This was a dry month across the HSA despite one large and several smaller snowfalls. Most locations ended up 1-2 inches below normal for the month. The driest locations at
July 2011 Climate Summary
 Ken Scheeringa (765) 494-8105 Aug 8, 2011 http://www.iclimate.org July 2011 Climate Summary Month Summary The upper atmospheric high pressure dome which baked the Texas area in heat and drought the past
Summary of November Central U.S. Winter Storm By Christopher Hedge
 Summary of November 12-13 2010 Central U.S. Winter Storm By Christopher Hedge Event Overview The first significant snowfall of the 2010-2011 season affected portions of the plains and upper Mississippi
June 2010 Climate Summary
 Ken Scheeringa (765) 494-8105 Jul 6, 2010 http://www.iclimate.org June 2010 Climate Summary Summary Summer like heat and humidity arrived in Indiana on May 22 nd and dominated our weather scene nearly
Weather and Climate Summary and Forecast April 2018 Report
 Weather and Climate Summary and Forecast April 2018 Report Gregory V. Jones Linfield College April 4, 2018 Summary: A near Miracle March played out bringing cooler and wetter conditions to the majority
Weather and Climate Summary and Forecast March 2018 Report
 Weather and Climate Summary and Forecast March 2018 Report Gregory V. Jones Linfield College March 7, 2018 Summary: The ridge pattern that brought drier and warmer conditions from December through most
June 2011 Climate Summary
 Ken Scheeringa (765) 494-8105 Jul 8, 2011 http://www.iclimate.org June 2011 Climate Summary Month Summary The abundance of extreme weather this year extended yet another month into June. This month has
Weather and Climate Summary and Forecast Winter
 Weather and Climate Summary and Forecast Winter 2016-17 Gregory V. Jones Southern Oregon University February 7, 2017 What a difference from last year at this time. Temperatures in January and February
Champaign-Urbana 1998 Annual Weather Summary
 Champaign-Urbana 1998 Annual Weather Summary ILLINOIS STATE WATER SURVEY Audrey Bryan, Weather Observer 2204 Griffith Dr. Champaign, IL 61820 wxobsrvr@sparc.sws.uiuc.edu The development of the El Nìno
W I N T E R STORM HAZARD DESCRIPTION
 W I N T E R STORM HAZARD DESCRIPTION... 1 LOCATION... 2 EXTENT... 2 HISTORICAL OCCURRENCES... 4 SIGNIFICANT PAST EVENTS... 4 PROBABILITY OF FUTURE EVENTS... 5 VULNERABILITY AND IMPACT... 5 HAZARD DESCRIPTION
The hydrologic service area (HSA) for this office covers Central Kentucky and South Central Indiana.
 for this office covers Central Kentucky and South Central Indiana.") January 2012 February 13, 2012 An X inside this box indicates that no flooding occurred within this hydrologic service area. January 2012 continued the string of wet months this winter. Rainfall was generally
January 2012 February 13, 2012 An X inside this box indicates that no flooding occurred within this hydrologic service area. January 2012 continued the string of wet months this winter. Rainfall was generally
The hydrologic service area (HSA) for this office covers Central Kentucky and South Central Indiana.
 for this office covers Central Kentucky and South Central Indiana.") MONTH YEAR January 2011 February 15, 2011 X An X inside this box indicates that no flooding occurred within this hydrologic service area. January 2011 was drier than normal in all locations in the area.
MONTH YEAR January 2011 February 15, 2011 X An X inside this box indicates that no flooding occurred within this hydrologic service area. January 2011 was drier than normal in all locations in the area.
Air Masses, Fronts, Storm Systems, and the Jet Stream
 Air Masses, Fronts, Storm Systems, and the Jet Stream Air Masses When a large bubble of air remains over a specific area of Earth long enough to take on the temperature and humidity characteristics of
Weather and Climate Summary and Forecast Summer 2017
 Weather and Climate Summary and Forecast Summer 2017 Gregory V. Jones Southern Oregon University August 4, 2017 July largely held true to forecast, although it ended with the start of one of the most extreme
September 2012 Climate Summary
 Ken Scheeringa and Kayla Hudson Oct 5, 2012 (765) 494-8105 http://www.iclimate.org September 2012 Climate Summary Month Summary Summer slipped away and it felt a lot more like autumn in Indiana this month
INDIANAPOLIS, INDIANA
 The NWS FORM E-5 U.S. DEPARTMENT OF COMMERCE HYDROLOGIC SERVICE AREA: NATIONAL OCEANIC AND ATMOSPHERIC ADMINISTRATION NATIONAL WEATHER SERVICE INDIANAPOLIS, INDIANA REPORT FOR: MONTHLY REPORT OF RIVER
Foundations of Earth Science, 6e Lutgens, Tarbuck, & Tasa
 Foundations of Earth Science, 6e Lutgens, Tarbuck, & Tasa Weather Patterns and Severe Weather Foundations, 6e - Chapter 14 Stan Hatfield Southwestern Illinois College Air masses Characteristics Large body
Weekly Weather. Europe. February Flash. This Week: Warm East and Cold West; Heavy Rain and Snow in Some Areas
 Weekly Weather February 12 25 Flash US This Week: Warm East and Cold West; Heavy Rain and Snow in Some Areas A Look Ahead: Temperatures Run ; Severe Rain in the West Europe This Week: Cold Air Retreats
March 2012 Climate Summary
 Ken Scheeringa and Kayla Hudson Apr 4, 2012 (765) 494-8105 http://www.iclimate.org March 2012 Climate Summary Month Summary March was a month of weather extremes with records shattered almost as a daily
Flood warnings were issued for the Maumee, St. Marys, Blanchard, St. Joseph (Ohio), Tippecanoe, Tiffin, Eel and Wabash Rivers on the 30 th and 31 st.
, Tippecanoe, Tiffin, Eel and Wabash Rivers on the 30 th and 31 st.") NWS FORM E-5 U.S. DEPARTMENT OF COMMERCE HSA OFFICE: NOAA, NATIONAL WEATHER SERVICE MONTHLY REPORT OF RIVER AND FLOOD CONDITIONS DATE: TO: North Webster, IN REPORT FOR (MONTH &YEAR): January 2002 February
NWS FORM E-5 U.S. DEPARTMENT OF COMMERCE HSA OFFICE: NOAA, NATIONAL WEATHER SERVICE MONTHLY REPORT OF RIVER AND FLOOD CONDITIONS DATE: TO: North Webster, IN REPORT FOR (MONTH &YEAR): January 2002 February
Weather and Climate Summary and Forecast October 2017 Report
 Weather and Climate Summary and Forecast October 2017 Report Gregory V. Jones Linfield College October 4, 2017 Summary: Typical variability in September temperatures with the onset of fall conditions evident
Monthly Long Range Weather Commentary Issued: SEPTEMBER 19, 2016 Steven A. Root, CCM, Chief Analytics Officer, Sr. VP,
 Monthly Long Range Weather Commentary Issued: SEPTEMBER 19, 2016 Steven A. Root, CCM, Chief Analytics Officer, Sr. VP, sroot@weatherbank.com SEPTEMBER 2016 Climate Highlights The Month in Review The contiguous
Weather and Climate Summary and Forecast February 2018 Report
 Weather and Climate Summary and Forecast February 2018 Report Gregory V. Jones Linfield College February 5, 2018 Summary: For the majority of the month of January the persistent ridge of high pressure
The Pennsylvania Observer
 The Pennsylvania Observer January 5, 2009 December 2008 Pennsylvania Weather Recap The final month of 2008 was much wetter than average and a bit colder than normal. In spite of this combination, most
Monthly Long Range Weather Commentary Issued: July 18, 2014 Steven A. Root, CCM, President/CEO
 Monthly Long Range Weather Commentary Issued: July 18, 2014 Steven A. Root, CCM, President/CEO sroot@weatherbank.com JUNE 2014 REVIEW Climate Highlights The Month in Review The average temperature for
Impacts of the April 2013 Mean trough over central North America
 Impacts of the April 2013 Mean trough over central North America By Richard H. Grumm National Weather Service State College, PA Abstract: The mean 500 hpa flow over North America featured a trough over
July 2014 Climate Summary
 Ken Scheeringa And Matt Price Aug 8, 2014 (765) 494-8105 http://www.iclimate.org July 2014 Climate Summary Month Summary July was unseasonably cool and drier than normal. Rainfall was light in parts of
New Hampshire State Climate Office Dr. Mary D. Stampone, State Climatologist
 New Hampshire State Climate Office Dr. Mary D. Stampone, State Climatologist University of New Hampshire c/o Department of Geography 73 Main Street Durham, NH 03824 Phone: 603-862-3136 Fax: 603-862-4362
KANSAS CLIMATE SUMMARY February 2015
 KANSAS CLIMATE SUMMARY February 2015 Extended Cold Despite some record warm readings at a few locations, February was characterized by colder than normal conditions. This was particularly true during the
Monthly Long Range Weather Commentary Issued: February 15, 2015 Steven A. Root, CCM, President/CEO
 Monthly Long Range Weather Commentary Issued: February 15, 2015 Steven A. Root, CCM, President/CEO sroot@weatherbank.com JANUARY 2015 Climate Highlights The Month in Review During January, the average
Weather and Climate Summary and Forecast December 2017 Report
 Weather and Climate Summary and Forecast December 2017 Report Gregory V. Jones Linfield College December 5, 2017 Summary: November was relatively cool and wet from central California throughout most of
L.O Students will learn about factors that influences the environment
 Name L.O Students will learn about factors that influences the environment Date 1. At the present time, glaciers occur mostly in areas of A) high latitude or high altitude B) low latitude or low altitude
Weather and Climate Summary and Forecast January 2018 Report
 Weather and Climate Summary and Forecast January 2018 Report Gregory V. Jones Linfield College January 5, 2018 Summary: A persistent ridge of high pressure over the west in December produced strong inversions
The Pennsylvania Observer
 The Pennsylvania Observer October 1, 2015 September 2015 - Pennsylvania Weather Recap By: Quinn Lease The month of September will be remembered for its above normal temperatures and dry conditions that
The hydrologic service area (HSA) for this office covers Central Kentucky and South Central Indiana.
 for this office covers Central Kentucky and South Central Indiana.") NWS Form E-5 (04-2006) NATIONAL OCEANIC AND ATMOSPHERIC ADMINISTRATION (PRES. BY NWS Instruction 10-924) NATIONAL WEATHER SERVICE MONTHLY REPORT OF HYDROLOGIC CONDITIONS HYDROLOGIC SERVICE AREA (HSA) Louisville
NWS Form E-5 (04-2006) NATIONAL OCEANIC AND ATMOSPHERIC ADMINISTRATION (PRES. BY NWS Instruction 10-924) NATIONAL WEATHER SERVICE MONTHLY REPORT OF HYDROLOGIC CONDITIONS HYDROLOGIC SERVICE AREA (HSA) Louisville
2012 Growing Season Weather Summary for North Dakota. Adnan Akyüz and Barbara A. Mullins Department of Soil Science October 30, 2012
 2012 Growing Season Weather Summary for North Dakota Adnan Akyüz and Barbara A. Mullins Department of Soil Science October 30, 2012 Introduction The 2012 growing season (the period from April through September)
Weather and Climate Summary and Forecast March 2019 Report
 Weather and Climate Summary and Forecast March 2019 Report Gregory V. Jones Linfield College March 2, 2019 Summary: Dramatic flip from a mild winter to a top five coldest February on record in many locations
The Pennsylvania Observer
 The Pennsylvania Observer September 3, 2008 Summer 2008 Weather Summary Written by: Brian Thompson The opening days of June started dry, but a warm front brought a widespread rain a couple of days into
The Pennsylvania Observer
 The Pennsylvania Observer August 3, 2015 July 2015 - Pennsylvania Weather Recap By: Arthur Person Although this seventh month of 2015 was fairly normal across Pennsylvania as a whole, the details reveal
August 2016 Climate Summary
 Ken Scheeringa And Andy Eggert Sep 12, 2016 (765) 494-8105 http://www.iclimate.org August 2016 Climate Summary Month Summary Hot but tranquil weather the first half of August transitioned to a tormented
IC ARTICLE 19. DESCRIBING REAL PROPERTY; INDIANA COORDINATE SYSTEM. IC Chapter 1. Designation of Indiana Coordinate System; Zones
 IC 32-19 ARTICLE 19. DESCRIBING REAL PROPERTY; INDIANA COORDINATE SYSTEM IC 32-19-1 Chapter 1. Designation of Indiana Coordinate System; Zones IC 32-19-1-1 Designation of systems Sec. 1. The systems of
Arizona Climate Summary February 2012
 Arizona Climate Summary February 2012 Summary of conditions for January 2012 January 2012 Temperature and Precipitation Summary January 1 st 20 th : The New Year has started on a very dry note. The La
Champaign-Urbana 2001 Annual Weather Summary
 Champaign-Urbana 2001 Annual Weather Summary ILLINOIS STATE WATER SURVEY 2204 Griffith Dr. Champaign, IL 61820 wxobsrvr@sws.uiuc.edu Maria Peters, Weather Observer January: After a cold and snowy December,
JEFF JOHNSON S Winter Weather Outlook
 JEFF JOHNSON S 2017-2018 Winter Weather Outlook TABLE OF CONTENTS ABOUT THE AUTHOR Components of the seasonal outlook... 2 ENSO state/ocean temperatures... 3 Sub-seasonal outlooks... 4 Forecast models...
WeatherManager Weekly
 Issue 288 July 14, 2016 WeatherManager Weekly Industries We Serve Agriculture Energy/Utilities Construction Transportation Retail Our Weather Protection Products Standard Temperature Products Lowest Daily
NATIONAL WEATHER SERVICE
 NWS Form E-5 (PRES. BY NWS Instruction 10-924) MONTHLY REPORT OF HYDROLOGIC CONDITIONS HYDROLOGIC SERVICE AREA (HSA) MONTH YEAR TO: Hydrologic Information Center, W/OS31 NOAA s National Weather Service
Weather and Climate Summary and Forecast November 2017 Report
 Weather and Climate Summary and Forecast November 2017 Report Gregory V. Jones Linfield College November 7, 2017 Summary: October was relatively cool and wet north, while warm and very dry south. Dry conditions
Arizona Climate Summary May 2012
 Arizona Climate Summary May 2012 Summary of conditions for April 2012 April 2012 Temperature and Precipitation Summary April 1 st 16 th : Although April began with another low pressure system sweeping
NATIONAL WEATHER SERVICE
 NWS Form E-5 (PRES. BY NWS Instruction 10-924) MONTHLY REPORT OF HYDROLOGIC CONDITIONS HYDROLOGIC SERVICE AREA (HSA) NORTHERN INDIANA (IWX) MONTH YEAR TO: Hydrologic Information Center, W/OS31 NOAA s National
Crop / Weather Update
 Crop / Weather Update Corn Crop Condition Percent of Acreage Rated Good or Excellent 85 80 75 70 65 60 55 50 45 The U.S. corn crop was rated 69% good-to-excellent on September 23, up 1% from week-ago,