March 2012 Climate Summary
|
|
|
- Horatio Pitts
- 5 years ago
- Views:
Transcription

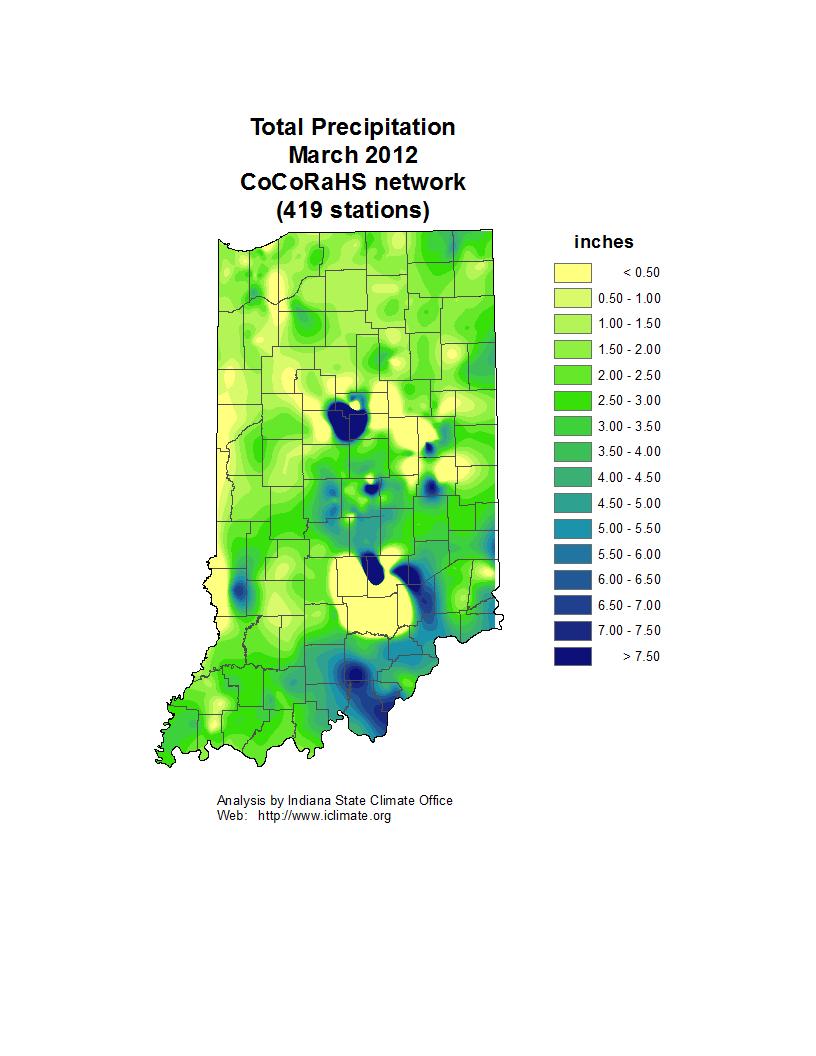
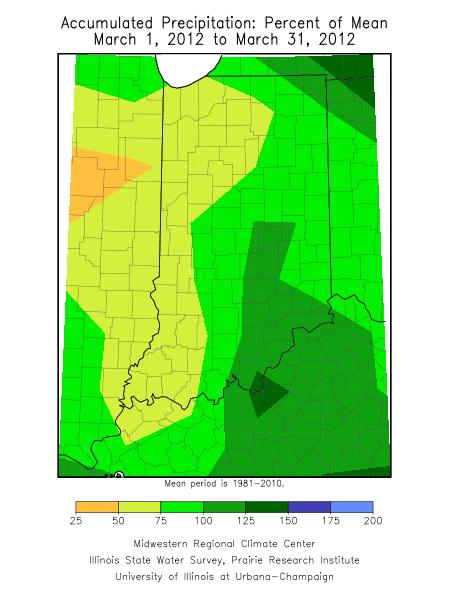
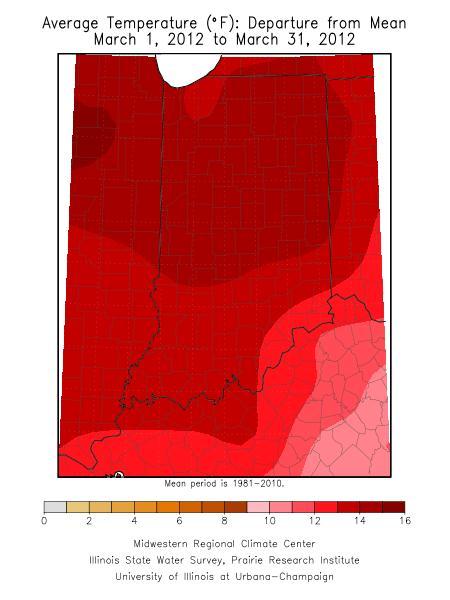
1 Ken Scheeringa and Kayla Hudson Apr 4, 2012 (765) March 2012 Climate Summary Month Summary March was a month of weather extremes with records shattered almost as a daily routine. Perhaps the collection of extremes can be summarized into a few major highlights: a record smashing 11 day long March heat wave; one of the earliest onsets of spring in Indiana history; and four confirmed tornadoes in the state on March 2 nd which resulted in 13 deaths. Another tornado occurred on March 23 rd, raising the total to 5 confirmed tornadoes this month. There were 5 Indiana tornadoes in January and 1 in February this year. This month will enter the record books as Indiana s warmest March since 1895 when state records began. The state average March temperature was 54.4 F, an amazing 13.7 F above the month normal! This new record easily surpasses the 52.1 F reading for March 1946 which now slips into 2 nd place. Just a year earlier March 1945 had posted a 51.4 F state temperature which falls to 3 rd place in the rankings. March 2012 is now the fifth consecutive month with an above normal monthly average temperature for our state. Weather historians generally regard 1910 as the year with the earliest onset of spring on record in Indiana with its March state temperature of 50.0 F, now good for a 4 th place ranking. Given the unusual warmth of March 2012 the designation of the earliest start to spring on record in Indiana may need to be revised. It is no surprise that the day split for March 2012 is heavily one-sided. There were 3 days of below normal temperatures, no days at normal, and 28 days with above normal temperature. On 19 days the daily mean temperature was at least 10 F above normal. A remarkable statistic is that daily mean temperatures were at least 20 F above normal on 11 consecutive days! No days were at least 10 F below normal. The highest local daily temperature at a cooperative station was 88 F recorded on March 22 nd at West Lafayette. Many Indiana towns exceeded 80 F on 5 consecutive days. Some other new local records are detailed in the March 18 th - 24 th narrative which follows below. The coolest daily minimum temperature was 14 F at Wanatah on March 5 th. March 2012 finishes with a state precipitation total of 2.72 inches, about 80% of normal, and the 38 th driest March on record since This extends the below normal precipitation trend in Indiana which began in February. Regionally northern Indiana received about 70% of its normal March precipitation, central Indiana measured about 90% of normal, and 85% of normal fell across southern Indiana. Some recent March months that were drier than 2012 include 2005 in 24 th place with 2.21 inches, the year 2000 with 2.06 inches at 20 th place, and the 0.98 inch amount in 2001 which claims 3 rd place. The driest March on record in Indiana occurred in 1910 with 0.23 inch. The largest single day precipitation amount was 4.40 inches which fell at the cooperative station in Stendal on March 5 th. The highest single day CoCoRaHS network amount was 2.91 inches as
2 recorded on March 24 th at North Vernon. Generally precipitation fell on about 14 days around Indiana this month. With all the very warm weather in March did it snow at all? Yes because there were a few cold days early in the month. But the March surprise is where the heaviest snow fell not in the usual lake effect region but in southern Indiana. The highest monthly snowfall total was 6.8 inches measured at Shoals. Due to the lack of cold weather it generally snowed on only two days this month but targeted those counties starting recovery efforts after the March 2 nd tornadoes. The pattern of March total snowfall throughout Indiana is shown on the map later in this report. A national outbreak of tornadoes on March 2 nd included 4 tornadoes in far southern Indiana, an EF- 4, EF-3, EF-2, and EF-1, eventually claiming 13 Indiana lives. The town of Henryville was hit by both the EF-4 and EF-1 tornadoes, just minutes apart. An extended discussion of the March 2 nd tornadoes is found in the March 1 st -10 th narrative which follows immediately below. On March 23 rd an EF-0 tornado skipped across Switzerland county but without any damage, injuries, or deaths reported. So far this year 11 tornadoes have occurred in Indiana, about half the normal annual tally. In addition to tornadoes there were several days with large hail and wind damage in our state. On March 14 th four girls were struck by lightning in Jackson county. One girl was taken to the hospital in critical condition while the others suffered minor injuries. March 1 st 10 th Leap Day marked the end of February but perhaps also an abrupt start to an active spring weather season. Indiana temperatures fluctuated widely and rapidly these first 10 days of March with the passage of two warm fronts, three cold fronts, and an occluded front. It was the warm front on March 2 nd paired with an occluded front the next day though that garnered all the attention. This potent weather system produced 4 tornadoes in Indiana which ultimately caused 13 deaths in our state. At the start of March a storm system in Missouri transported warm air from southern states to Indiana, boosting temperatures quickly to 11 F above normal. This vigorous storm was supported by a fast jet stream above Indiana and much colder air to our west, triggering 4 deadly tornadoes in far southern Indiana. After the tornadoes of March 2 nd an occluded front passed through the state the next day and temperatures fell back to normal. A cold front rushed through Indiana on March 5 th, forcing temperatures still colder to 7 F below normal. This cold surge is enough to produce up to 5 inches of snowfall in the areas of Indiana hardest hit in the tornado outbreak a few days before. An equally impressive warm up begins immediately. Temperatures rebounded to 8 F above normal by the next day, then continued rising to peak at 13 F above normal by March 8 th. Now two cold fronts sweep through the state, the first on March 8 th and the second right behind it on March 9 th, dropping temperatures to 1 F above normal. The 10 day period ends with a modest warming to 3 F above normal. When all these wild temperature swings are figured in, the overall state average temperature for the 10 day period runs about 4 F above normal. Normal daily maximum temperatures in Indiana at the start of March should range from about 43 F in far northern Indiana to 54 F in the extreme southwest. Daily minimums typically vary between 26 F and 34 F north to south across the state.
3 About a half inch of precipitation fell during each of the cold fronts with little to none recorded on the remaining days. Over the entire 10 days about 0.6 inch of precipitation was received across northern Indiana, about 1.2 inch in central, and 1.5 inch in southern areas. These amounts are about 70% of normal in the north, 120% of normal across central sections, and 130% of normal in southern Indiana. The heaviest single day precipitation was recorded in southwestern Indiana on March 3 rd after the severe weather departed. The CoCoRaHS volunteer in Jasper recorded 1.76 inch that day while the New Salem observer measured 1.63 inch. The Fairland rain gage captured 1.42 inch and the CoCoRaHS volunteer in Huntingburg measured 1.33 inch. Southwest Indiana also noted the heaviest precipitation totals in Indiana over the 10 days including: Huntingburg 3.59 inches, Jasper 3.41 inches, New Salem 2.98 inches, Holland 2.87 inches, and Paoli 2.82 inches. A map showing the total precipitation amounts around Indiana over the 10 days is posted online and at the end of this weekly narrative. The snow season isn t quite over yet. With the cold front of March 5 th some of the heavier single day snowfall amounts included two reports of 6.7 and 6.8 inches at Shoals, 5.5 inches in Galena, 5.4 inches in Floyds Knobs, and 5.0 inches in Sellersburg. These amounts were also the snowfall totals for the complete 10 days at Shoals, Galena, and Floyds Knobs. Some other 10 day totals included 4.2 inches at New Salem and 4.0 inches in Plainville. An Indiana snowfall map showing the distribution of snowfall totals for the 10 days appears at the end of this weekly narrative and is posted online at the website. Just days into the new month severe weather brought tragedy to Indiana and 11 other states. Nationally at least 65 tornadoes killed 41 people including 13 residents of our state. Four tornadoes ripped across southern Indiana just north of the Ohio River, causing extensive damage over many miles and in one case wiping away an entire town. Tornado summary for 2 March 2012 in Indiana Path in counties Tornado statistics Posey EF2 path 6 miles long 0 dead Washington, Clark, Scott, Jefferson EF4 path 49 miles long (into KY) 11 dead Clark EF1 path 6.5 miles (3 segments) 0 dead Ripley EF3 path 9 miles 2 dead In Posey county an EF-2 tornado passed just south of the town of Wadesville. It destroyed a house and caused moderate damage to other homes, mostly to roofs and windows. Over 100 trees were snapped in the tornado s path. Grain bins were destroyed, oil tanks were blown over, sheds were damaged, garages were destroyed, and vehicles were overturned. There were no deaths or injuries caused by this tornado. The EF-4 tornado began near Fredericksburg in Washington county, destroying trees, power poles and high tension wires. The winds were so fierce large sections of asphalt were scoured off a highway. In New Pekin a large factory building was crushed in 200 mph winds. Vehicles and trailers were flipped, buildings were ruined, and more trees were ripped apart. A set of parents and their two children were killed waiting out the storm in a mobile home. Their other child, a toddler, was found alive later by rescuers in a field and brought to a children s hospital. Two days later the
4 child died, raising the total to 5 deaths in Washington county. As the tornado continued east it picked up and tossed vehicles more than 100 yards. In Henryville, a small town of about 2000 residents in Clark county, one person was killed and there was heavy property damage. Many houses were blown apart, vehicles were overturned, trees were ripped open, and cows went missing. The elementary school was destroyed and only the frame skeleton of the high school was left standing, yet students hiding inside the school had only minor injuries. Nearby a school bus was picked up by the storm, separated body from frame, and thrown through the window of a town restaurant. Six cars were found wrapped around steel beams. Tornado debris from this town was later found 68 miles away. The tornado moved on to Marysville, home to about 1900 people, where its mayor later described the town as completely gone. Several homes there ended up as a pile of splintered wood. Many farm buildings were destroyed and a church was pushed off its foundation. A semi-trailer was picked up and thrown into the trees with its axle suspended in the branches. The tornado continued on to Chelsea in Jefferson county, where a young boy and his greatgrandparents were killed and found about 50 feet beyond where their home once stood. Another person died in another Chelsea home. Scores of other homes suffered heavy damage in Jefferson county. Mobile homes were destroyed, power poles and trees snapped and shredded, buildings moved off their foundations, vehicles thrown, garages destroyed, roofs peeled off, and a pool went missing. Forests were damaged in Lee Bottom adjacent to the Ohio River. A second EF-1 tornado followed minutes behind the EF-4 tornado, skipping and touching down briefly three times in Clark county. On its second touchdown Henryville was smacked again but there likely was little left to destroy after the earlier tornado. Hail the size of softballs also fell during this event. There were no deaths associated with this smaller tornado. In Ripley county the EF-3 tornado there demolished a gas station, flipped cars, and destroyed two homes near Holton. Two people were killed in a mobile home and 6 other people were injured. Like other tornado ravaged areas this day many more homes and businesses were ruined and numerous trees were uprooted. Besides the tornadoes, hail and straight line winds contributed to the massive destruction on March 2 nd. There were two broad swaths of hail damage in the state, one across central Indiana and another in the south along the Ohio River. The band of hail in central Indiana covered several counties and was generally south of a line from Lafayette to Muncie and north of a Sullivan to Liberty line. Hail sizes ranged from just a quarter inch up to 1.75 inch in diameter. Hail larger than an inch in diameter is considered dangerous and was found in Vigo, Clay, Parke, Putnam, Hendricks, Morgan, Marion, Hamilton, Henry, and Wayne counties. Smaller size hail was most common immediately to the north of these counties. The southern band of hail included nearly all areas generally south of a Princeton to Lawrenceburg line. Nearly all hail in this region exceeded an inch in diameter and ranged to as high as 2.75 inches in Washington county. Many towns in the hail band recorded hail stones larger than 2.00 inches. Broken windows and vehicle windshields were a common occurrence in this region.
5 Straight line wind damage was noted in areas just to the north of the EF-4 and EF-3 tornadoes, especially in Lawrence, Jennings, Ripley, and Decatur counties. A semi-trailer was blown over on I-74 near Greensburg and a roof was blown off in Ripley county. Trees of course were a common casualty of these gusts in excess of 70 mph. In far southwest Indiana straight line winds toppled trees on to highways. In Spencer county trees fell on power lines while areas from there west to Poseyville also reported lots of wind damage. As if this trauma were not enough a snowstorm dumped about 3 inches of snow on Clark county less than two days later. The blanket of wet snow hindered rescuers as the recovery and salvage efforts got underway. After reviewing the destruction Governor Daniels declared 11 counties a disaster area: Clark, Gibson, Harrison, Jefferson, Posey, Ripley, Scott, Shelby, Vanderburgh, Warrick, and Washington. About 250 National Guard troops were deployed to the tornado impacted areas as part of the rescue efforts. A petition for a federal disaster declaration is being prepared to seek additional help from FEMA. March 11 th 17 th Hail and wind storms persisted into another week but it was the unusual warmth that got everyone talking. Temperatures started the week at 10 F above normal but then kept climbing every day after. By March 13 th, two days later, the daily state average temperature had risen to nearly 22 F above normal, a level climatologists would label unseasonably warm. By the end of the week the temperature had peaked at 25 F above normal! Overall the entire week would average to about 20 F above normal. Daily high temperatures reached into the low and mid-80s statewide this week, including an 84 F reading at Warsaw noted on March 16 th, still a winter day according to the calendar! Normally in mid-march daily maximum temperatures should range between 46 F and 56 F north to south across Indiana. Typical daily minimums would vary from 28 F in far northern counties to 35 F in the southwest corner of the state. A strong warm front moving through Indiana on March 12 th brought a surge of much warmer air into the state but little rainfall. Generally less than a tenth inch of was recorded statewide. A cold front immediately followed the next day but was so weak the warming trend slowed but did not stop. Another warm front passed through Indiana on March 14th, the third front in as many days.
6 The heating and instability of this warm air mass triggered some thunderstorms over the next few days and a few tenths inch of additional rainfall. For the week rainfall totaled about 0.3 inch in northern Indiana, 0.2 inch in central areas, and 0.7 inch across the south. These amounts are about half of normal in the north, a quarter of normal in central Indiana, and three-fourths of normal in southern counties. Scattered thunderstorms produced heavy rainfall as seen in CoCoRaHS reports on the morning of March 16 th. The Fredericksburg observer measured 2.90 inch in the rain gage, while at New Salisbury 2.75 inches fell. The Elizabeth volunteer noted 2.51 inches. In far northern Indiana, two North Judson reporters had 2.40 inches. The heaviest weekly rainfall totals included 3.00 inches in Fredericksburg, 2.71 inches in Elizabeth, 2.56 inches at North Judson, and 1.65 inches in Milltown. A map showing the distribution of total rainfall across Indiana is found below. The second warm front signaled the Bermuda ridge had arrived. This ridge is a strong high pressure system sprawling inland west and north from the Atlantic coast of Florida, dominating the southeast states, and reinforcing the warm air mass now over Indiana. The Bermuda ridge has taken control, halting a cold front headed our way and forcing it back north to close out the week. This marks the start of one of the earliest springs on record in Indiana. The sudden onset of spring-like weather brought with it spring-like severe weather as well. In southwest Indiana one inch diameter hail fell in Dubois, Floyd, and Clark counties on March 14 th. Thunderstorms continued the next day over the same area, producing 1.0 to 1.5 inch hail in Gibson, Pike, Dubois, Orange, Floyd, Clark, and Decatur counties. High winds occurred in Pike county. Henryville, the Clark county town devastated by two tornadoes on March 2 nd, was one of the towns hit by this hail event. In Seymour four high school girls playing softball were struck by lightning, one of whom was transported to the hospital in critical condition. The others had minor injuries. Hail was also observed in Fayette county of eastern Indiana. In northwest Indiana 1.0 to 1.75 inch hail was reported in Starke, Pulaski, and Fulton counties. Severe weather took a very short break before reappearing on March 17 th. A hail storm in Posey county dropped 1.0 inch diameter hail before moving on to Vanderburgh county where hail 0.5 to 0.75 inch diameter was observed. Another isolated thunderstorm in Bartholomew county also yielded 1.0 inch hail while high wind gusts were reported in Marion county. With the unseasonably warm temperatures there was no snowfall reported this week.
7 March 18 th 24 th Warm spells in March are not that unusual but the length and intensity of the current warm episode is extreme and even record shattering! For 11 consecutive days, between March 12 th and 22 nd, the daily state average temperature reached 20 F or more above normal. The record warmth triggered another round of thunderstorms with hail this week as well as an EF-0 tornado, the 5 th Indiana tornado this month. A very strong high pressure ridge continued to dominate the weather in the eastern half of the country. Cold fronts attempted but failed to pass through our state, unable to counter the massive blocking ridge. A pair of cold fronts approached Indiana from the west on March 20 th but stalled when they reached the Mississippi River. On March 22 nd a triplet of cold fronts from Canada were lined up waiting for the ridge to vacate Indiana. Unable to advance very far southward these fronts morphed into a stationary front north of Indiana and the cold air behind moved east to New England instead. Finally a deep closed low pressure center in the upper atmosphere over Texas moved to Indiana on March 23 rd, eroding away the ridge block. A surface occluded front finally passed through our state, allowing cooler air to enter from the north. The 11 day extreme warm spell ends. The week had opened with Indiana average temperatures 26 F above normal, peaking at 30 F above normal three days later. Not until the occluded front crossed the state did temperatures drop several degrees, ending the week at 16 F above normal. Overall for the week state temperatures averaged 26 F above normal. Typically at this point in March daily maximum temperatures should range from 49 F in far northern Indiana to 59 F in the far southwest. Daily minimums normally vary between 30 F and 37 F north to south across the state. With the extreme warmth many daily temperature records throughout Indiana and the Midwest fell by the wayside. South Bend and Fort Wayne set new daily records on 9 consecutive days. Indianapolis posted 7 new daily record maximum temperatures while Evansville notched 6 days with new daily records. Fort Wayne observed their warmest March temperature on record at 87 F on March 21 st. Several Indiana towns saw their thermometer soar past 80 F on 5 consecutive days. The sudden onset of spring has certainly given outside plants a tremendous head start in their development. Apples, peaches, grapes and strawberries are some of the fruit crops that are now
8 well advanced due to recent temperatures in the 70s and 80s. Some farmers have already planted corn. Growers should be aware that the last normal freeze date is still some weeks away in Indiana and that damage may be possible in the event of an April freeze. Rainfall remained very light early in the week but turned heavy when the cooler air behind the occluded front arrived. For the week rainfall totaled about 0.9 in northern Indiana, 1.3 inch in central sections, and right about an inch across southern Indiana. These totals are about one and a half times normal in the north, twice normal in central Indiana, and near normal in the southern third of the state. But as expected in warmer weather thunderstorms can produce much heavier local showers. Local spots with the heaviest single day rainfall were mostly in eastern Indiana and measured the morning of March 24 th. Some reports from CoCoRaHS volunteers that day included 2.91 inches in North Vernon, 2.56 inches in Muncie, and 2.40 inches in Fairland. The Lagrange rain gage had 2.38 inches and in Orland 2.31 inches fell. Some heavier rainfall totals for the week included 3.21 inches at Lagrange, 3.20 inches in North Vernon, and 3.13 inches at Plainfield. The Avon observer recorded 3.11 inches while Brownsburg noted 3.06 inches for the week. The very warm air exited Indiana kicking and screaming, that is, severe weather broke out once again, this time on March 23 rd. A small EF-0 tornado touched down briefly once or twice in Switzerland county near the town of Center Square. There were no injuries, deaths, or damage reported with this tornado. Elsewhere across the state there were several reports of hail. One inch diameter hail was reported in Knox, Daviess, and Sullivan counties. Hail was somewhat larger to the northeast. Hail up to 1.5 inch in diameter was observed in south central Indiana, including in Monroe, Brown, Washington, and Shelby counties. There were two reports of scattered hail to the north. In Delaware county hail measured 1.25 to 1.75 inch while 1.0 inch hail was noted in Newton county. March 25 th 31 st The extreme March heat ended last week but the trend of much above normal temperatures certainly has not. The week opened with daily state average temperatures 17 F above normal. A cold front passed through Indiana on March 25 th, lowering temperatures somewhat but to a level still 8 F above normal for this time of year. Temperatures didn t change much over the next 3 days as a high pressure system moved across then east of Indiana. On March 28 th a quick warm and cold
9 front pair tied to a storm system moved through our state, lifting temperatures briefly before cooling arrived behind the storm. Temperatures fell to their lowest point of the week to 4 F above normal. The next day a new warm front approached Indiana from the southwest, nudging temperatures upward once again to about 10 F above normal. The warm front itself failed to reach Indiana before a cool air reinforcement arrived the last day of March courtesy of a Canadian high pressure system, ending the month at about 4 F above normal. Considering all its rises and falls, the state temperature this week overall averaged about 9 F above normal. Typically in this final March week daily maximum temperatures should range between 52 F to 61 F north to south across Indiana. Normal daily minimums vary from 32 F in our far northern counties to 39 F in the far southwest. Rainfall amounts were rather skimpy this week. What did fall came in the final storm of the month when its failed warm front clashed with cool air from Canada. For the week rainfall averaged about a tenth inch across the northern third of the state and about a quarter inch elsewhere in Indiana. These totals represent less than 15% of normal in the northern third of the state and near 30% of normal in central and southern sections. Heavier isolated showers are common in Indiana during the warm season and this week was no exception. The largest single day rainfall was recorded by CoCoRaHS observers on the morning of March 31 st, mostly in central Indiana. Some of these heavier totals included 1.24 inch, 0.97 inch, and 0.85 inch at three Columbus locations, 1.21 inch in Plainfield, and 1.17 inch at Greensburg. For the week heavier totals included 1.26 inch and 0.97 inch in Columbus, and 0.87 inch in Plainfield and Lewisville. A weekly rainfall map for Indiana appears after this summary. Would Indiana escape a week with no March severe weather? Not! Thunderstorms produced yet another round of hail and high winds, this time on March 30 th. An intermittent band of hail stretched across central Indiana. Hail between 1.0 inch and 1.75 inch in diameter fell in Parke, Hendricks, Hancock, and Delaware counties with the largest stones in Hendricks county. A core of 65 mph winds were reported in Johnson and Hancock counties where power lines were brought down. In southern Indiana localized 1.0 inch diameter hail was noted in Knox and Scott counties.
10 March 2012 Temperature Region Temperature Normal Deviation Northwest North Central Northeast West Central Central East Central Southwest South Central Southeast State Precipitation Region Precipitation Normal Deviation Percent of Normal Northwest North Central Northeast West Central Central East Central Southwest South Central Southeast State
11 Spring so far (same as March) Temperature Region Temperature Normal Deviation Northwest North Central Northeast West Central Central East Central Southwest South Central Southeast State Precipitation Region Precipitation Normal Deviation Percent of Normal Northwest North Central Northeast West Central Central East Central Southwest South Central Southeast State
12 2012 Annual (through March) Temperature Region Temperature Normal Deviation Northwest North Central Northeast West Central Central East Central Southwest South Central Southeast State Precipitation Region Precipitation Normal Deviation Percent of Normal Northwest North Central Northeast West Central Central East Central Southwest South Central Southeast State
13
14
15
16

17 Drought Summary from the U.S. Drought Monitor Below is a drought summary for the state of Indiana from the U.S. drought monitor. Areas in white are not experiencing any drought. Yellow areas are abnormally dry, but not entirely considered a drought. Drought begins when the moisture levels become more severe, with beige, orange, red, and brown indicating increasing levels of drought (moderate, severe, extreme, and exceptional, respectively). The table below indicates how much of the state is not under drought conditions, and also how much of the state is under drought conditions from its respective column upwards. For example, March 6 th has 0.0% of Indiana under at least D1-D4 drought status, 0.0% under at least D0 through D4 drought status, and 100.0% drought free. Subtracting the D1-D4 category (0.0%) from the D0-D4 category (0.0%), tells us that 0.0% of Indiana is in D0 category alone (abnormally dry). Please note, however, that these areas are not exact, and much of this drought map has been created from reports throughout the state and in estimation, so use this information as a general view rather than for specifics.
18 March 6 th Drought Summary
19 March 13 th Drought Summary
20 March 20 th Drought Summary
21 March 27 th Drought Summary
August 2006 Summary. August 1-5
 Ashley Brooks (765) 494-6574 Sep 8, 2006 http://www.iclimate.org August 1-5 August 2006 Summary The heat wave that started during the end of July continued into the beginning parts of August with temperatures
July 2007 Climate Summary
 Dan Bowman (765) 494-6574 Sep 3, 2007 http://www.iclimate.org Summary July 2007 Climate Summary The month of July ended as a very unusual month. Many events occurred during the month of July that is not
January 2008 Climate Summary
 Joseph Mays (765) 494-6574 Feb 5, 2008 http://www.iclimate.org Summary January 2008 Climate Summary January was a mix bag of conditions, with an oscillatory pattern developing. We experienced phases of
December 2011 Climate Summary
 Ken Scheeringa and Kayla Hudson Jan 17, 2012 (765) 494-8105 http://www.iclimate.org December 2011 Climate Summary Month Summary What a difference a year makes! A year ago the misery of a harsh, cold, and
August 2013 Climate Summary
 Ken Scheeringa and Matt Price Sep 6, 2013 (765) 494-8105 http://www.iclimate.org August 2013 Climate Summary Month Summary August weather began cool and wet but became progressively warmer and drier through
October 2011 Climate Summary
 Ken Scheeringa and Kayla Hudson Nov 4, 2011 http://www.iclimate.org October 2011 Climate Summary Month Summary October weather evolved as a two part story. Weather conditions the first half of the month
January 2012 Climate Summary
 Ken Scheeringa and Kayla Hudson Feb 6, 2012 (765) 494-8105 http://www.iclimate.org January 2012 Climate Summary Month Summary Where is winter? This question found its way into many conversations throughout
September 2011 Climate Summary
 Ken Scheeringa and Kayla Hudson Oct 5, 2011 (765) 494-8105 http://www.iclimate.org September 2011 Climate Summary Month Summary The final blast of summer heat arrived at the start of September. It lasted
May 2005 Climate Summary
 Ashley Brooks (765) 494-6574 Jun 7, 2005 http://iclimate.org May 2005 Climate Summary May 1-5 Early May was characterized by an upper-level trough that was in place over Indiana that brought in very cool
September 2005 Climate Summary
 Ashley Brooks (765) 494-6574 Oct 5, 2005 http://iclimate.org September 2005 Climate Summary September 1-7 A cold front came through on the 1 st of the month, however little moisture was associated with
SIGNIFICANT EVENTS Severe Storms November 1994 January 1996 August 1998 and May 2000 March 2002 May 2002 Champaign County
 SIGNIFICANT EVENTS Severe Storms November 1994 On Nov. 1, 1994, high winds gusted over 60 mph at times across the northwest third of Ohio. The highest measured wind gust was 63 mph at Columbus Grove (Putnam).
November 2012 Climate Summary
 Ken Scheeringa and Kayla Hudson Dec 6, 2012 (765) 494-8105 http://www.iclimate.org November 2012 Climate Summary Month Summary November was one of those rare weather months in Indiana when not much happened:
September 2012 Climate Summary
 Ken Scheeringa and Kayla Hudson Oct 5, 2012 (765) 494-8105 http://www.iclimate.org September 2012 Climate Summary Month Summary Summer slipped away and it felt a lot more like autumn in Indiana this month
2011 Year in Review TORNADOES
 2011 Year in Review The year 2011 had weather events that will be remembered for a long time. Two significant tornado outbreaks in April, widespread damage and power outages from Hurricane Irene in August
November 2010 Climate Summary
 Ken Scheeringa (765) 494-8105 Dec 6, 2010 http://www.iclimate.org November 2010 Climate Summary Summary A four month drought in Indiana is collapsing as significant rain fell the final week of November.
January 2006 Climate Summary
 Ashley Brooks (765) 494-6574 Feb 9, 2006 http://www.iclimate.org January 1-3 January 2006 Climate Summary Unseasonably warm conditions welcomed in the New Year with highs in the 40s across the northern
Champaign-Urbana 2001 Annual Weather Summary
 Champaign-Urbana 2001 Annual Weather Summary ILLINOIS STATE WATER SURVEY 2204 Griffith Dr. Champaign, IL 61820 wxobsrvr@sws.uiuc.edu Maria Peters, Weather Observer January: After a cold and snowy December,
March 2014 Climate Summary
 Ken Scheeringa And Matt Price Apr 8, 2014 (765) 494-8105 http://www.iclimate.org March 2014 Climate Summary Month Summary Winter had officially ended by the calendar but snow and cold persisted in Indiana
June 2011 Climate Summary
 Ken Scheeringa (765) 494-8105 Jul 8, 2011 http://www.iclimate.org June 2011 Climate Summary Month Summary The abundance of extreme weather this year extended yet another month into June. This month has
April 2011 Climate Summary
 Ken Scheeringa (765) 494-8105 May 9, 2011 http://www.iclimate.org April 2011 Climate Summary Summary After somewhat of a respite in March Indiana weather ramped up with a vengeance in April. Extreme weather
October 2014 Climate Summary
 Ken Scheeringa And Matt Price Nov 10, 2014 (765) 494-8105 http://www.iclimate.org October 2014 Climate Summary Month Summary October featured a mix of weather. A very wet first half of the month evolved
The hydrologic service area (HSA) for this office covers Central Kentucky and South Central Indiana.
 for this office covers Central Kentucky and South Central Indiana.") January 2012 February 13, 2012 An X inside this box indicates that no flooding occurred within this hydrologic service area. January 2012 continued the string of wet months this winter. Rainfall was generally
January 2012 February 13, 2012 An X inside this box indicates that no flooding occurred within this hydrologic service area. January 2012 continued the string of wet months this winter. Rainfall was generally
May 2018 Climate Summary
 Ken Scheeringa and Andy Eggert Jun 7, 2018 (765) 494-8105 http://www.iclimate.org May 2018 Climate Summary Month Summary As the calendar turned from April to May temperatures flipped dramatically away
Champaign-Urbana 1998 Annual Weather Summary
 Champaign-Urbana 1998 Annual Weather Summary ILLINOIS STATE WATER SURVEY Audrey Bryan, Weather Observer 2204 Griffith Dr. Champaign, IL 61820 wxobsrvr@sparc.sws.uiuc.edu The development of the El Nìno
April 2016 Climate Summary
 Ken Scheeringa And Andy Eggert May 9, 2016 (765) 494-8105 http://www.iclimate.org April 2016 Climate Summary Month Summary One month but two seasons. The first half of April was cold with snow. Wind damage
May 2015 Climate Summary
 Ken Scheeringa And Mary Rose Mangan Jun 8, 2015 (765) 494-8105 http://www.iclimate.org May 2015 Climate Summary Month Summary May was a very warm month. Rainfall averaged near normal but was distributed
May 2016 Climate Summary
 Ken Scheeringa And Andy Eggert Jun 6, 2016 (765) 494-8105 http://www.iclimate.org May 2016 Climate Summary Month Summary Cold weather dominated in May until the last week of the month. May began wet but
January 2013 Climate Summary
 Ken Scheeringa and Kayla Hudson Feb 7, 2013 (765) 494-8105 http://www.iclimate.org January 2013 Climate Summary Month Summary Winter or spring? January featured several dramatic swings in temperature and
February 2017 Climate Summary
 Ken Scheeringa And Andy Eggert Mar 9, 2017 (765) 494-8105 http://www.iclimate.org February 2017 Climate Summary Month Summary February 2017 was the warmest February in Indiana since state climate records
March 2009 Climate Summary
 Joseph Mays (765) 494-6574 Apr 1, 2009 http://www.iclimate.org Summary March 2009 Climate Summary March is in the books and it continued the trend of extreme weather we have experienced during the first
Champaign-Urbana 1999 Annual Weather Summary
 Champaign-Urbana 1999 Annual Weather Summary ILLINOIS STATE WATER SURVEY 2204 Griffith Dr. Champaign, IL 61820 wxobsrvr@sws.uiuc.edu Maria Peters, Weather Observer A major snowstorm kicked off the new
August 2015 Climate Summary
 Ken Scheeringa And Mary Rose Mangan Sep 4, 2015 (765) 494-8105 http://www.iclimate.org August 2015 Climate Summary Month Summary A very active wet summer weather pattern turned much calmer and drier in
March 2016 Climate Summary
 Ken Scheeringa And Andy Eggert Apr 8, 2016 (765) 494-8105 http://www.iclimate.org March 2016 Climate Summary Month Summary Count March as the 7 th month in a row that the state average temperature has
2018 Year in Review for Central and Southeast Illinois By: Chris Geelhart, Meteorologist National Weather Service, Lincoln IL
 By: Chris Geelhart, Meteorologist National Weather Service, Lincoln IL While 2018 featured some significant out-of-season weather, including below zero temperatures in April and 90-degree highs in early
The Pennsylvania Observer
 The Pennsylvania Observer April 2, 2009 March 2009 Pennsylvania Weather Recap Prepared by Curt Harpster For the month of March the saying, In like a lion and out like a lamb really fit the pattern quite
April 2017 Climate Summary
 Ken Scheeringa And Andy Eggert May 8, 2017 (765) 494-8105 http://www.iclimate.org April 2017 Climate Summary Month Summary April was a very warm and wet month in Indiana, nearly setting a new monthly temperature
Monthly Long Range Weather Commentary Issued: APRIL 18, 2017 Steven A. Root, CCM, Chief Analytics Officer, Sr. VP,
 Monthly Long Range Weather Commentary Issued: APRIL 18, 2017 Steven A. Root, CCM, Chief Analytics Officer, Sr. VP, sroot@weatherbank.com MARCH 2017 Climate Highlights The Month in Review The average contiguous
June 2010 Climate Summary
 Ken Scheeringa (765) 494-8105 Jul 6, 2010 http://www.iclimate.org June 2010 Climate Summary Summary Summer like heat and humidity arrived in Indiana on May 22 nd and dominated our weather scene nearly
August 2017 Climate Summary
 Ken Scheeringa And Andy Eggert Sep 7, 2017 (765) 494-8105 http://www.iclimate.org August 2017 Climate Summary Month Summary The coolest August in 13 years featured long cool and warm spells, below normal
November 2015 Climate Summary
 Ken Scheeringa And Mary Rose Mangan Dec 8, 2015 (765) 494-8105 http://www.iclimate.org November 2015 Climate Summary Month Summary November was much warmer than normal while precipitation was very near
IC ARTICLE 19. DESCRIBING REAL PROPERTY; INDIANA COORDINATE SYSTEM. IC Chapter 1. Designation of Indiana Coordinate System; Zones
 IC 32-19 ARTICLE 19. DESCRIBING REAL PROPERTY; INDIANA COORDINATE SYSTEM IC 32-19-1 Chapter 1. Designation of Indiana Coordinate System; Zones IC 32-19-1-1 Designation of systems Sec. 1. The systems of
September 2016 Climate Summary
 Ken Scheeringa And Andy Eggert Oct 6, 2016 (765) 494-8105 http://www.iclimate.org September 2016 Climate Summary Month Summary The warmest September in 77 years brought alternating weeks of dry and wet
January 2017 Climate Summary
 Ken Scheeringa And Andy Eggert Feb 8, 2017 (765) 494-8105 http://www.iclimate.org January 2017 Climate Summary Month Summary The warmest January in 11 years was nearly 4 F warmer than December 2016. An
April 2015 Climate Summary
 Ken Scheeringa And Mary Rose Mangan May 8, 2015 http://www iclimate org April 2015 Climate Summary Month Summary April was a month of extremes. Severe weather erupted on 4 days of the first week with multiple
October 2016 Climate Summary
 Ken Scheeringa And Andy Eggert Nov 9, 2016 (765) 494-8105 http://www.iclimate.org October 2016 Climate Summary Month Summary October was the 9 th month so far this year to average above normal in temperature.
June 2016 Climate Summary
 Ken Scheeringa And Andy Eggert Jul 8, 2016 (765) 494-8105 http://www.iclimate.org June 2016 Climate Summary Month Summary June was a warm month with below normal temperature on just 6 days. Rainfall was
April 2013 Climate Summary
 Ken Scheeringa and Kayla Hudson May 6, 2013 (765) 494-8105 http://www.iclimate.org April 2013 Climate Summary Month Summary Temperatures bounced high and low this month, keeping Hoosiers guessing which
October 2012 Climate Summary
 Ken Scheeringa and Kayla Hudson Nov 8, 2012 (765) 494-8105 http://www.iclimate.org October 2012 Climate Summary Month Summary In a reversal from the hot and dry summer, cooler and wetter than normal conditions
July 2014 Climate Summary
 Ken Scheeringa And Matt Price Aug 8, 2014 (765) 494-8105 http://www.iclimate.org July 2014 Climate Summary Month Summary July was unseasonably cool and drier than normal. Rainfall was light in parts of
The hydrologic service area (HSA) for this office covers Central Kentucky and South Central Indiana.
 for this office covers Central Kentucky and South Central Indiana.") MONTH YEAR January 2011 February 15, 2011 X An X inside this box indicates that no flooding occurred within this hydrologic service area. January 2011 was drier than normal in all locations in the area.
MONTH YEAR January 2011 February 15, 2011 X An X inside this box indicates that no flooding occurred within this hydrologic service area. January 2011 was drier than normal in all locations in the area.
NWS FORM E-5 U.S. DEPARTMENT OF COMMERCE I HYDRO SERVICE AREA NOAA, NATIONAL WEATHER SERVICE I Indianapolis, IN MONTHLY REPORT
 NWS FORM E-5 U.S. DEPARTMENT OF COMMERCE I HYDRO SERVICE AREA NOAA, NATIONAL WEATHER SERVICE I Indianapolis, IN. 1-------------------- MONTHLY REPORT OF RIVER AND FLOOD CONDITIONSI REPORT FOR I November
July 2010 Climate Summary
 Ken Scheeringa (765) 494-8105 Aug 4, 2010 http://www.iclimate.org July 2010 Climate Summary Summary The warm summer of 2010 continues. Daily state average temperatures were above normal on all but seven
2012 Growing Season Weather Summary for North Dakota. Adnan Akyüz and Barbara A. Mullins Department of Soil Science October 30, 2012
 2012 Growing Season Weather Summary for North Dakota Adnan Akyüz and Barbara A. Mullins Department of Soil Science October 30, 2012 Introduction The 2012 growing season (the period from April through September)
The Pennsylvania Observer
 The Pennsylvania Observer May 31, 2012 May 2012 - Pennsylvania Weather Recap By: Paul Knight The majority of the fifth month had temperatures averaging well above seasonal levels with two distinct hot
Your Task: Read each slide then use the underlined red or underlined information to fill in your organizer.
 Severe Weather: Tornadoes and Hurricanes Thunderstorms and Lightning S6E4 d. Construct an explanation of the relationship between air pressure, weather fronts, and air masses and meteorological events
March 2018 Climate Summary
 Ken Scheeringa and Andy Eggert Apr 5, 2018 (765) 494-8105 http://www.iclimate.org March 2018 Climate Summary Month Summary March turned cold with below normal temperatures on two-thirds of its days. Along
The Pennsylvania Observer
 The Pennsylvania Observer August 3, 2015 July 2015 - Pennsylvania Weather Recap By: Arthur Person Although this seventh month of 2015 was fairly normal across Pennsylvania as a whole, the details reveal
MIAMI-SOUTH FLORIDA National Weather Service Forecast Office
 MIAMI-SOUTH FLORIDA National Weather Service Forecast Office http://www.weather.gov/miami June 2015 South Florida Weather Summary Dry East, Wet West...Drought Remains SE Florida July 3, 2015: Depending
January 2018 Climate Summary
 Ken Scheeringa and Andy Eggert Feb 8, 2018 (765) 494-8105 http://www.iclimate.org January 2018 Climate Summary Month Summary January temperature swings were amazing. In the first few days arctic cold pushed
March 2011 Climate Summary
 Ken Scheeringa (765) 494-8105 Apr 5, 2011 http://www.iclimate.org March 2011 Climate Summary Summary The fast paced weather action of February slowed some in March. The major March weather features were
Monthly Long Range Weather Commentary Issued: May 15, 2014 Steven A. Root, CCM, President/CEO
 Monthly Long Range Weather Commentary Issued: May 15, 2014 Steven A. Root, CCM, President/CEO sroot@weatherbank.com APRIL 2014 REVIEW Climate Highlights The Month in Review The average temperature for
Severe Weather: Tornadoes and Hurricanes
 Severe Weather: Tornadoes and Hurricanes Tornadoes Grab Toto!! TORNADOES Are a low pressure storm that usually forms over land in an average year, 800 tornadoes are reported in the U.S. a tornado is defined
The Weather Wire. Contents: Summer 2018 Outlook. Summer 2018 Outlook Drought Monitor May Summary/Statistics June Preview Rainfall Totals
 The Weather Wire June 2018 Volume 25 Number 6 Contents: Summer 2018 Outlook Drought Monitor May Summary/Statistics June Preview Rainfall Totals Summer 2018 Outlook June 1 st marked the first day of meteorological
November 2017 Climate Summary
 Ken Scheeringa and Andy Eggert Dec 8, 2017 (765) 494-8105 http://www.iclimate.org November 2017 Climate Summary Month Summary November temperatures alternated spells of warm and cool while precipitation
Monthly Long Range Weather Commentary Issued: February 15, 2015 Steven A. Root, CCM, President/CEO
 Monthly Long Range Weather Commentary Issued: February 15, 2015 Steven A. Root, CCM, President/CEO sroot@weatherbank.com JANUARY 2015 Climate Highlights The Month in Review During January, the average
Monthly Long Range Weather Commentary Issued: July 18, 2014 Steven A. Root, CCM, President/CEO
 Monthly Long Range Weather Commentary Issued: July 18, 2014 Steven A. Root, CCM, President/CEO sroot@weatherbank.com JUNE 2014 REVIEW Climate Highlights The Month in Review The average temperature for
The Pennsylvania Observer
 The Pennsylvania Observer October 1, 2015 September 2015 - Pennsylvania Weather Recap By: Quinn Lease The month of September will be remembered for its above normal temperatures and dry conditions that
Weather and Climate Summary and Forecast March 2019 Report
 Weather and Climate Summary and Forecast March 2019 Report Gregory V. Jones Linfield College March 2, 2019 Summary: Dramatic flip from a mild winter to a top five coldest February on record in many locations
The Pennsylvania Observer
 The Pennsylvania Observer September 3, 2008 Summer 2008 Weather Summary Written by: Brian Thompson The opening days of June started dry, but a warm front brought a widespread rain a couple of days into
Chapter 3: Weather Fronts & Storms
 Chapter 3: Weather Fronts & Storms An AIR MASS is a large body of air that has similar characteristics (temperature, humidity) throughout. Air masses can be massively large. Air masses are classified by
Illinois Drought Update, December 1, 2005 DROUGHT RESPONSE TASK FORCE Illinois State Water Survey, Department of Natural Resources
 Illinois Drought Update, December 1, 2005 DROUGHT RESPONSE TASK FORCE Illinois State Water Survey, Department of Natural Resources For more drought information please go to http://www.sws.uiuc.edu/. SUMMARY.
NWS FORM E-5 U.S. DEPARTMENT OF COMMERCE HSA OFFICE:
 NWS FORM E-5 U.S. DEPARTMENT OF COMMERCE HSA OFFICE: NOAA, NATIONAL WEATHER SERVICE MONTHLY REPORT OF RIVER AND FLOOD CONDITIONS DATE: TO: North Webster, IN REPORT FOR (MONTH &YEAR): July 1998 August 5,
Arizona Climate Summary May 2012
 Arizona Climate Summary May 2012 Summary of conditions for April 2012 April 2012 Temperature and Precipitation Summary April 1 st 16 th : Although April began with another low pressure system sweeping
INDIANAPOLIS, INDIANA
 The NWS FORM E-5 U.S. DEPARTMENT OF COMMERCE HYDROLOGIC SERVICE AREA: NATIONAL OCEANIC AND ATMOSPHERIC ADMINISTRATION NATIONAL WEATHER SERVICE INDIANAPOLIS, INDIANA REPORT FOR: MONTHLY REPORT OF RIVER
October 2017 Climate Summary
 Ken Scheeringa and Andy Eggert Nov 6, 2017 (765) 494-8105 http://www.iclimate.org October 2017 Climate Summary Month Summary After more than three weeks of warm temperatures October turned suddenly cold
CHAPTER 10. TORNADOES AND WINDSTORMS
 CHAPTER 10. TORNADOES AND WINDSTORMS Wyoming, lying just west of tornado alley, is fortunate to experience less frequent and intense tornadoes than its neighboring states to the east. However, tornadoes
November 2016 Climate Summary
 Ken Scheeringa And Andy Eggert Dec 15, 2016 (765) 494-8105 http://www.iclimate.org November 2016 Climate Summary Month Summary Unseasonably warm, pleasant, and sunny weather the first half of the month
NATIONAL WEATHER SERVICE
 January 2016 February 9, 2016 This was a dry month across the HSA despite one large and several smaller snowfalls. Most locations ended up 1-2 inches below normal for the month. The driest locations at
July 2011 Climate Summary
 Ken Scheeringa (765) 494-8105 Aug 8, 2011 http://www.iclimate.org July 2011 Climate Summary Month Summary The upper atmospheric high pressure dome which baked the Texas area in heat and drought the past
Table 1. August average temperatures and departures from normal ( F) for selected cities.
 for selected cities.") Climate Summary for Florida August 2016 Prepared by Lydia Stefanova and David Zierden Florida Climate Center, The Florida State University, Tallahassee, Florida Online at: http://climatecenter.fsu.edu/products-services/summaries
Climate Summary for Florida August 2016 Prepared by Lydia Stefanova and David Zierden Florida Climate Center, The Florida State University, Tallahassee, Florida Online at: http://climatecenter.fsu.edu/products-services/summaries
How strong does wind have to be to topple a garbage can?
 How strong does wind have to be to topple a garbage can? Imagine winds powerful enough to pick up a truck and toss it the length of a football field. Winds of this extreme sometimes happen in a tornado.
Tornadoes pose a high risk because the low atmospheric pressure, combined with high wind velocity, can:
 Tornadoes are powerful, circular windstorms that may be accompanied by winds in excess of 200 miles per hour. Tornadoes typically develop during severe thunderstorms and may range in width from several
New Hampshire State Climate Office Dr. Mary D. Stampone, State Climatologist
 New Hampshire State Climate Office Dr. Mary D. Stampone, State Climatologist University of New Hampshire c/o Department of Geography 73 Main Street Durham, NH 03824 Phone: 603-862-3136 Fax: 603-862-4362
Impacts of the April 2013 Mean trough over central North America
 Impacts of the April 2013 Mean trough over central North America By Richard H. Grumm National Weather Service State College, PA Abstract: The mean 500 hpa flow over North America featured a trough over
Weather and Climate Summary and Forecast October 2017 Report
 Weather and Climate Summary and Forecast October 2017 Report Gregory V. Jones Linfield College October 4, 2017 Summary: Typical variability in September temperatures with the onset of fall conditions evident
May 2016 Volume 23 Number 5
 The Weather Wire May 2016 Volume 23 Number 5 Contents: Winter Summary Current Colorado and West-wide Snow Pack Drought Monitor April Summary/Statistics May Preview Snowfall Totals Winter Summary The Front
The hydrologic service area (HSA) for this office covers Central Kentucky and South Central Indiana.
 for this office covers Central Kentucky and South Central Indiana.") NWS Form E-5 (04-2006) NATIONAL OCEANIC AND ATMOSPHERIC ADMINISTRATION (PRES. BY NWS Instruction 10-924) NATIONAL WEATHER SERVICE MONTHLY REPORT OF HYDROLOGIC CONDITIONS HYDROLOGIC SERVICE AREA (HSA) Louisville
NWS Form E-5 (04-2006) NATIONAL OCEANIC AND ATMOSPHERIC ADMINISTRATION (PRES. BY NWS Instruction 10-924) NATIONAL WEATHER SERVICE MONTHLY REPORT OF HYDROLOGIC CONDITIONS HYDROLOGIC SERVICE AREA (HSA) Louisville
Weather and Climate Summary and Forecast Summer 2017
 Weather and Climate Summary and Forecast Summer 2017 Gregory V. Jones Southern Oregon University August 4, 2017 July largely held true to forecast, although it ended with the start of one of the most extreme
COMMUNITY EMERGENCY RESPONSE TEAM TORNADOES
 Tornadoes are powerful, circular windstorms that may be accompanied by winds in excess of 200 miles per hour. Tornadoes typically develop during severe thunderstorms and may range in width from several
Colorado State University, Fort Collins, CO Weather Station Monthly Summary Report
 Colorado State University, Fort Collins, CO Weather Station Monthly Summary Report Month: December Year: 2017 Temperature: Mean T max was 47.2 F which is 4.4 above the 1981-2010 normal for the month. This
SEPTEMBER 2013 REVIEW
 Monthly Long Range Weather Commentary Issued: October 21, 2013 Steven A. Root, CCM, President/CEO sroot@weatherbank.com SEPTEMBER 2013 REVIEW Climate Highlights The Month in Review The average temperature
The Pennsylvania Observer
 The Pennsylvania Observer June 2, 2010 May 2010 Pennsylvania Weather Recap This month completed one of the warmest springs on record in Pennsylvania. With about 75% of the days averaging above normal,
November 2014 Climate Summary
 Ken Scheeringa And Matt Price Dec 10, 2014 (765) 494-8105 http://www.iclimate.org November 2014 Climate Summary Month Summary Unseasonable cold headlined the Indiana and national news in November. The
The Pennsylvania Observer
 The Pennsylvania Observer April 2, 2010 March 2010 Pennsylvania Weather Recap Prepared by: Katelyn Johnson March did come in as a lion cub this year. The 1 st proved to be a calm day; however most of Pennsylvania
The weather in Iceland 2012
 The Icelandic Meteorological Office Climate summary 2012 published 9.1.2013 The weather in Iceland 2012 Climate summary Sunset in Reykjavík 24th April 2012 at 21:42. View towards west from the balcony
Community Collaborative Rain, Hail & Snow Network
 Community Collaborative Rain, Hail & Snow Network NWS Gray and Matt Spies September 2016 Hello Observers! This is the first edition of a newsletter that we will be sending out to our current CoCoRaHS observers.
Arizona Climate Summary
 May 2015 Temperature and Precipitation Summary Arizona Climate Summary June 2015 Summary of conditions for May 2015 May 1 st 14 th : May began with high pressure in the west, and May 1 st was dry statewide,
Foundations of Earth Science, 6e Lutgens, Tarbuck, & Tasa
 Foundations of Earth Science, 6e Lutgens, Tarbuck, & Tasa Weather Patterns and Severe Weather Foundations, 6e - Chapter 14 Stan Hatfield Southwestern Illinois College Air masses Characteristics Large body
A bright flash that is produced due to electrical discharge and occurs during a thunderstorm.
 Science Mr. G/Mrs. Kelly Name: KEY Date: Inv.6.1 - That s a Fact: An Introduction to Thunderstorms, Tornadoes, and Hurricanes (pgs.92-97) 1. Define lightning. A bright flash that is produced due to electrical
2011 National Seasonal Assessment Workshop for the Eastern, Southern, & Southwest Geographic Areas
 2011 National Seasonal Assessment Workshop for the Eastern, Southern, & Southwest Geographic Areas On January 11-13, 2011, wildland fire, weather, and climate met virtually for the ninth annual National