October 2017 Climate Summary
|
|
|
- Andra Preston
- 5 years ago
- Views:
Transcription

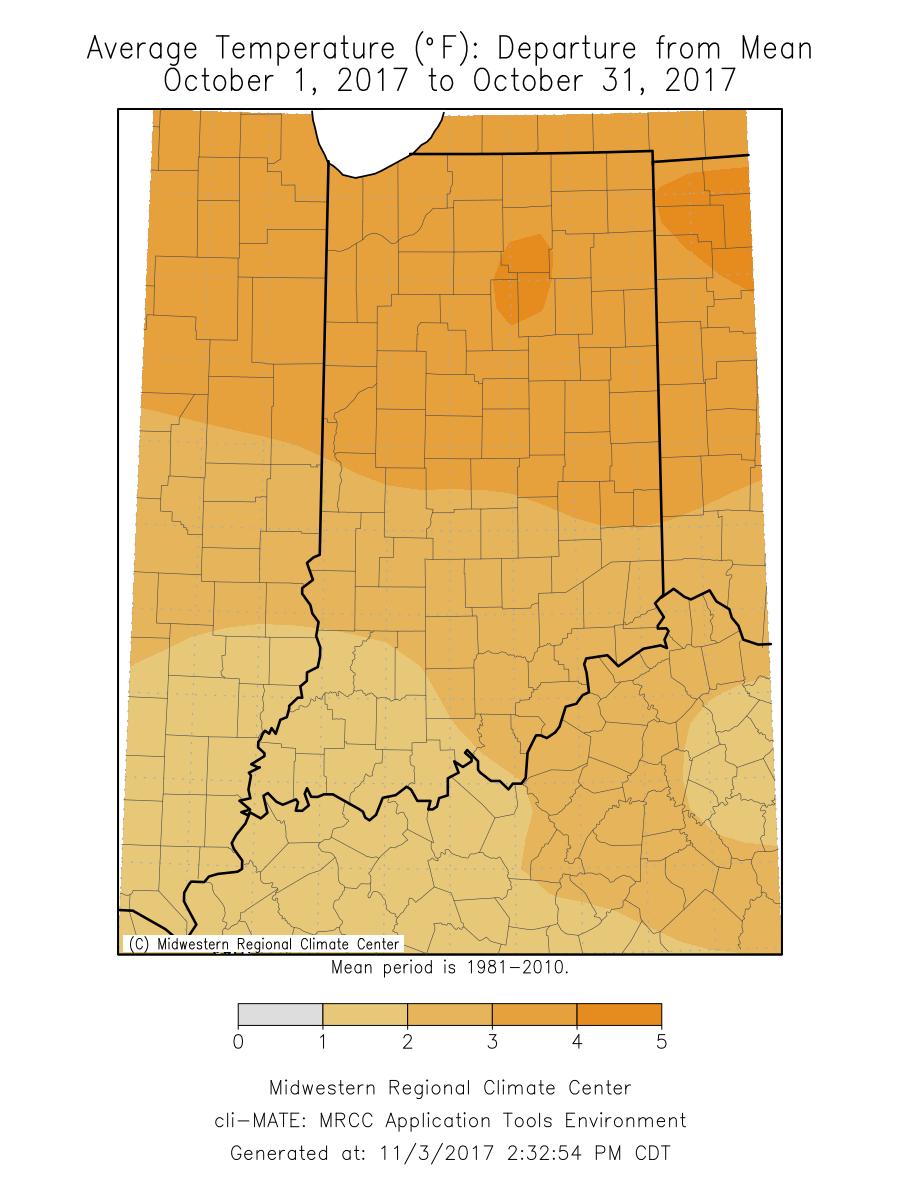
1 Ken Scheeringa and Andy Eggert Nov 6, 2017 (765) October 2017 Climate Summary Month Summary After more than three weeks of warm temperatures October turned suddenly cold the rest of the month. This was a wet month as the remnants of hurricane Nate added to rain totals in Ohio River counties. In far northwest Indiana heavy rains were noted on two dates. An EF-0 tornado on October 7 th was confirmed in Ripley and Dearborn counties with wind damage in Marion and Elkhart counties. Areas of dry soil shrank and combine fires were reduced by the precipitation but field harvest progress was slowed. The October state average temperature was 57.4 F. This ties 1941 and 1946 as the 17 th warmest October on record. Last year October was warmer at 59.5, the 6 th warmest on record. Since 2000 only October 2007 was also warmer than 2017 with its 60.2 F ranking as 5 th warmest. The warmest October on record was in 1947 at 60.9 F. The day split was 11 days of below normal temperature, 20 days above normal, and no days at normal. There were 11 days when the daily state average temperature was 10 F or more above normal and 4 days 10 F or more below normal. Except for October 1 st, 16 th, and 17 th, the first 23 days of the month logged above normal temperatures. The next 8 days were colder than normal with the cold intensifying at the end of October. The highest temperature of the month was 88 F at Terre Haute ISU on October 10 th. The coolest was 20 F on October 20 th at Wanatah 2 wnw and on October 26 th at Terre Haute ISU. The October state precipitation averaged to 4.36, which is 1.45 above normal. This places the month as the 20 th wettest October on record. Three Octobers since 2000 had more precipitation on a statewide basis: 2006 with 5.01 as the 10 th wettest, 2009 at 6.69 in 3 rd place, and 2001 with 7.75 good for 2 nd wettest. The wettest October on record occurred in 1919 with 8.17 as the state average. The heaviest single day precipitation among cooperative network stations in October 2017 was 4.14 on October 14 th at Laporte. The highest in the CoCoRaHS network was 4.95 on October 15 th at New Carlisle 7.3wnw. The largest month total precipitation in the cooperative network was 9.30 at Laporte. In the CoCoRaHS network the largest total was at Chesterton 4.2e. Widespread precipitation fell on about 16 days this month. Regionally October 2017 precipitation accumulated to about 160% of normal across northern Indiana, near 140% in central, and 150% of normal across the south. Normal October precipitation ranges from 2.7 in northeast and east central Indiana to 3.0 across the southern third of the state.
2 October 1 st 7 th The temperature roller coaster of recent weeks continued into October. Rising temperatures, then falling temperatures to end September, flipped again to a week of warming to begin October. Initial warming stabilized for a few days before rising again to end the week. The daily state average temperature climbed 19 F for the week start to finish. Only one front entered Indiana this week. Rainfall was measured on 4 of the 7 days and was heaviest in the dry central part of the state where it was most needed. Severe weather was scattered on October 7 th and included an EF-0 tornado near the Ripley-Dearborn county line. There was wind damage in Marion and Elkhart counties. There was almost no change in Indiana drought depiction by the October 10 th edition of the USDM map. Rainfall did slow harvest progress and curtail combine and field fires. A ridge of high pressure blanketed the east half of the country on October 1 st. Indiana skies were sunny and winds light. Daily temperatures had been cold the previous week and stood at 2 F below normal. The ridge center traveled to the Atlantic coast states the next day, turning Indiana winds from the south and lifting the daily state temperature to 4 F above normal. The ridge shifted to New England on October 3 rd. The warm backflow to Indiana intensified and boosted the daily state temperature to 11 F above normal. A Great Plains cold front had advanced to Minnesota and Iowa. The next day the ridge bubbled south to Virginia and New Jersey while the cold front entered Michigan and Illinois. Indiana barely remained in the warm sector that was eroding from the west. The temperature rise now slowed to 12 F above normal as rain moved in. The cold front reached central Indiana on October 5 th but stalled there as a stationary front. The state temperature fell a degree to 11 F above normal as the rain now became more widespread except over the south. The old eastern ridge drifted south into North Carolina which was a factor in halting the cold front over central Indiana. The ridge held its ground the next day and forced the stationary front to drift north into northern Indiana. High pressure on the north side of the front countered the southern ridge to fix the stationary front in place between them. More of Indiana rejoined the warm sector and the state temperature resumed its ascent to 12 F above normal. Rain continued in northern and central Indiana. On October 7 th both north and south ridges moved to the Atlantic but low centers in Iowa and Wisconsin tilted the advantage to expansion of the warm sector. The stationary front accelerated north as a warm front to the northern Great Lakes and warmer temperatures dominated Michigan and Indiana. The daily state temperature soared to 17 F above normal. Meanwhile a cold front extended from the storm center over Iowa south into Oklahoma and Texas. The Indiana state temperature averaged to 9 F above normal for the week. Normally in the first week of October daily maximum temperatures range between 66 F in far northern Indiana to 74 F in the southwest corner of the state. Daily minimums typically vary between 46 F and 49 F north to south across the state. The warmest temperature of the week among cooperative network stations was 87 F at Vincennes 5ne on October 7 th. The coolest temperature among stations in this same network was 32 F at Wanatah 2wnw on October 3 rd. No rain was measured the first 3 days of October. Gages across the northern half of the state collected rainfall on October 4 th and 7 th. Rain was recorded in northern and central Indiana on
3 October 5 th and 6 th. Regionally about 0.8 was received across northern Indiana, 1.4 in central sections, and 0.6 in the south. These totals equate to near normal in the north, 160% of normal in central Indiana, and 70% of normal in the southern third of the state. On the weekly rainfall map a heavy band of precipitation fell across central Indiana, generally south of an Attica to Decatur line and north of a Sullivan to Brookville line. This region varied from about 1.0 to 2.5. No rain was noted mostly south of a New Harmony to Loogootee to Madison line. Up to 0.5 was observed in a narrow band on the north edge of this dry area. Elsewhere 0.5 to 1.0 was common. The highest single day precipitation was recorded on October 6 th mostly in central Indiana. The CoCoRaHS observer in Homer measured 2.18 that day while in Rushville 2.07 was collected. The Sheridan volunteer had 2.02 while in Muncie 1.90 was received. Over the 7 days the Sheridan gage tallied 3.00 while two Lebanon observers had 2.97 and Outside Shelbyville 2.82 fell and in Franklin 2.50 was summed. Three severe weather events occurred on October 7 th. An EF-0 tornado was confirmed in southeast Indiana in Ripley and Dearborn counties and traveled a distance of 2.8 miles. Wind gusts reached 70 mph. There were no injuries but extensive damage. In Ripley county trees were snapped and a mobile home pushed off its foundation. Barn doors and home siding were ripped off, trees damaged extensively, a garage roof collapsed, and a semi-trailer pushed over by high winds. When the tornado crossed into Dearborn county it sheared more trees, caused extensive barn damage including tossing its roof almost a mile away, tore off more roofs, took down power poles, and did more garage damage. Building insulation was found nearly 4 miles away. While not caused by a tornado many Marion county homes had roof damage. A church steeple was snapped and a home chimney collapsed. In far northern Indiana a tree fell on to a road in Elkhart county. Tbe USDM map showed very little change in Indiana drought coverage between the September 26 th and October 10 th editions. A sliver of abnormally dry D0 area was added along the Ohio border of Jay and Randolph counties. As of October 10 th 8% of Indiana land area was rated in the D1 moderate drought category, 30% in the D0 abnormally dry category, and the remaining 62% in normal soil moisture status. The October 10 th edition of the USDA Indiana Crop Weather bulletin noted that light rain slowed harvest progress over the past week. Yet a benefit of the rain was it fell in very dry central Indiana and helped reduce combine and field fires. The report stated that Indiana corn was about 80% mature while 90% of soybeans were dropping their leaves. Due to the rain there was a shift among farmers from harvesting soybeans to harvesting corn, although corn harvest still lags behind an average year. Replanted soybeans were not yet mature. Despite generally poor pastures livestock were in good condition.
4 October 8 th 14 th The daily state average temperature persisted above normal every day this week. Not only was it warmer than normal but wet. Rainfall was recorded somewhere in Indiana on all 7 days. There were no severe weather days but the remnants of hurricane Nate did increase rainfall totals this week especially in far southern counties. A cold front in mid-week produced enough heavy rainfall in northern Indiana to nearly wipe out abnormally dry conditions there according to the US Drought Monitor. Crops not yet mature benefited from the rainfall but harvest progress was slowed by wet fields the USDA Indiana Crop Weather bulletin reported. A cold front had passed through Indiana the morning of October 8 th but stalled in Kentucky as the front awaited the arrival of the remnants of hurricane Nate. The Indiana state temperature tumbled to 9 F above normal with widespread moderate rainfall. The remnants of Nate merged with the stationary front and this combined system moved on to Pennsylvania the next day. A second stronger cold front was on its way from Wisconsin, wedging Indiana between these two storm centers. The state temperature rose a few degrees to 11 F above normal. On October 10 th the second cold front entered northern Indiana but it too slowed to a crawl. A low center in Arkansas rode along this front and transported warm air into Indiana ahead of the advancing cold front, slowing its progress. The Arkansas low reached Indiana the next day, transforming the stationary front into a narrow warm sector over eastern Indiana with a cold front trailing behind it just to the west. Rain fell heavily in northern Indiana as the two fronts passed. The state temperature plummeted to 5 F above normal. The storm system traveled to Ohio, leaving a trough behind in Indiana with leftover rainfall on October 12 th. The daily average temperature dropped a tad more to 3 F above normal, making this the coolest day of the week. The storm system had departed by the next day and high pressure over Maine backfilled over Indiana, setting up a new flow of warmer air. The state temperature rebounded to 9 F above normal. By October 14 th the Maine ridge core had bubbled south into the Carolinas, pumping still warmer air into Indiana. The state temperature lifted to 13 F above normal, making this the warmest day of the week. The ridge countered the advance of a new cold front from Wisconsin, forcing the front to
5 halt just north of Indiana. The stationary front extended from Michigan to Kansas, placing Indiana into yet another warm sector as the week closed. Over the 7 days the daily state temperature averaged to 9 F above normal. Usually by the middle of October the daily maximum temperature should range between 64 F and 72 F north to south across the state. Daily minimums normally vary from 44 F in far northern Indiana to 47 F in the far southwest corner of the state. The warmest temperature of the week according to stations in the cooperative network was 88 F at Terre Haute ISU on October 10 th. The coolest daily temperature among stations in this same network was 26 F at Wanatah 2wnw on October 12 th. On the weekly rainfall map 3 to 5 fell generally south of a Boonville to Brookville line and locally in the Rensselaer area of northwest Indiana. In contrast less than an inch was summed mostly inside an enclosed line from Bluffton to Frankfort to Rushville and back again. Elsewhere 1 to 3 was common. Regionally about 1.8 was collected in northern Indiana, 1.1 in central sections, and 2.1 across the south. These amounts equate to about 310% of normal in the northern third of the state, 190% in central, and 330% of normal in southern Indiana. Rain was noted statewide on October 8 th and 11 th, nearly statewide on the 10 th, in northern and central Indiana on October 12 th, and in the southeast two thirds of the state on October 9 th. Rainfall was scattered in the morning report of October 13 th and in the Michigan lake effect area only on October 14 th. The heaviest single day amounts in the CoCoRaHS network were measured on October 11 th when two Rensselaer observers recorded 3.10 and The volunteer at Mount Ayr had 2.86 in the rain gage. For the week 3.96 was summed outside Fredericksburg while the Milhousen observer had a tad less at In Hanover 3.70 was tallied while 3.57 drenched Leopold. The Milltown gage total came to The widespread rainfall improved dry soil conditions in northern Indiana according to the US Drought Monitor edition of October 17 th. Of 12 far northern counties designated abnormally dry in the D0 category the week prior, D0 conditions were eliminated in all but Lagrange and Steuben counties. There was no change in the moderate drought D1 category or abnormally dry D0 status in west central and central Indiana according to the USDM. The net Indiana week to week change was a 10% recovery in abnormally dry areas from 30% to 20% coverage. Moderate drought held at 8% coverage while the portion of the state in normal soil moisture status improved from 62% to 72% net land coverage. The October 16 th edition of the USDA Indiana Crop Report brought mixed news. While rain showers brought relief to dry northern areas, it caused field harvest delays in others. Late maturing crops, wheat fields, and pastures benefited from the needed rain. Some harvest operations would have to wait for fields to dry again. The corn crop was rated 92% mature with about 35% harvested. Nearly 95% of the soybeans had dropped their leaves with half the crop harvested. Pastures recovered due to the warmer temperatures and rainfall. Livestock enjoyed the improved pastures.
6 October 15 th 21 st This week featured only the second and third days of below normal temperature seen in October so far. The state average temperature then rebounded with 4 warm days to the end of the week. Only 2 cold fronts invaded Indiana this week as weather systems hurried across the continent. After a rainy start, especially in far northwest Indiana, most of the week was dry. There was no severe weather. The Indiana moderate drought area shrank a bit according to the US Drought Monitor. The mostly dry weather allowed for good harvest progress of major crops which were nearly all mature as noted in the Indiana Weather Crop bulletin. The state temperature was 7 F above normal on October 15 th as a strong cold front whipped across Indiana. The front had galloped to the Atlantic coast by the next morning, enabling much colder air to be pulled from the plains into the Great Lakes region. The Indiana state temperature tumbled to 2 F below normal as rain spread statewide. High pressure centered in Oklahoma was already clearing Indiana skies late in the day. A few leftover showers ended on October 17 th. A high pressure ridge sprinted to West Virginia. Indiana temperatures remained cold but slow warming began in the warmer backflow of this high center. Indiana skies were sunny with the state temperature at 1 F below normal. The eastern ridge nestled into the Appalachian Mountains the next day and extended the Indiana warmup. The state temperature rose a few degrees to 3 F above normal with sunshine and light winds. An intense low pressure center moved from Manitoba to Hudson Bay on October 19 th. Its cold front stretched across Michigan to the northwest tip of Indiana, then to Kansas. Indiana barely remained in a sector of warm air controlled by high pressure over Tennessee. The Indiana state temperature surged warmer to 8 F above normal. The cold front was weak and had no impact on Indiana as it raced to New England the next day. High pressure over Tennessee and Kentucky sprawled over the east half of the country and continued to dominate Indiana weather. The state temperatures climbed still higher to 12 F above normal. The ridge drifted east to Pennsylvania on October 21 st. The east half of the country was forged into a large warm sector which included Indiana as the week came to a close. The state temperature was sustained at 11 F above normal at the weekend.
7 Over the 7 day interval the Indiana state temperature averaged to 6 F above normal. Typically in this third week of October the daily maximum temperature should range from 61 F in far northern Indiana to 69 F in the southwest corner of the state. Daily minimums should vary between 42 F and 45 F north to south across the state. The warmest daily temperature of the week among cooperative network stations was 87 F at Terre Haute ISU on October 15 th. The coolest temperature among stations in this same network was 20 F at Wanatah 2wnw on October 20 th. On the weekly rainfall map the vast majority of Indiana generally south of a Morocco to Lagrange line received less than 0.5 for the week. The heaviest rainfall totals were found in a band of 3 to 5 in far northwest Indiana, mostly north of a Crown Point to South Bend line. The far northern portions of Porter, Laporte, and St Joseph counties measured the heaviest totals on October 15 th. Some of the local heavy spots on that date included just outside New Carlisle with 4.95, near Chesterton with 4.80, two locations in Laporte with 4.30 and 4.28, and in the vicinity of Trail Creek with For the week some of the heaviest sums were noted near Chesterton with 4.88, two places in Laporte with 4.47 and 3.80, at Granger with 3.52, and just east of Gary with Regionally about 0.5 was collected for the week in northern Indiana and about 0.2 in central and southern sections of the state. These amounts equate to about 70% of normal in the north, 30% in central, and 20% of normal across southern Indiana. Rain was tallied in the northwest corner of Indiana with scattered amounts in central and southwest Indiana on October 15 th, statewide on October 16 th, with very few reports on October 17 th. The rest of the week was dry. According to the October 24 th edition of the US Drought Monitor coverage of Indiana land area by moderate drought conditions decreased from 8% the week prior to 5%. The D1 region in west central Indiana shrank and split into two parts. A northern area included parts of 6 counties stretching from Vermillion to Hendricks county. To the south a portion of Monroe county was also retained in the D1 category. There was no net change in abnormally dry soil coverage, remaining at 20% of total land area. The fringes of the D0 region did expand slightly in west central Indiana while in northeast Indiana, Lagrange county was removed from the D0 category. Three fourths of total Indiana area was declared to be in normal soil moisture status. The mostly dry week was helpful to Indiana harvest progress. Soybean harvest had moved ahead of recent year trends but corn harvest lagged behind schedule. Both corn and soybeans were rated nearly mature statewide. Planting of wheat was underway. Both pastures and livestock were in good condition.

8 October 22 nd 31 st Above normal temperatures have dominated the October calendar but that changed dramatically in these final days of the month. A nearly continuous temperature slide closed the 10 day interval 26 F colder than where it began. The recent drier than normal trend was reversed with precipitation measured on 9 out of 10 days. The near absence of storms and fronts passing through Indiana in recent weeks was replaced by frequent and numerous weather systems crossing the state. The resulting heavier rainfall overall improved the state soil moisture status according to the October 31 st edition of the US Drought Monitor. Yet the wet and cold conditions slowed down field harvest progress according to the Indiana Crop Report bulletin of October 30 th. Indiana and the eastern half of the country were positioned inside a very large warm sector on October 22 nd bounded by fronts originating out of a Manitoba low pressure system. Its long cold front stretched from Canada to Texas with a secondary low pressure center riding this front in Missouri. The Indiana state temperature opened the 10 day interval at 12 F above normal. The next day the Missouri low arrived in Indiana. The cold front had slowed to become a stationary front along the western edge of the state. Rain began to fall and the state temperature began its decline to 5 F above normal. Another storm system in Minnesota with its own cold front tracked behind the Indiana front. On October 24 th the Minnesota and Indiana systems merged into a powerful low center over Lake Huron. The stationary front over Indiana had regained momentum and advanced to the Atlantic seashore while the second cold front also traveled east but dissolved into a trough as it reached Indiana. Much colder air was drawn into the state causing the Indiana temperature to crash to 5 F below normal. This complex storm withdrew northeast the next day but a new occluded low center formed in Minnesota once again. The Indiana state temperature dipped slightly to 7 F below normal. A secondary low formed in Nebraska off the parent occluded front with its own warm and cold fronts. Milder air behind the warm front overran this front into Indiana, lifting the state temperature for the day on October 26 th to 4 F below normal with no new rainfall. The Nebraska low moved to Lake Michigan the next day, dragging its cold front through Indiana. The state temperature resumed dropping to 9 F below normal.
9 The cold front moved east of Indiana on October 28 th. More cold air was transported in from Canada, lowering the Indiana state temperature to 13 F below normal. Another occluded low center in Manitoba developed a warm front south from South Dakota the next day, briefly shutting down the influx of cold air to Indiana. The state temperature held nearly stable at 12 F below normal. The Manitoba low slid east to Lake Superior on October 30 th. Its cold front advanced through Indiana with no immediate impact on the state temperature which remained at 12 F below normal. The cold front marched quickly to the Atlantic states on Halloween. Another round of cold air poured into Indiana, closing out the month with the state temperature 14 F below normal, the coldest day of the 10 day interval and the month. The Indiana state temperature averaged 6 F below normal over the 10 day interval. Typically near the end of October the daily maximum temperature would range between 58 F and 66 F north to south across the state. Daily minimums usually vary from 40 F in far northern Indiana to 43 F in the southwest corner of the state. The warmest temperature during the 10 days according to the cooperative station network was 80 F at Wabash on October 22 nd and at Spencer on October 23 rd The coldest temperature among stations in this same network was 20 F at Terre Haute ISU on October 26 th. On the weekly precipitation map 2 to 4 was summed in the northwest corner of Indiana, mostly north of a line from Kentland to South Bend. The heaviest amounts fell in the northern portions of Lake, Porter, and Laporte counties. About 2 to 2.5 was received in southeast Indiana generally south of a Corydon to North Vernon to Brookville line and in Vanderburgh county of southwest Indiana. The lightest totals were under an inch and fell in the northeast mostly east of an Angola to Warsaw to Portland line. Most of the rest of the state noted between 1 and 2 for the 10 days. Regionally about 1.6 was summed across northern Indiana, 1.4 in central, and 1.7 in southern Indiana. These totals equate to about 210% of normal in the north, 190% in central counties, and 220% of normal across southern Indiana. The heaviest single day rainfall amounts were observed by CoCoRaHS network observers on October 23 rd. On that day Evansville reported In Lake county Schneider measured 2.60, Schererville 2.33, Gary 2.25, and Hammond Over the 10 days Gary tallied 3.65, Porter 3.32, Laporte 3.23, Portage 3.23, and St John Rain fell statewide on October 24 th, 25 th, and 28 th, and nearly statewide on October 23 rd. Rainfall was scattered on the remaining days. The rainy pattern of late has improved Indiana soil moisture according to the October 31 st edition of the US Drought Monitor. Moderate drought, the D1 category, has decreased in coverage. The revised area includes parts of Vermillion county, almost all of Parke county, and about half of Putnam county. The region of D0 category abnormally dry soil has also diminished. This revised area is generally west of an Attica to Franklin to Princeton line with the exception of western Vigo, Sullivan, and Knox counties. The abnormally dry area of Steuben county has also been eliminated. With these changes the net Indiana coverage by moderate drought has fallen to 2% and abnormally dry to 15% of total land area. The remaining 83% of state area is now rated in normal soil moisture status.
10 The October 30 th edition of the USDA Indiana Weather Crop bulletin reported the wet and cold weather had slowed harvest progress. Some frost and mixed precipitation showers had occurred. Harvest of soybeans was nearing completion at 80%. With the colder and wetter conditions farmers had switched back to corn harvest, which had been behind schedule. The bulletin noted that winter wheat had all nearly emerged. Pastures were aided by the rain but it didn t matter for most which had gone dormant due to the recent cold. Livestock were reported in good condition.
11 October 2017 Temperature Region Temperature Normal Deviation Northwest North Central Northeast West Central Central East Central Southwest South Central Southeast State Precipitation Region Precipitation Normal Deviation Percent of Normal Northwest North Central Northeast West Central Central East Central Southwest South Central Southeast State
12 Autumn so far (Sep - Oct) Temperature Region Temperature Normal Deviation Northwest North Central Northeast West Central Central East Central Southwest South Central Southeast State Precipitation Region Precipitation Normal Deviation Percent of Normal Northwest North Central Northeast West Central Central East Central Southwest South Central Southeast State
13 2017 Annual so far (Jan - Oct) Temperature Region Temperature Normal Deviation Northwest North Central Northeast West Central Central East Central Southwest South Central Southeast State Precipitation Region Precipitation Normal Deviation Percent of Normal Northwest North Central Northeast West Central Central East Central Southwest South Central Southeast State
14
15
16

17 Drought Summary from the U.S. Drought Monitor Below is a drought summary for the state of Indiana from the U.S. Drought Monitor. Areas in white are not experiencing any drought. Yellow areas are abnormally dry, but not considered a drought. Drought begins when the moisture levels become more severe, with beige, orange, red, and brown indicating increasing levels of drought (moderate, severe, extreme, and exceptional, respectively). The table below indicates what percentage of the state is drought free, and how much of the state is in drought by degree of severity (D1 - D4 category).
18 Oct 3 rd Drought Summary
19 Oct 10 th Drought Summary

20 Oct 17 th Drought Summary
21 Oct 24 th Drought Summary
22 Oct 31 st Drought Summary
October 2011 Climate Summary
 Ken Scheeringa and Kayla Hudson Nov 4, 2011 http://www.iclimate.org October 2011 Climate Summary Month Summary October weather evolved as a two part story. Weather conditions the first half of the month
August 2017 Climate Summary
 Ken Scheeringa And Andy Eggert Sep 7, 2017 (765) 494-8105 http://www.iclimate.org August 2017 Climate Summary Month Summary The coolest August in 13 years featured long cool and warm spells, below normal
September 2016 Climate Summary
 Ken Scheeringa And Andy Eggert Oct 6, 2016 (765) 494-8105 http://www.iclimate.org September 2016 Climate Summary Month Summary The warmest September in 77 years brought alternating weeks of dry and wet
August 2013 Climate Summary
 Ken Scheeringa and Matt Price Sep 6, 2013 (765) 494-8105 http://www.iclimate.org August 2013 Climate Summary Month Summary August weather began cool and wet but became progressively warmer and drier through
November 2012 Climate Summary
 Ken Scheeringa and Kayla Hudson Dec 6, 2012 (765) 494-8105 http://www.iclimate.org November 2012 Climate Summary Month Summary November was one of those rare weather months in Indiana when not much happened:
October 2016 Climate Summary
 Ken Scheeringa And Andy Eggert Nov 9, 2016 (765) 494-8105 http://www.iclimate.org October 2016 Climate Summary Month Summary October was the 9 th month so far this year to average above normal in temperature.
May 2018 Climate Summary
 Ken Scheeringa and Andy Eggert Jun 7, 2018 (765) 494-8105 http://www.iclimate.org May 2018 Climate Summary Month Summary As the calendar turned from April to May temperatures flipped dramatically away
September 2011 Climate Summary
 Ken Scheeringa and Kayla Hudson Oct 5, 2011 (765) 494-8105 http://www.iclimate.org September 2011 Climate Summary Month Summary The final blast of summer heat arrived at the start of September. It lasted
October 2014 Climate Summary
 Ken Scheeringa And Matt Price Nov 10, 2014 (765) 494-8105 http://www.iclimate.org October 2014 Climate Summary Month Summary October featured a mix of weather. A very wet first half of the month evolved
November 2015 Climate Summary
 Ken Scheeringa And Mary Rose Mangan Dec 8, 2015 (765) 494-8105 http://www.iclimate.org November 2015 Climate Summary Month Summary November was much warmer than normal while precipitation was very near
March 2016 Climate Summary
 Ken Scheeringa And Andy Eggert Apr 8, 2016 (765) 494-8105 http://www.iclimate.org March 2016 Climate Summary Month Summary Count March as the 7 th month in a row that the state average temperature has
February 2017 Climate Summary
 Ken Scheeringa And Andy Eggert Mar 9, 2017 (765) 494-8105 http://www.iclimate.org February 2017 Climate Summary Month Summary February 2017 was the warmest February in Indiana since state climate records
April 2016 Climate Summary
 Ken Scheeringa And Andy Eggert May 9, 2016 (765) 494-8105 http://www.iclimate.org April 2016 Climate Summary Month Summary One month but two seasons. The first half of April was cold with snow. Wind damage
August 2006 Summary. August 1-5
 Ashley Brooks (765) 494-6574 Sep 8, 2006 http://www.iclimate.org August 1-5 August 2006 Summary The heat wave that started during the end of July continued into the beginning parts of August with temperatures
December 2011 Climate Summary
 Ken Scheeringa and Kayla Hudson Jan 17, 2012 (765) 494-8105 http://www.iclimate.org December 2011 Climate Summary Month Summary What a difference a year makes! A year ago the misery of a harsh, cold, and
March 2014 Climate Summary
 Ken Scheeringa And Matt Price Apr 8, 2014 (765) 494-8105 http://www.iclimate.org March 2014 Climate Summary Month Summary Winter had officially ended by the calendar but snow and cold persisted in Indiana
August 2015 Climate Summary
 Ken Scheeringa And Mary Rose Mangan Sep 4, 2015 (765) 494-8105 http://www.iclimate.org August 2015 Climate Summary Month Summary A very active wet summer weather pattern turned much calmer and drier in
May 2016 Climate Summary
 Ken Scheeringa And Andy Eggert Jun 6, 2016 (765) 494-8105 http://www.iclimate.org May 2016 Climate Summary Month Summary Cold weather dominated in May until the last week of the month. May began wet but
April 2017 Climate Summary
 Ken Scheeringa And Andy Eggert May 8, 2017 (765) 494-8105 http://www.iclimate.org April 2017 Climate Summary Month Summary April was a very warm and wet month in Indiana, nearly setting a new monthly temperature
January 2017 Climate Summary
 Ken Scheeringa And Andy Eggert Feb 8, 2017 (765) 494-8105 http://www.iclimate.org January 2017 Climate Summary Month Summary The warmest January in 11 years was nearly 4 F warmer than December 2016. An
January 2008 Climate Summary
 Joseph Mays (765) 494-6574 Feb 5, 2008 http://www.iclimate.org Summary January 2008 Climate Summary January was a mix bag of conditions, with an oscillatory pattern developing. We experienced phases of
July 2007 Climate Summary
 Dan Bowman (765) 494-6574 Sep 3, 2007 http://www.iclimate.org Summary July 2007 Climate Summary The month of July ended as a very unusual month. Many events occurred during the month of July that is not
November 2017 Climate Summary
 Ken Scheeringa and Andy Eggert Dec 8, 2017 (765) 494-8105 http://www.iclimate.org November 2017 Climate Summary Month Summary November temperatures alternated spells of warm and cool while precipitation
April 2015 Climate Summary
 Ken Scheeringa And Mary Rose Mangan May 8, 2015 http://www iclimate org April 2015 Climate Summary Month Summary April was a month of extremes. Severe weather erupted on 4 days of the first week with multiple
March 2018 Climate Summary
 Ken Scheeringa and Andy Eggert Apr 5, 2018 (765) 494-8105 http://www.iclimate.org March 2018 Climate Summary Month Summary March turned cold with below normal temperatures on two-thirds of its days. Along
November 2014 Climate Summary
 Ken Scheeringa And Matt Price Dec 10, 2014 (765) 494-8105 http://www.iclimate.org November 2014 Climate Summary Month Summary Unseasonable cold headlined the Indiana and national news in November. The
November 2010 Climate Summary
 Ken Scheeringa (765) 494-8105 Dec 6, 2010 http://www.iclimate.org November 2010 Climate Summary Summary A four month drought in Indiana is collapsing as significant rain fell the final week of November.
October 2012 Climate Summary
 Ken Scheeringa and Kayla Hudson Nov 8, 2012 (765) 494-8105 http://www.iclimate.org October 2012 Climate Summary Month Summary In a reversal from the hot and dry summer, cooler and wetter than normal conditions
May 2015 Climate Summary
 Ken Scheeringa And Mary Rose Mangan Jun 8, 2015 (765) 494-8105 http://www.iclimate.org May 2015 Climate Summary Month Summary May was a very warm month. Rainfall averaged near normal but was distributed
January 2018 Climate Summary
 Ken Scheeringa and Andy Eggert Feb 8, 2018 (765) 494-8105 http://www.iclimate.org January 2018 Climate Summary Month Summary January temperature swings were amazing. In the first few days arctic cold pushed
June 2016 Climate Summary
 Ken Scheeringa And Andy Eggert Jul 8, 2016 (765) 494-8105 http://www.iclimate.org June 2016 Climate Summary Month Summary June was a warm month with below normal temperature on just 6 days. Rainfall was
September 2005 Climate Summary
 Ashley Brooks (765) 494-6574 Oct 5, 2005 http://iclimate.org September 2005 Climate Summary September 1-7 A cold front came through on the 1 st of the month, however little moisture was associated with
November 2016 Climate Summary
 Ken Scheeringa And Andy Eggert Dec 15, 2016 (765) 494-8105 http://www.iclimate.org November 2016 Climate Summary Month Summary Unseasonably warm, pleasant, and sunny weather the first half of the month
September 2012 Climate Summary
 Ken Scheeringa and Kayla Hudson Oct 5, 2012 (765) 494-8105 http://www.iclimate.org September 2012 Climate Summary Month Summary Summer slipped away and it felt a lot more like autumn in Indiana this month
April 2013 Climate Summary
 Ken Scheeringa and Kayla Hudson May 6, 2013 (765) 494-8105 http://www.iclimate.org April 2013 Climate Summary Month Summary Temperatures bounced high and low this month, keeping Hoosiers guessing which
Crop / Weather Update
 Crop / Weather Update The next will be published November 13, 2018, due to the Veteran s Day holiday on Monday. Corn Harvesting Progress 100% 90% 80% 70% 60% 50% 40% 30% 20% 10% 0% 9/9 9/16 9/23 9/30 10/7
Monthly Long Range Weather Commentary Issued: July 18, 2014 Steven A. Root, CCM, President/CEO
 Monthly Long Range Weather Commentary Issued: July 18, 2014 Steven A. Root, CCM, President/CEO sroot@weatherbank.com JUNE 2014 REVIEW Climate Highlights The Month in Review The average temperature for
Monthly Long Range Weather Commentary Issued: SEPTEMBER 19, 2016 Steven A. Root, CCM, Chief Analytics Officer, Sr. VP,
 Monthly Long Range Weather Commentary Issued: SEPTEMBER 19, 2016 Steven A. Root, CCM, Chief Analytics Officer, Sr. VP, sroot@weatherbank.com SEPTEMBER 2016 Climate Highlights The Month in Review The contiguous
July 2010 Climate Summary
 Ken Scheeringa (765) 494-8105 Aug 4, 2010 http://www.iclimate.org July 2010 Climate Summary Summary The warm summer of 2010 continues. Daily state average temperatures were above normal on all but seven
May 2005 Climate Summary
 Ashley Brooks (765) 494-6574 Jun 7, 2005 http://iclimate.org May 2005 Climate Summary May 1-5 Early May was characterized by an upper-level trough that was in place over Indiana that brought in very cool
Crop / Weather Update
 Crop / Weather Update Corn Crop Condition Percent of Acreage Rated Good or Excellent 85 80 75 70 65 60 55 50 45 The U.S. corn crop was rated 69% good-to-excellent on September 23, up 1% from week-ago,
January 2012 Climate Summary
 Ken Scheeringa and Kayla Hudson Feb 6, 2012 (765) 494-8105 http://www.iclimate.org January 2012 Climate Summary Month Summary Where is winter? This question found its way into many conversations throughout
Crop / Weather Update
 Crop / Weather Update Corn Crop Condition Percent of Acreage Rated Good or Excellent 85 80 75 70 65 60 55 50 45 Corn condition this week is the same as the last two weeks in the good/excellent category,
2012 Growing Season Weather Summary for North Dakota. Adnan Akyüz and Barbara A. Mullins Department of Soil Science October 30, 2012
 2012 Growing Season Weather Summary for North Dakota Adnan Akyüz and Barbara A. Mullins Department of Soil Science October 30, 2012 Introduction The 2012 growing season (the period from April through September)
National Wildland Significant Fire Potential Outlook
 National Wildland Significant Fire Potential Outlook National Interagency Fire Center Predictive Services Issued: September, 2007 Wildland Fire Outlook September through December 2007 Significant fire
2011 Year in Review TORNADOES
 2011 Year in Review The year 2011 had weather events that will be remembered for a long time. Two significant tornado outbreaks in April, widespread damage and power outages from Hurricane Irene in August
August 2016 Climate Summary
 Ken Scheeringa And Andy Eggert Sep 12, 2016 (765) 494-8105 http://www.iclimate.org August 2016 Climate Summary Month Summary Hot but tranquil weather the first half of August transitioned to a tormented
January 2013 Climate Summary
 Ken Scheeringa and Kayla Hudson Feb 7, 2013 (765) 494-8105 http://www.iclimate.org January 2013 Climate Summary Month Summary Winter or spring? January featured several dramatic swings in temperature and
Crop / Weather Update
 Crop / Weather Update Corn Crop Condition Percent of Acreage Rated Good or Excellent 85 80 75 70 65 60 55 50 45 As of September 9, USDA rates the crop at 68% good to excellent. The rating is up one point
March 2009 Climate Summary
 Joseph Mays (765) 494-6574 Apr 1, 2009 http://www.iclimate.org Summary March 2009 Climate Summary March is in the books and it continued the trend of extreme weather we have experienced during the first
The hydrologic service area (HSA) for this office covers Central Kentucky and South Central Indiana.
 for this office covers Central Kentucky and South Central Indiana.") January 2012 February 13, 2012 An X inside this box indicates that no flooding occurred within this hydrologic service area. January 2012 continued the string of wet months this winter. Rainfall was generally
January 2012 February 13, 2012 An X inside this box indicates that no flooding occurred within this hydrologic service area. January 2012 continued the string of wet months this winter. Rainfall was generally
Crop / Weather Update
 Crop / Weather Update This is our last for the 2018 planting, growing and harvesting seasons. USDA will publish their Crop Progress Report again in April 2019, and we will continue our coverage sometime
July 2014 Climate Summary
 Ken Scheeringa And Matt Price Aug 8, 2014 (765) 494-8105 http://www.iclimate.org July 2014 Climate Summary Month Summary July was unseasonably cool and drier than normal. Rainfall was light in parts of
Monthly Long Range Weather Commentary Issued: May 15, 2014 Steven A. Root, CCM, President/CEO
 Monthly Long Range Weather Commentary Issued: May 15, 2014 Steven A. Root, CCM, President/CEO sroot@weatherbank.com APRIL 2014 REVIEW Climate Highlights The Month in Review The average temperature for
February 2016 Climate Summary
 Ken Scheeringa And Andy Eggert Mar 9, 2016 (765) 494-8105 http://www.iclimate.org February 2016 Climate Summary Month Summary February was the 6 th consecutive month with an above normal state average
October 2010 Climate Summary
 Ken Scheeringa (765) 494-8105 Nov 5, 2010 http://www.iclimate.org October 2010 Climate Summary Summary Rain fell on about 10 days in October but did little to slow the drought raging across Indiana. For
National Wildland Significant Fire Potential Outlook
 National Wildland Significant Fire Potential Outlook National Interagency Fire Center Predictive Services Issued: April 1, 2008 Next Issue: May 1, 2008 Wildland Fire Outlook April 2008 through July 2008
Crop / Weather Update
 Crop / Weather Update Corn Crop Condition Percent of Acreage Rated Good or Excellent 85 80 75 70 65 60 55 50 45 Corn condition this week is the same as last week in the good/excellent category, which is
UNITED STATES AND SOUTH AMERICA OUTLOOK (FULL REPORT) Thursday, December 28, 2017
 Thursday, December 28, 2017") T-storm Weather Summary Despite scattered t-storms Sat.-Sun. in central and northern areas in Argentina, more will likely be needed especially in sunflower areas of the southwest. Some t-storms likely
T-storm Weather Summary Despite scattered t-storms Sat.-Sun. in central and northern areas in Argentina, more will likely be needed especially in sunflower areas of the southwest. Some t-storms likely
June 2010 Climate Summary
 Ken Scheeringa (765) 494-8105 Jul 6, 2010 http://www.iclimate.org June 2010 Climate Summary Summary Summer like heat and humidity arrived in Indiana on May 22 nd and dominated our weather scene nearly
January 2006 Climate Summary
 Ashley Brooks (765) 494-6574 Feb 9, 2006 http://www.iclimate.org January 1-3 January 2006 Climate Summary Unseasonably warm conditions welcomed in the New Year with highs in the 40s across the northern
2018 Year in Review for Central and Southeast Illinois By: Chris Geelhart, Meteorologist National Weather Service, Lincoln IL
 By: Chris Geelhart, Meteorologist National Weather Service, Lincoln IL While 2018 featured some significant out-of-season weather, including below zero temperatures in April and 90-degree highs in early
Crop / Weather Update
 Crop / Weather Update Corn Crop Condition Percent of Acreage Rated Good or Excellent 85 80 75 70 65 60 55 50 45 In its weekly Crop Progress Report for September 16, the USDA stated the 18-state average
Champaign-Urbana 2001 Annual Weather Summary
 Champaign-Urbana 2001 Annual Weather Summary ILLINOIS STATE WATER SURVEY 2204 Griffith Dr. Champaign, IL 61820 wxobsrvr@sws.uiuc.edu Maria Peters, Weather Observer January: After a cold and snowy December,
Weather and Climate Summary and Forecast Summer 2017
 Weather and Climate Summary and Forecast Summer 2017 Gregory V. Jones Southern Oregon University August 4, 2017 July largely held true to forecast, although it ended with the start of one of the most extreme
but 2012 was dry Most farmers pulled in a crop
 After a winter that wasn t, conditions late in the year pointed to a return to normal snow and cold conditions Most farmers pulled in a crop but 2012 was dry b y M i k e Wr o b l e w s k i, w e a t h e
National Drought Summary August 14, 2018
 National Drought Summary August 14, 2018 The discussion in the Looking Ahead section is a description of what the official national guidance from the National Weather Service (NWS) National Centers for
Champaign-Urbana 1998 Annual Weather Summary
 Champaign-Urbana 1998 Annual Weather Summary ILLINOIS STATE WATER SURVEY Audrey Bryan, Weather Observer 2204 Griffith Dr. Champaign, IL 61820 wxobsrvr@sparc.sws.uiuc.edu The development of the El Nìno
Summary of November Central U.S. Winter Storm By Christopher Hedge
 Summary of November 12-13 2010 Central U.S. Winter Storm By Christopher Hedge Event Overview The first significant snowfall of the 2010-2011 season affected portions of the plains and upper Mississippi
July 2011 Climate Summary
 Ken Scheeringa (765) 494-8105 Aug 8, 2011 http://www.iclimate.org July 2011 Climate Summary Month Summary The upper atmospheric high pressure dome which baked the Texas area in heat and drought the past
June 2015 Climate Summary
 Ken Scheeringa And Mary Rose Mangan Jul 10, 2015 (765) 494-8105 http://www.iclimate.org June 2015 Climate Summary Month Summary Indiana set a new June rainfall record this month with a state average 8.99.
June 2011 Climate Summary
 Ken Scheeringa (765) 494-8105 Jul 8, 2011 http://www.iclimate.org June 2011 Climate Summary Month Summary The abundance of extreme weather this year extended yet another month into June. This month has
The Pennsylvania Observer
 The Pennsylvania Observer September 3, 2008 Summer 2008 Weather Summary Written by: Brian Thompson The opening days of June started dry, but a warm front brought a widespread rain a couple of days into
The Pennsylvania Observer
 The Pennsylvania Observer August 3, 2015 July 2015 - Pennsylvania Weather Recap By: Arthur Person Although this seventh month of 2015 was fairly normal across Pennsylvania as a whole, the details reveal
Weather and Climate Summary and Forecast October 2017 Report
 Weather and Climate Summary and Forecast October 2017 Report Gregory V. Jones Linfield College October 4, 2017 Summary: Typical variability in September temperatures with the onset of fall conditions evident
The hydrologic service area (HSA) for this office covers Central Kentucky and South Central Indiana.
 for this office covers Central Kentucky and South Central Indiana.") MONTH YEAR January 2011 February 15, 2011 X An X inside this box indicates that no flooding occurred within this hydrologic service area. January 2011 was drier than normal in all locations in the area.
MONTH YEAR January 2011 February 15, 2011 X An X inside this box indicates that no flooding occurred within this hydrologic service area. January 2011 was drier than normal in all locations in the area.
SEPTEMBER 2013 REVIEW
 Monthly Long Range Weather Commentary Issued: October 21, 2013 Steven A. Root, CCM, President/CEO sroot@weatherbank.com SEPTEMBER 2013 REVIEW Climate Highlights The Month in Review The average temperature
Champaign-Urbana 1999 Annual Weather Summary
 Champaign-Urbana 1999 Annual Weather Summary ILLINOIS STATE WATER SURVEY 2204 Griffith Dr. Champaign, IL 61820 wxobsrvr@sws.uiuc.edu Maria Peters, Weather Observer A major snowstorm kicked off the new
Weather Report 04 April 2018
 Weather Report 04 April 2018 South Africa - Weather Alternating periods of rain and sunshine will evolve across South Africa during the coming week. Moisture totals through next Tuesday morning will range
Monthly Long Range Weather Commentary Issued: APRIL 18, 2017 Steven A. Root, CCM, Chief Analytics Officer, Sr. VP,
 Monthly Long Range Weather Commentary Issued: APRIL 18, 2017 Steven A. Root, CCM, Chief Analytics Officer, Sr. VP, sroot@weatherbank.com MARCH 2017 Climate Highlights The Month in Review The average contiguous
CropCast Corn and Soybean Report Kenny Miller Tuesday, March 14, 2017
 Accumulated Rainfall (inches) Accumulated GDDs Temperature ( F)/Wind Speed (mph) Precipitation (inches) CropCast Corn and Soybean Report Kenny Miller Tuesday, March 14, 2017 Peoria, IL Regional Forecast
New Hampshire State Climate Office Dr. Mary D. Stampone, State Climatologist
 New Hampshire State Climate Office Dr. Mary D. Stampone, State Climatologist University of New Hampshire c/o Department of Geography 73 Main Street Durham, NH 03824 Phone: 603-862-3136 Fax: 603-862-4362
CropCast Corn and Soybean Report Kyle Tapley Monday, March 20, 2017
 Accumulated Rainfall (inches) Accumulated GDDs Temperature ( F)/Wind Speed (mph) Precipitation (inches) CropCast Corn and Soybean Report Kyle Tapley Monday, March 20, 2017 Peoria, IL Regional Forecast
CropCast Corn and Soybean Report Kenny Miller Monday, March 13, 2017
 Accumulated Rainfall (inches) Accumulated GDDs Temperature ( F)/Wind Speed (mph) Precipitation (inches) CropCast Corn and Soybean Report Kenny Miller Monday, March 13, 2017 Peoria, IL Regional Forecast
Monthly Long Range Weather Commentary Issued: NOVEMBER 16, 2015 Steven A. Root, CCM, Chief Analytics Officer, Sr. VP, sales
 Monthly Long Range Weather Commentary Issued: NOVEMBER 16, 2015 Steven A. Root, CCM, Chief Analytics Officer, Sr. VP, sales sroot@weatherbank.com OCTOBER 2015 Climate Highlights The Month in Review The
Monthly Long Range Weather Commentary Issued: APRIL 25, 2016 Steven A. Root, CCM, Chief Analytics Officer, Sr. VP, sales
 Monthly Long Range Weather Commentary Issued: APRIL 25, 2016 Steven A. Root, CCM, Chief Analytics Officer, Sr. VP, sales sroot@weatherbank.com MARCH 2016 Climate Highlights The Month in Review The March
NWS FORM E-5 U.S. DEPARTMENT OF COMMERCE I HYDRO SERVICE AREA NOAA, NATIONAL WEATHER SERVICE I Indianapolis, IN MONTHLY REPORT
 NWS FORM E-5 U.S. DEPARTMENT OF COMMERCE I HYDRO SERVICE AREA NOAA, NATIONAL WEATHER SERVICE I Indianapolis, IN. 1-------------------- MONTHLY REPORT OF RIVER AND FLOOD CONDITIONSI REPORT FOR I November
The Pennsylvania Observer
 The Pennsylvania Observer October 1, 2015 September 2015 - Pennsylvania Weather Recap By: Quinn Lease The month of September will be remembered for its above normal temperatures and dry conditions that
Weather and Climate Risks and Effects on Agriculture
 Weather and Climate Risks and Effects on Agriculture Dr. Eric Snodgrass Official Journal of the Fluid Fertilizer Foundation Vol. 26, No. 2, Issue #100 DOWNLOAD Summary: So, what do we need to watch for?
CropCast Corn and Soybean Report Kenny Miller Friday, March 17, 2017
 Accumulated Rainfall (inches) Accumulated GDDs Temperature ( F)/Wind Speed (mph) Precipitation (inches) CropCast Corn and Soybean Report Kenny Miller Friday, March 17, 2017 Peoria, IL Regional Forecast
NIDIS Weekly Climate, Water and Drought Assessment Summary. Upper Colorado River Basin July 31, 2012
 NIDIS Weekly Climate, Water and Drought Assessment Summary Upper Colorado River Basin July 31, 2012 Fig. 1: July month-to-date precipitation in inches. Fig. 2: SNOTEL WYTD precipitation percentiles (50%
Colorado CoCoRaHS. Colorado CoCoRaHS. Because Every Drop Counts! November 2014 Volume 2, Issue 11
 U.S. PRECIPITATION (% OF AVERAGE) LOOKING BACK AT OCTOBER 2014 October was a fairly dry month for much of the nation with the exception of the Pacific Northwest, portions of New England and the Tennessee
January 25, Summary
 January 25, 2013 Summary Precipitation since the December 17, 2012, Drought Update has been slightly below average in parts of central and northern Illinois and above average in southern Illinois. Soil
UNITED STATES AND SOUTH AMERICA OUTLOOK (FULL REPORT) Wednesday, April 18, 2018
 Wednesday, April 18, 2018") T-storm Weather Summary Coolness continues over the next week in much of the central U.S., most likely producing the coldest April since 1907 in the Corn Belt, but followed by seasonable to mild weather
T-storm Weather Summary Coolness continues over the next week in much of the central U.S., most likely producing the coldest April since 1907 in the Corn Belt, but followed by seasonable to mild weather
W I N T E R STORM HAZARD DESCRIPTION
 W I N T E R STORM HAZARD DESCRIPTION... 1 LOCATION... 2 EXTENT... 2 HISTORICAL OCCURRENCES... 4 SIGNIFICANT PAST EVENTS... 4 PROBABILITY OF FUTURE EVENTS... 5 VULNERABILITY AND IMPACT... 5 HAZARD DESCRIPTION
April 2011 Climate Summary
 Ken Scheeringa (765) 494-8105 May 9, 2011 http://www.iclimate.org April 2011 Climate Summary Summary After somewhat of a respite in March Indiana weather ramped up with a vengeance in April. Extreme weather
Illinois Drought Update, December 1, 2005 DROUGHT RESPONSE TASK FORCE Illinois State Water Survey, Department of Natural Resources
 Illinois Drought Update, December 1, 2005 DROUGHT RESPONSE TASK FORCE Illinois State Water Survey, Department of Natural Resources For more drought information please go to http://www.sws.uiuc.edu/. SUMMARY.
WeatherManager Weekly
 Issue 288 July 14, 2016 WeatherManager Weekly Industries We Serve Agriculture Energy/Utilities Construction Transportation Retail Our Weather Protection Products Standard Temperature Products Lowest Daily
NIDIS Drought and Water Assessment
 NIDIS Drought and Water Assessment PRECIPITATION The images above use daily precipitation statistics from NWS COOP, CoCoRaHS, and CoAgMet stations. From top to bottom, and left to right: most recent 7-days
March 2011 Climate Summary
 Ken Scheeringa (765) 494-8105 Apr 5, 2011 http://www.iclimate.org March 2011 Climate Summary Summary The fast paced weather action of February slowed some in March. The major March weather features were