November 2015 Climate Summary
|
|
|
- Gerald Richard
- 5 years ago
- Views:
Transcription

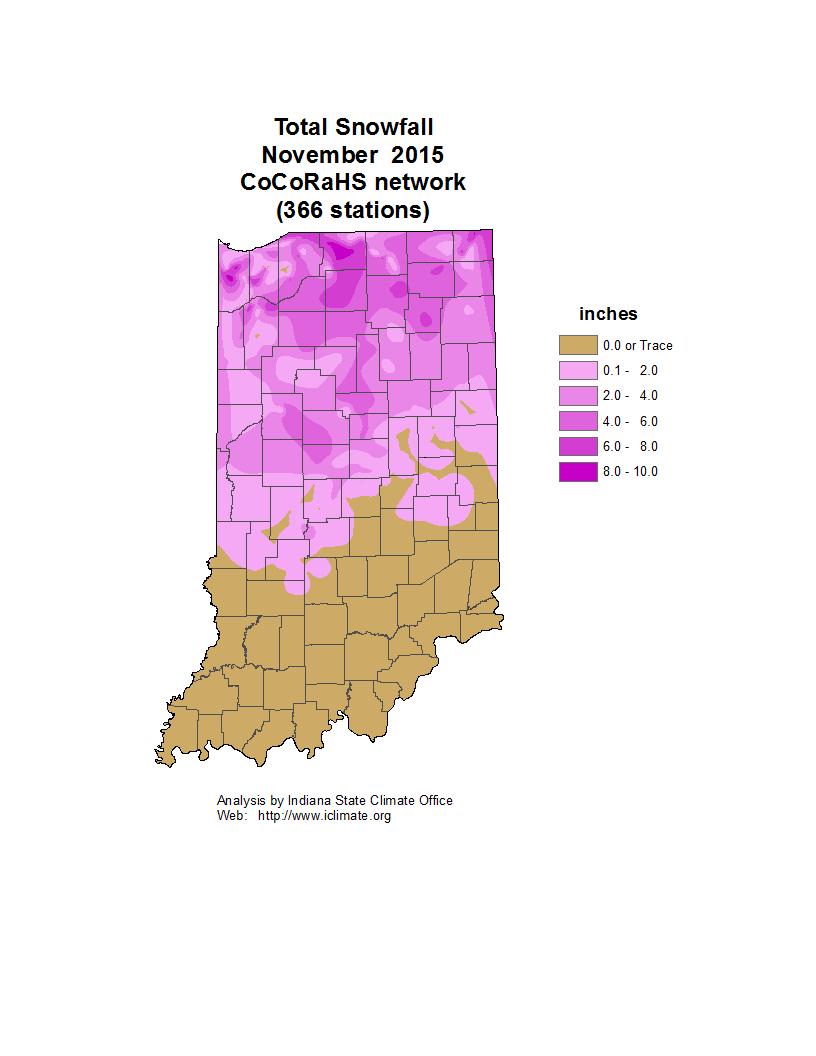
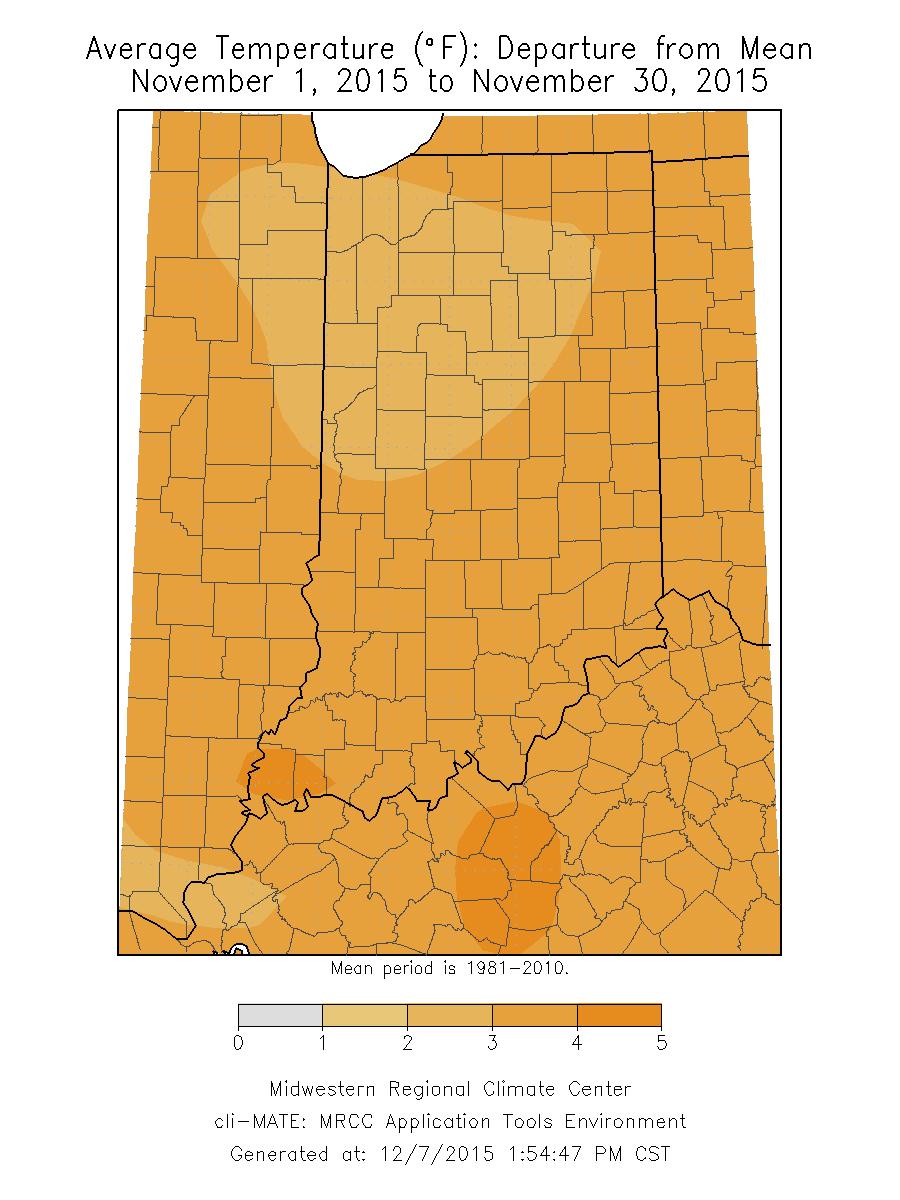
1 Ken Scheeringa And Mary Rose Mangan Dec 8, 2015 (765) November 2015 Climate Summary Month Summary November was much warmer than normal while precipitation was very near average. The first and only snow event of the season thus far was significant and arrived on November 21 st and 22 nd. Snowfall was heavy in 3 northern counties. Lake county dealt with icy roads and interstates as well as power outages when snow laden branches fell on to power lines. The state drought status improved very slightly over the duration of the month. Open burn bans continued in 3 counties. By mid-month the commercial harvest season had ended. The state average temperature for November 2015 was 4.1 F above normal at 46.5 F, the 9 th warmest November on record. This marks the 3 rd consecutive month with above normal state temperature. Recent warmer Novembers include 2011 at 46.9 F tied in 6 th place with In November 2001 the state temperature averaged 49.0 F as 3 rd warmest. The warmest November on record was 49.1 F which occurred in The day split in November 2015 was 7 days of below normal temperature, 22 days above normal, and 1 day at normal. There was 1 day when the state temperature was at least 10 F below normal and 8 days when the state temperature was at least 10 F above normal. The highest temperature of the month in the cooperative observer network was 82 F on November 4 th at Cannelton. The coldest minimum was 2 F at Lowell on November 22 nd. The November state precipitation average of 3.64 was 0.05 above normal and tied 1913 as the 38 th wettest November on record. Three consecutive Novembers in 2003, 2004, and 2005 were wetter than November 2015, posting in the 26 th, 16 th, and 33 rd slots. The November 2010 state precipitation of 5.01 came in 14 th place while 6.21 in 2011 was good for 3 rd wettest. The wettest November on record was 8.20 in The highest single day precipitation among cooperative stations in November 2015 was 2.40 recorded on November 10 th in Marengo. The highest daily total in the CoCoRaHS network was 2.87 measured on November 28 th at Indianapolis 9.5 ne. The highest monthly precipitation in the cooperative network was 7.45 as tallied at Marengo. In the CoCoRaHS network the highest monthly total was 6.46 recorded at Galena 4.3 ene. Regionally November 2015 precipitation was about 85% of normal in northern Indiana, near 90% of normal in central counties, and around 120% of normal across the south. Normal November precipitation ranges from 3.0 in northeast to 4.3 in southwest Indiana. Widespread precipitation fell on about 11 days this month. November snow fell over 2 days in one event in northern and central Indiana. The highest monthly snow total in the cooperative network was 9.1 at the South Bend Michiana Airport. In the CoCoRaHS network the maximum snowfall was 9.7 at South Bend 3.3 ssw.
2 November 1 st 7 th November jumped off to a pleasant start with above normal temperatures all week long. Most of the rain fell during the lone cold front which passed through Indiana on November 6 th. There was little change in the state drought status. Open burn bans continued in 3 counties. The 2015 harvest season nearly reached its conclusion this week. The state average temperature began the week at 2 F above normal. Storm systems were located far north and south of Indiana on November 1 st. The next day Texas high pressure galloped into Pennsylvania between these storm centers, establishing a warm southerly wind flow to Indiana. The state temperature rose to 7 F above normal. The ridge sprawled and increased in strength on November 3 rd and 4 th. The state temperature ramped up to 10 above then 14 F above normal. The northern stationary front now lie over the Great Lakes while the southern front held steady over Florida. The southern front dissolved on November 5 th as the Bermuda high migrated into Virginia. Meanwhile the Great Lakes front was forced as a warm front far to the north into Canada. The Indiana temperature soared to 17 F above normal, the warmest of the week. High pressure now dominated the eastern half of the USA. On November 6 th multiple low pressure centers exited Minnesota and joined up in Hudson Bay, exploding in intensity. A long cold front in the Great Plains swept rapidly eastward, crossing through Indiana early that morning. The state temperature cooled slightly to 14 F above normal. By the next day the northern extent of this cold front had reached the Atlantic Ocean while its southern portion was nearing the Gulf of Mexico. Cooler air behind the front rumbled east into Indiana. The state temperature now skidded rapidly to close the week at 3 F above normal on November 7 th, returning the state temperature to about where it started. Overall this week the state temperature averaged to 9 F above normal. Typically to start November the daily maximum temperature should range between 54 F in far northern Indiana to 62 F in the far southwest corner of the state. Normal daily minimums vary between 37 F and 40 F north to south across the state. The warmest temperature of the week among stations in the cooperative observer network was 82 F at Cannelton on November 4 th. The coolest temperature in this same network was 28 F at Warsaw and Whitestown on November 7 th. The weekly total rainfall map shows that more than 1.5 of rain fell generally south of a Tell City to Patoka Lake to Logan line. In contrast less than 0.25 was common in an area generally bounded on the south by a Rockville to Decatur line and on the north by a Fowler to Angola line. This region had the lowest totals in the state. The largest single day amounts as recorded in the CoCoRaHS network the morning of November 6 th included 1.62 in New Albany, 1.58 at Bright and Aurora, 1.56 in Salem, and 1.48 at Hanover. For the week the highest totals in this same network were 1.84 at Salem, 1.80 in Hanover, 1.79 and 1.75 at two locations near Aurora, and 1.73 outside New Pekin. Regionally about 0.4 to 0.5 was recorded in northern and central Indiana while 1.0 was noted in southern Indiana. These amounts equate to about 60% of normal in northern and central counties and 130% of normal across the south. There was a very small improvement in Indiana drought status between November 3 rd and 10 th according to the US Drought Monitor. A narrow strip of D0 abnormally dry soils reverted to
3 normal soil moisture status along a line from about Bloomington to Hazelton. With this change there existed a sharp transition from D1 moderate drought to normal soil moisture status along this line and along the Wabash River south of Hazelton. No other category changes were made. The general result was that about one-fifth of Indiana was classified in moderate drought, a third as abnormally dry, and a little less than half the state in normal soil moisture status for this time of year. There was no change in county open burn ban status from the week prior. Benton, Henry, and Vanderburgh counties continued with burn bans first declared on October 23 rd and 24 th. The November 8 th edition of the USDA Indiana crop bulletin stated that soybean harvest in Indiana was now complete. Only scattered fields of corn remained to be harvested for the 2015 crop year. Winter wheat continued to make good progress and some grazing of livestock in pastures continued. November 8 th 14 th The week began and ended cooler than normal but warm temperatures prevailed in mid-week. Rainfall was about half the normal amount in two main weather events. There was no change in the US Drought Monitor this week in Indiana. Commercial corn harvest finally wrapped up to close out the 2015 growing season. The core of a massive high pressure center that dominated the eastern half of the country was centered over Indiana on November 8 th, allowing for sunny skies and gentle winds. The state temperature began a bit on the cool side at 2 F below normal. The next day the high center slid east to New Jersey and allowed a storm to spill precipitation in southeast states. Indiana remained sunny and dry. The temperature dipped slightly to 3 F below normal, the coldest day of the week. The southeast storm rode up the Atlantic coast on November 10 th and spun off a parallel trough in Ohio, triggering the first main rain event in eastern Indiana counties. High pressure filled the Gulf states behind the departing trough. Warmer air pumped northward by the Gulf high center lifted the Indiana temperature to 1 F above normal. The next day the state temperature ascended to 7 F above normal, the warmest day of the week, as the high pressure core moved closer into Kentucky.
4 Fronts surrounded a warm dome of air controlled by this ridge sprawled over the east half of the country. The ridge collapsed on November 12 th and scampered quickly to the Atlantic. Multiple storm centers in the Kansas area combined into one strong system over Wisconsin whose cold front whipped across Indiana and generated the week s second main rain event. Temperatures fell slowly at first to 6 F above normal. The cold front outran the storm center the next day by racing far offshore into the Atlantic while the storm center lagged behind in Quebec. A new high pressure ridge took over the Great Plains and began tapping into cooler Canadian air. The Indiana state temperature edged lower to 3 F above normal. On November 14 th the Great Plains ridge slid east to Tennessee, clearing Indiana skies and dropping temperatures to end the week at 1 F below normal. Overall the cool start and end to the week tempered the warm middle. The weekly state temperature averaged to 2 F above normal. Usually in the second week of November daily maximum temperatures should range between 51 F and 59 F north to south across the state. Daily minimums normally vary between 35 F in far northern Indiana to 38 F in the southwest corner of the state. The warmest maximum temperature for the week among cooperative network stations was 71 F at Cannelton on November 14 th. The coolest minimum in this same network was 21 F at Martinsville and Shakamak State Park that same day. A typical precipitation pattern at this time of year has heavier rainfall amounts near the Ohio River with lighter amounts trending northward. This week the trend was as much west and east. Generally more than a half inch of rain was found east of a line running from Tell city to Jasper, then to Nashville to Indianapolis before ending near Auburn. The heaviest amounts exceeding an inch were summed mostly in Clark, Floyd, Washington and Harrison counties with scattered small pockets in east central Indiana. Lighter amounts of less than a half inch were located in the west half of Indiana except heavier along the state line in Benton and Newton counties. The largest single day amounts in the CoCoRaHS network were recorded during the passage of the trough on the morning of November 10 th. These amounts included 1.07 at Galena, 1.06 outside Portland, 1.05 in New Salem, and 1.03 on the edge of Winchester. The greatest weekly sums were tallied as 1.48 near Galena, 1.38 in Floyds Knobs and outside New Castle, 1.36 at New Salisbury, and 1.27 in New Salem. Regionally about 0.4 of rain accumulated on average in northern and central Indiana and 0.5 in the south. These amounts equate to about 50% of normal in the northern and southern thirds of Indiana and to 40% in the central parts of the state. There was no change in the drought status of Indiana for the week ending November 17 th according to the US Drought Monitor. The heaviest rainfall this week was noted in the eastern half of Indiana. The D1 moderate drought region was located in the western half of the state and did not take advantage of the new moisture. The category coverage numbers remained the same: 21% of Indiana was in D1 moderate drought, 33% rated as D0 abnormally dry, and 46% of the state was in normal soil moisture status for this time of year.
5 No additional counties declared open burn bans this week. The three existing burn bans were allowed to stand in Benton, Henry, and Vanderburgh counties. The November 16 th edition of the USDA Indiana crop bulletin reported that commercial corn harvesting in Indiana has completed. No further updates from the crop bulletin will be necessary in this weather summary to the end of November 15 th 21 st The first snowfall of the season was significant, dumping several inches across northern Indiana. As the week ended November 21 st light snowfall continued into the next day in northeast Indiana. State temperatures had peaked on November 18 th then fell below normal in the wake of a very strong storm centered over Hudson Bay. Precipitation was recorded nearly every day this week. The heaviest moisture was wrung out during two mid-week fronts. Slick roads and power outages plagued far northern counties during the late week snowstorm. Indiana skies were sunny and temperatures pleasant on November 15 th and 16 th with high pressure overhead. The state average temperature stood at 5 F to 6 F above normal. On November 17 th the high center slid east to North Carolina, allowing a mature storm in Kansas to push rainfall into Indiana ahead of its cold front, also linked to a second storm in Canada. The Indiana state temperature rose to 10 F above normal. The next day the two storms almost merged. An occluded front from the northern storm reached Illinois while a cold front from the southern storm was close behind in Missouri. The state temperature peaked at 13 F above normal. On November 19 th the two storms finally merged into a powerful single storm just south of Hudson Bay. The occluded front had moved through Indiana the previous night and the trailing cold front roared through early in the morning. Colder air surged into the state behind the fronts and dropped the state temperature to 3 F above normal. On November 20 th the fronts joined and raced east into the Atlantic Ocean. High pressure took over the state as cold air poured in. The state temperature fell to 4 F below normal.
6 Meanwhile another storm had developed over Wyoming. By November 21 st this storm had entered Missouri. Moisture overran its stationary front in Kentucky into air near freezing over northern Indiana. The rain quickly turned into snow early that day and began to pile up in northern counties. The state temperature dipped only slightly to 5 F below normal to end the week. Overall for the week the state temperature averaged to 4 F above normal. Typically for the third week of November the daily maximum temperature should trend from about 47 F in far northern counties to 55 F in the southwest corner of the state. The daily minimum normally varies between 32 F and 36 F north to south across the state. The warmest maximum temperature of the week among cooperative network stations was 72 F at Martinsville 2sw on November 19 th. The coolest minimum in this same network was 20 F at Franklin wwtp on November 16 th. Most of the rain this week fell during the passage of the occluded and cold fronts in mid-week. Snow fell in northern Indiana on the last day while rain fell across the south. Regionally about 0.5 of precipitation fell on average across the north, 0.9 in central counties, and 1.8 in southern Indiana. These amounts equate to about 90% of normal in the northern third of Indiana, 130% of normal in central, and 200% of normal across the southern part of the state. The highest single day precipitation in the CoCoRaHS network was recorded in the morning report of November 19 th and included 2.31 at Corydon, 2.20 near New Albany, 2.03 at New Salisbury, 2.02 outside New Pekin, and 2.01 near Galena. For the week the greatest total precipitation in this network had 2.83 at Poseyville, 2.63 near New Pekin, 2.60 in the Evansville vicinity, 2.54 at Hazleton, and 2.41 near Galena. The pattern of precipitation formed a V-shape on this week s map. Less than 0.5 occurred generally east of I-65 between Lake and Johnson counties then north of a Franklin to Portland line. In contrast more than 2 was generally found west of a line from Vincennes to east of Hazleton to Newburgh and in a pocket region inside Floyd and Harrison counties. Snow began just before dawn and continued much of the day on November 21 st. Only amounts received before mid-morning are included in the CoCoRaHS weekly snowfall map below. The rest of the day will be tallied in the November 22 nd report. Locally heavy early morning snowfall up to 4 was noted in Pulaski county. Lighter amounts, mostly under an inch, fell generally northwest of a Kentland to South Bend line with very little snow to mid-morning elsewhere across the state. The snowfall during November 21 st with falling temperatures caused icy roads and power outages in Lake county. The outages were caused by branches sagging under the weight of heavy snow. The cities of Merrillville and Michigan City seemed especially hard hit by power outages. Slide offs and spin outs of vehicles traveling I-80/94 and I-65 in northwest Indiana began that afternoon. The Toll Road was affected later on. Lake effect snow continued in Laporte county late into November 21 st and continued to cause travel problems into the next day. The November 24 th edition of the US Drought Monitor made only minor changes to Indiana s soil moisture status. Abnormally dry D0 category conditions were removed along the Wabash River in western Posey county. This change did not impact the coverage numbers which remained at 21% of Indiana rated in the D1 moderate drought category, 33% in D0 abnormally dry status, and 46% in normal soil moisture status.
7 There were no changes in open burn ban declarations in Indiana. Three counties: Benton, Henry, and Vanderburgh, continued with an open burn ban until further notice. November 22 nd 30 th In the upper atmosphere an intense low pressure system formed over the southwest states during the final days of November. In the first 5 days of this interval the Indiana state temperature soared 28 F as this southwest system kicked very warm air into the Midwest, providing a delightful Thanksgiving Day. A slow cold front finished off the month with cooler wet weather. Unlike the start of the 9 day interval when snow fell in northern Indiana, precipitation fell as rain in the final few days. The precipitation did little to improve the drought situation in southwest Indiana. Snow was falling across northern Indiana on November 22 nd. The state average temperature was unusually cold that day at 14 F below normal. This was the first and coldest of the 9 days. An intense warmup was set to erupt. High pressure over Texas slid east to Mississippi on November23 rd. Warm air on the backside of this system helped lift the Indiana state temperature to 9 F below normal. A warm front finally passed through the state allowing the state average temperature to reach normal. A weakening cold front that had crossed Indiana dissolved on November 24 th. High pressure positioned off the Maine shore kept the warm air coming for two more days, lifting Indiana temperatures to 4 F, then 11 F above normal. By early November 27 th several low pressure centers rode atop a strong cold front in Illinois. Indiana remained barely within the sector of warm air. The state temperature peaked at 14 F above normal as heavy rain began to fall. The cold front crawled through Indiana on November 28 th, greatly slowed by the low centers riding northward up the front. The state temperature dropped sharply to 4 F above normal. The cold front nudged south into Kentucky the next day. The Indiana temperature dipped to 3 F above normal but then stabilized. On the last day of November the cold front reached the southeast states. Precipitation ended over Indiana. The state temperature closed the month at 4 F above normal.
8 Over the 9 day interval the state temperature averaged to 2 F above normal. Usually at the end of November the daily maximum temperature is expected to range between 43 F and 51 F north to south across the state. The daily minimum normally varies between 29 F in far northern Indiana to 33 F in the southwest corner of the state. The warmest maximum temperature among cooperative network stations in the 9 day interval was 70 F at Boonville 1s, Evansville Airport, and Newburgh Dam on November 26 th. The coolest minimum in this same network was 2 F at Lowell on November 22 nd. The first snowfall of the season began on November 21 st and continued overnight into November 22 nd. No snow fell the rest of the month. As shown on the snow map below, north and central Indiana generally north of a line from Terre Haute to Bloomington to Winchester, received snow while rain fell to the south. More than 4 fell mostly north of a Lowell to Peru to Auburn line with heavy snow of 8 or more in St Joseph, Marshall, and Lagrange counties. Among stations in the CoCoRaHS network two South Bend locations measured 9.0 and 8.2 of new snow that morning. A few miles north of Angola, 8.5 was recorded while a Hudson volunteer noted 8.2, Lagrange had 8.0, and Demotte collected 7.8. Precipitation includes rainfall and the melted equivalent of snowfall. For the 9 day interval Rensselaer tallied 2.63, Carmel had 2.40, a Bloomfield observer summed 2.34, Crown Point had 2.34, and Whitestown noted Regionally about 1.4 of precipitation fell across northern Indiana and 1.5 in central and southern Indiana. These amounts equate to about 140% of normal in the north, 130% of normal in central areas of the state, and 110% of normal across the south. While snowfall exhibited the more typical north to south pattern, the precipitation pattern over the 9 day interval trended west to east. The western half of Indiana generally received more than 1.5 of precipitation while the east half received lesser amounts. The heaviest precipitation fell mostly along a Terre Haute to Spencer line which noted more than 2.5 of precipitation over the interval. There was only a slight change in Indiana drought status this week according to the December 1 st edition of the US Drought Monitor. The southern half of Vermillion and Knox counties improved from D1 moderate drought status to D0 abnormally dry. The abnormally dry rating in the northwest corner of Knox county was restored to normal soil moisture status. With these changes the total moderate drought area coverage in Indiana improved by 2% to about 33% of total land area. Overall there was a very slight half percent gain in total area rated in normal soil moisture status at the conclusion of November. There was no change in open burn ban status. At the end of November counties with open burn bans still in effect were Benton, Henry, and Vanderburgh. This will be the last statement on open burn ban status in Indiana until some change is noted.
9
10 November 2015 Temperature Region Temperature Normal Deviation Northwest North Central Northeast West Central Central East Central Southwest South Central Southeast State Precipitation Region Precipitation Normal Deviation Percent of Normal Northwest North Central Northeast West Central Central East Central Southwest South Central Southeast State
11 Autumn (September - November) Temperature Region Temperature Normal Deviation Northwest North Central Northeast West Central Central East Central Southwest South Central Southeast State Precipitation Region Precipitation Normal Deviation Percent of Normal Northwest North Central Northeast West Central Central East Central Southwest South Central Southeast State
12 2015 Annual (through November) Temperature Region Temperature Normal Deviation Northwest North Central Northeast West Central Central East Central Southwest South Central Southeast State Precipitation Region Precipitation Normal Deviation Percent of Normal Northwest North Central Northeast West Central Central East Central Southwest South Central Southeast State
13
14
15
16

17 Drought Summary from the U.S. Drought Monitor Below is a drought summary for the state of Indiana from the U.S. Drought Monitor. Areas in white are not experiencing any drought. Yellow areas are abnormally dry, but not considered a drought. Drought begins when the moisture levels become more severe, with beige, orange, red, and brown indicating increasing levels of drought (moderate, severe, extreme, and exceptional, respectively). The table below indicates what percentage of the state is drought free, and how much of the state is in drought by degree of severity (D1 - D4 category).
18 November 3 rd Drought Summary
19 November 10 th Drought Summary

20 November 17 th Drought Summary
21 November 24 th Drought Summary
22 December 1 st Drought Summary
October 2011 Climate Summary
 Ken Scheeringa and Kayla Hudson Nov 4, 2011 http://www.iclimate.org October 2011 Climate Summary Month Summary October weather evolved as a two part story. Weather conditions the first half of the month
November 2012 Climate Summary
 Ken Scheeringa and Kayla Hudson Dec 6, 2012 (765) 494-8105 http://www.iclimate.org November 2012 Climate Summary Month Summary November was one of those rare weather months in Indiana when not much happened:
December 2011 Climate Summary
 Ken Scheeringa and Kayla Hudson Jan 17, 2012 (765) 494-8105 http://www.iclimate.org December 2011 Climate Summary Month Summary What a difference a year makes! A year ago the misery of a harsh, cold, and
January 2008 Climate Summary
 Joseph Mays (765) 494-6574 Feb 5, 2008 http://www.iclimate.org Summary January 2008 Climate Summary January was a mix bag of conditions, with an oscillatory pattern developing. We experienced phases of
August 2017 Climate Summary
 Ken Scheeringa And Andy Eggert Sep 7, 2017 (765) 494-8105 http://www.iclimate.org August 2017 Climate Summary Month Summary The coolest August in 13 years featured long cool and warm spells, below normal
January 2006 Climate Summary
 Ashley Brooks (765) 494-6574 Feb 9, 2006 http://www.iclimate.org January 1-3 January 2006 Climate Summary Unseasonably warm conditions welcomed in the New Year with highs in the 40s across the northern
August 2013 Climate Summary
 Ken Scheeringa and Matt Price Sep 6, 2013 (765) 494-8105 http://www.iclimate.org August 2013 Climate Summary Month Summary August weather began cool and wet but became progressively warmer and drier through
July 2007 Climate Summary
 Dan Bowman (765) 494-6574 Sep 3, 2007 http://www.iclimate.org Summary July 2007 Climate Summary The month of July ended as a very unusual month. Many events occurred during the month of July that is not
September 2016 Climate Summary
 Ken Scheeringa And Andy Eggert Oct 6, 2016 (765) 494-8105 http://www.iclimate.org September 2016 Climate Summary Month Summary The warmest September in 77 years brought alternating weeks of dry and wet
November 2014 Climate Summary
 Ken Scheeringa And Matt Price Dec 10, 2014 (765) 494-8105 http://www.iclimate.org November 2014 Climate Summary Month Summary Unseasonable cold headlined the Indiana and national news in November. The
March 2014 Climate Summary
 Ken Scheeringa And Matt Price Apr 8, 2014 (765) 494-8105 http://www.iclimate.org March 2014 Climate Summary Month Summary Winter had officially ended by the calendar but snow and cold persisted in Indiana
October 2012 Climate Summary
 Ken Scheeringa and Kayla Hudson Nov 8, 2012 (765) 494-8105 http://www.iclimate.org October 2012 Climate Summary Month Summary In a reversal from the hot and dry summer, cooler and wetter than normal conditions
March 2018 Climate Summary
 Ken Scheeringa and Andy Eggert Apr 5, 2018 (765) 494-8105 http://www.iclimate.org March 2018 Climate Summary Month Summary March turned cold with below normal temperatures on two-thirds of its days. Along
October 2017 Climate Summary
 Ken Scheeringa and Andy Eggert Nov 6, 2017 (765) 494-8105 http://www.iclimate.org October 2017 Climate Summary Month Summary After more than three weeks of warm temperatures October turned suddenly cold
August 2006 Summary. August 1-5
 Ashley Brooks (765) 494-6574 Sep 8, 2006 http://www.iclimate.org August 1-5 August 2006 Summary The heat wave that started during the end of July continued into the beginning parts of August with temperatures
October 2014 Climate Summary
 Ken Scheeringa And Matt Price Nov 10, 2014 (765) 494-8105 http://www.iclimate.org October 2014 Climate Summary Month Summary October featured a mix of weather. A very wet first half of the month evolved
November 2010 Climate Summary
 Ken Scheeringa (765) 494-8105 Dec 6, 2010 http://www.iclimate.org November 2010 Climate Summary Summary A four month drought in Indiana is collapsing as significant rain fell the final week of November.
October 2016 Climate Summary
 Ken Scheeringa And Andy Eggert Nov 9, 2016 (765) 494-8105 http://www.iclimate.org October 2016 Climate Summary Month Summary October was the 9 th month so far this year to average above normal in temperature.
September 2011 Climate Summary
 Ken Scheeringa and Kayla Hudson Oct 5, 2011 (765) 494-8105 http://www.iclimate.org September 2011 Climate Summary Month Summary The final blast of summer heat arrived at the start of September. It lasted
January 2017 Climate Summary
 Ken Scheeringa And Andy Eggert Feb 8, 2017 (765) 494-8105 http://www.iclimate.org January 2017 Climate Summary Month Summary The warmest January in 11 years was nearly 4 F warmer than December 2016. An
February 2016 Climate Summary
 Ken Scheeringa And Andy Eggert Mar 9, 2016 (765) 494-8105 http://www.iclimate.org February 2016 Climate Summary Month Summary February was the 6 th consecutive month with an above normal state average
February 2017 Climate Summary
 Ken Scheeringa And Andy Eggert Mar 9, 2017 (765) 494-8105 http://www.iclimate.org February 2017 Climate Summary Month Summary February 2017 was the warmest February in Indiana since state climate records
April 2015 Climate Summary
 Ken Scheeringa And Mary Rose Mangan May 8, 2015 http://www iclimate org April 2015 Climate Summary Month Summary April was a month of extremes. Severe weather erupted on 4 days of the first week with multiple
The hydrologic service area (HSA) for this office covers Central Kentucky and South Central Indiana.
 for this office covers Central Kentucky and South Central Indiana.") January 2012 February 13, 2012 An X inside this box indicates that no flooding occurred within this hydrologic service area. January 2012 continued the string of wet months this winter. Rainfall was generally
January 2012 February 13, 2012 An X inside this box indicates that no flooding occurred within this hydrologic service area. January 2012 continued the string of wet months this winter. Rainfall was generally
November 2016 Climate Summary
 Ken Scheeringa And Andy Eggert Dec 15, 2016 (765) 494-8105 http://www.iclimate.org November 2016 Climate Summary Month Summary Unseasonably warm, pleasant, and sunny weather the first half of the month
August 2015 Climate Summary
 Ken Scheeringa And Mary Rose Mangan Sep 4, 2015 (765) 494-8105 http://www.iclimate.org August 2015 Climate Summary Month Summary A very active wet summer weather pattern turned much calmer and drier in
March 2016 Climate Summary
 Ken Scheeringa And Andy Eggert Apr 8, 2016 (765) 494-8105 http://www.iclimate.org March 2016 Climate Summary Month Summary Count March as the 7 th month in a row that the state average temperature has
May 2016 Climate Summary
 Ken Scheeringa And Andy Eggert Jun 6, 2016 (765) 494-8105 http://www.iclimate.org May 2016 Climate Summary Month Summary Cold weather dominated in May until the last week of the month. May began wet but
January 2018 Climate Summary
 Ken Scheeringa and Andy Eggert Feb 8, 2018 (765) 494-8105 http://www.iclimate.org January 2018 Climate Summary Month Summary January temperature swings were amazing. In the first few days arctic cold pushed
September 2005 Climate Summary
 Ashley Brooks (765) 494-6574 Oct 5, 2005 http://iclimate.org September 2005 Climate Summary September 1-7 A cold front came through on the 1 st of the month, however little moisture was associated with
NWS FORM E-5 U.S. DEPARTMENT OF COMMERCE I HYDRO SERVICE AREA NOAA, NATIONAL WEATHER SERVICE I Indianapolis, IN MONTHLY REPORT
 NWS FORM E-5 U.S. DEPARTMENT OF COMMERCE I HYDRO SERVICE AREA NOAA, NATIONAL WEATHER SERVICE I Indianapolis, IN. 1-------------------- MONTHLY REPORT OF RIVER AND FLOOD CONDITIONSI REPORT FOR I November
September 2012 Climate Summary
 Ken Scheeringa and Kayla Hudson Oct 5, 2012 (765) 494-8105 http://www.iclimate.org September 2012 Climate Summary Month Summary Summer slipped away and it felt a lot more like autumn in Indiana this month
May 2005 Climate Summary
 Ashley Brooks (765) 494-6574 Jun 7, 2005 http://iclimate.org May 2005 Climate Summary May 1-5 Early May was characterized by an upper-level trough that was in place over Indiana that brought in very cool
May 2018 Climate Summary
 Ken Scheeringa and Andy Eggert Jun 7, 2018 (765) 494-8105 http://www.iclimate.org May 2018 Climate Summary Month Summary As the calendar turned from April to May temperatures flipped dramatically away
April 2016 Climate Summary
 Ken Scheeringa And Andy Eggert May 9, 2016 (765) 494-8105 http://www.iclimate.org April 2016 Climate Summary Month Summary One month but two seasons. The first half of April was cold with snow. Wind damage
Weather and Climate Summary and Forecast October 2017 Report
 Weather and Climate Summary and Forecast October 2017 Report Gregory V. Jones Linfield College October 4, 2017 Summary: Typical variability in September temperatures with the onset of fall conditions evident
2011 Year in Review TORNADOES
 2011 Year in Review The year 2011 had weather events that will be remembered for a long time. Two significant tornado outbreaks in April, widespread damage and power outages from Hurricane Irene in August
Weather and Climate Summary and Forecast Summer 2017
 Weather and Climate Summary and Forecast Summer 2017 Gregory V. Jones Southern Oregon University August 4, 2017 July largely held true to forecast, although it ended with the start of one of the most extreme
Monthly Long Range Weather Commentary Issued: APRIL 18, 2017 Steven A. Root, CCM, Chief Analytics Officer, Sr. VP,
 Monthly Long Range Weather Commentary Issued: APRIL 18, 2017 Steven A. Root, CCM, Chief Analytics Officer, Sr. VP, sroot@weatherbank.com MARCH 2017 Climate Highlights The Month in Review The average contiguous
Weather and Climate Summary and Forecast November 2017 Report
 Weather and Climate Summary and Forecast November 2017 Report Gregory V. Jones Linfield College November 7, 2017 Summary: October was relatively cool and wet north, while warm and very dry south. Dry conditions
The Pennsylvania Observer
 The Pennsylvania Observer October 1, 2015 September 2015 - Pennsylvania Weather Recap By: Quinn Lease The month of September will be remembered for its above normal temperatures and dry conditions that
Monthly Long Range Weather Commentary Issued: July 18, 2014 Steven A. Root, CCM, President/CEO
 Monthly Long Range Weather Commentary Issued: July 18, 2014 Steven A. Root, CCM, President/CEO sroot@weatherbank.com JUNE 2014 REVIEW Climate Highlights The Month in Review The average temperature for
Summary of November Central U.S. Winter Storm By Christopher Hedge
 Summary of November 12-13 2010 Central U.S. Winter Storm By Christopher Hedge Event Overview The first significant snowfall of the 2010-2011 season affected portions of the plains and upper Mississippi
NATIONAL WEATHER SERVICE
 January 2016 February 9, 2016 This was a dry month across the HSA despite one large and several smaller snowfalls. Most locations ended up 1-2 inches below normal for the month. The driest locations at
Monthly Long Range Weather Commentary Issued: May 15, 2014 Steven A. Root, CCM, President/CEO
 Monthly Long Range Weather Commentary Issued: May 15, 2014 Steven A. Root, CCM, President/CEO sroot@weatherbank.com APRIL 2014 REVIEW Climate Highlights The Month in Review The average temperature for
WeatherManager Weekly
 Issue 288 July 14, 2016 WeatherManager Weekly Industries We Serve Agriculture Energy/Utilities Construction Transportation Retail Our Weather Protection Products Standard Temperature Products Lowest Daily
The Pennsylvania Observer
 The Pennsylvania Observer April 2, 2009 March 2009 Pennsylvania Weather Recap Prepared by Curt Harpster For the month of March the saying, In like a lion and out like a lamb really fit the pattern quite
April 2017 Climate Summary
 Ken Scheeringa And Andy Eggert May 8, 2017 (765) 494-8105 http://www.iclimate.org April 2017 Climate Summary Month Summary April was a very warm and wet month in Indiana, nearly setting a new monthly temperature
The Pennsylvania Observer
 The Pennsylvania Observer April 2, 2010 March 2010 Pennsylvania Weather Recap Prepared by: Katelyn Johnson March did come in as a lion cub this year. The 1 st proved to be a calm day; however most of Pennsylvania
Monthly Long Range Weather Commentary Issued: SEPTEMBER 19, 2016 Steven A. Root, CCM, Chief Analytics Officer, Sr. VP,
 Monthly Long Range Weather Commentary Issued: SEPTEMBER 19, 2016 Steven A. Root, CCM, Chief Analytics Officer, Sr. VP, sroot@weatherbank.com SEPTEMBER 2016 Climate Highlights The Month in Review The contiguous
Crop / Weather Update
 Crop / Weather Update Corn Crop Condition Percent of Acreage Rated Good or Excellent 85 80 75 70 65 60 55 50 45 The U.S. corn crop was rated 69% good-to-excellent on September 23, up 1% from week-ago,
2012 Growing Season Weather Summary for North Dakota. Adnan Akyüz and Barbara A. Mullins Department of Soil Science October 30, 2012
 2012 Growing Season Weather Summary for North Dakota Adnan Akyüz and Barbara A. Mullins Department of Soil Science October 30, 2012 Introduction The 2012 growing season (the period from April through September)
L.O Students will learn about factors that influences the environment
 Name L.O Students will learn about factors that influences the environment Date 1. At the present time, glaciers occur mostly in areas of A) high latitude or high altitude B) low latitude or low altitude
The Pennsylvania Observer
 The Pennsylvania Observer January 5, 2009 December 2008 Pennsylvania Weather Recap The final month of 2008 was much wetter than average and a bit colder than normal. In spite of this combination, most
Monthly Long Range Weather Commentary Issued: APRIL 1, 2015 Steven A. Root, CCM, President/CEO
 Monthly Long Range Weather Commentary Issued: APRIL 1, 2015 Steven A. Root, CCM, President/CEO sroot@weatherbank.com FEBRUARY 2015 Climate Highlights The Month in Review The February contiguous U.S. temperature
Climate. Annual Temperature (Last 30 Years) January Temperature. July Temperature. Average Precipitation (Last 30 Years)
 January Temperature. July Temperature. Average Precipitation (Last 30 Years)") Climate Annual Temperature (Last 30 Years) Average Annual High Temp. (F)70, (C)21 Average Annual Low Temp. (F)43, (C)6 January Temperature Average January High Temp. (F)48, (C)9 Average January Low Temp.
Climate Annual Temperature (Last 30 Years) Average Annual High Temp. (F)70, (C)21 Average Annual Low Temp. (F)43, (C)6 January Temperature Average January High Temp. (F)48, (C)9 Average January Low Temp.
Champaign-Urbana 1999 Annual Weather Summary
 Champaign-Urbana 1999 Annual Weather Summary ILLINOIS STATE WATER SURVEY 2204 Griffith Dr. Champaign, IL 61820 wxobsrvr@sws.uiuc.edu Maria Peters, Weather Observer A major snowstorm kicked off the new
National Wildland Significant Fire Potential Outlook
 National Wildland Significant Fire Potential Outlook National Interagency Fire Center Predictive Services Issued: September, 2007 Wildland Fire Outlook September through December 2007 Significant fire
Weather and Climate Summary and Forecast March 2018 Report
 Weather and Climate Summary and Forecast March 2018 Report Gregory V. Jones Linfield College March 7, 2018 Summary: The ridge pattern that brought drier and warmer conditions from December through most
June 2016 Climate Summary
 Ken Scheeringa And Andy Eggert Jul 8, 2016 (765) 494-8105 http://www.iclimate.org June 2016 Climate Summary Month Summary June was a warm month with below normal temperature on just 6 days. Rainfall was
Monthly Long Range Weather Commentary Issued: NOVEMBER 16, 2015 Steven A. Root, CCM, Chief Analytics Officer, Sr. VP, sales
 Monthly Long Range Weather Commentary Issued: NOVEMBER 16, 2015 Steven A. Root, CCM, Chief Analytics Officer, Sr. VP, sales sroot@weatherbank.com OCTOBER 2015 Climate Highlights The Month in Review The
Air Masses, Fronts, Storm Systems, and the Jet Stream
 Air Masses, Fronts, Storm Systems, and the Jet Stream Air Masses When a large bubble of air remains over a specific area of Earth long enough to take on the temperature and humidity characteristics of
UNITED STATES AND SOUTH AMERICA OUTLOOK (FULL REPORT) Thursday, December 28, 2017
 Thursday, December 28, 2017") T-storm Weather Summary Despite scattered t-storms Sat.-Sun. in central and northern areas in Argentina, more will likely be needed especially in sunflower areas of the southwest. Some t-storms likely
T-storm Weather Summary Despite scattered t-storms Sat.-Sun. in central and northern areas in Argentina, more will likely be needed especially in sunflower areas of the southwest. Some t-storms likely
Weather and Climate Summary and Forecast December 2017 Report
 Weather and Climate Summary and Forecast December 2017 Report Gregory V. Jones Linfield College December 5, 2017 Summary: November was relatively cool and wet from central California throughout most of
UNITED STATES AND SOUTH AMERICA OUTLOOK (FULL REPORT) Wednesday, April 18, 2018
 Wednesday, April 18, 2018") T-storm Weather Summary Coolness continues over the next week in much of the central U.S., most likely producing the coldest April since 1907 in the Corn Belt, but followed by seasonable to mild weather
T-storm Weather Summary Coolness continues over the next week in much of the central U.S., most likely producing the coldest April since 1907 in the Corn Belt, but followed by seasonable to mild weather
May 2015 Climate Summary
 Ken Scheeringa And Mary Rose Mangan Jun 8, 2015 (765) 494-8105 http://www.iclimate.org May 2015 Climate Summary Month Summary May was a very warm month. Rainfall averaged near normal but was distributed
Weather and Climate Summary and Forecast August 2018 Report
 Weather and Climate Summary and Forecast August 2018 Report Gregory V. Jones Linfield College August 5, 2018 Summary: July 2018 will likely go down as one of the top five warmest July s on record for many
NWS FORM E-5 U.S. DEPARTMENT OF COMMERCE HSA OFFICE:
 NWS FORM E-5 U.S. DEPARTMENT OF COMMERCE HSA OFFICE: NOAA, NATIONAL WEATHER SERVICE MONTHLY REPORT OF RIVER AND FLOOD CONDITIONS DATE: TO: North Webster, IN REPORT FOR (MONTH &YEAR): July 1998 August 5,
Monthly Long Range Weather Commentary Issued: February 15, 2015 Steven A. Root, CCM, President/CEO
 Monthly Long Range Weather Commentary Issued: February 15, 2015 Steven A. Root, CCM, President/CEO sroot@weatherbank.com JANUARY 2015 Climate Highlights The Month in Review During January, the average
KANSAS CLIMATE SUMMARY February 2015
 KANSAS CLIMATE SUMMARY February 2015 Extended Cold Despite some record warm readings at a few locations, February was characterized by colder than normal conditions. This was particularly true during the
CropCast Corn and Soybean Report Kenny Miller Tuesday, March 14, 2017
 Accumulated Rainfall (inches) Accumulated GDDs Temperature ( F)/Wind Speed (mph) Precipitation (inches) CropCast Corn and Soybean Report Kenny Miller Tuesday, March 14, 2017 Peoria, IL Regional Forecast
Crop / Weather Update
 Crop / Weather Update Corn Crop Condition Percent of Acreage Rated Good or Excellent 85 80 75 70 65 60 55 50 45 Corn condition this week is the same as the last two weeks in the good/excellent category,
January 25, Summary
 January 25, 2013 Summary Precipitation since the December 17, 2012, Drought Update has been slightly below average in parts of central and northern Illinois and above average in southern Illinois. Soil
Illinois Drought Update, December 1, 2005 DROUGHT RESPONSE TASK FORCE Illinois State Water Survey, Department of Natural Resources
 Illinois Drought Update, December 1, 2005 DROUGHT RESPONSE TASK FORCE Illinois State Water Survey, Department of Natural Resources For more drought information please go to http://www.sws.uiuc.edu/. SUMMARY.
SEPTEMBER 2013 REVIEW
 Monthly Long Range Weather Commentary Issued: October 21, 2013 Steven A. Root, CCM, President/CEO sroot@weatherbank.com SEPTEMBER 2013 REVIEW Climate Highlights The Month in Review The average temperature
Champaign-Urbana 1998 Annual Weather Summary
 Champaign-Urbana 1998 Annual Weather Summary ILLINOIS STATE WATER SURVEY Audrey Bryan, Weather Observer 2204 Griffith Dr. Champaign, IL 61820 wxobsrvr@sparc.sws.uiuc.edu The development of the El Nìno
April 2013 Climate Summary
 Ken Scheeringa and Kayla Hudson May 6, 2013 (765) 494-8105 http://www.iclimate.org April 2013 Climate Summary Month Summary Temperatures bounced high and low this month, keeping Hoosiers guessing which
1. Which weather map symbol is associated with extremely low air pressure? A) B) C) D) 2. The diagram below represents a weather instrument.
 B) C) D) 2. The diagram below represents a weather instrument.") 1. Which weather map symbol is associated with extremely low air pressure? 2. The diagram below represents a weather instrument. Which weather variable was this instrument designed to measure? A) air pressure
1. Which weather map symbol is associated with extremely low air pressure? 2. The diagram below represents a weather instrument. Which weather variable was this instrument designed to measure? A) air pressure
Crop / Weather Update
 Crop / Weather Update Corn Crop Condition Percent of Acreage Rated Good or Excellent 85 80 75 70 65 60 55 50 45 As of September 9, USDA rates the crop at 68% good to excellent. The rating is up one point
Crop / Weather Update
 Crop / Weather Update The next will be published November 13, 2018, due to the Veteran s Day holiday on Monday. Corn Harvesting Progress 100% 90% 80% 70% 60% 50% 40% 30% 20% 10% 0% 9/9 9/16 9/23 9/30 10/7
2018 Year in Review for Central and Southeast Illinois By: Chris Geelhart, Meteorologist National Weather Service, Lincoln IL
 By: Chris Geelhart, Meteorologist National Weather Service, Lincoln IL While 2018 featured some significant out-of-season weather, including below zero temperatures in April and 90-degree highs in early
CropCast Corn and Soybean Report Kyle Tapley Monday, March 20, 2017
 Accumulated Rainfall (inches) Accumulated GDDs Temperature ( F)/Wind Speed (mph) Precipitation (inches) CropCast Corn and Soybean Report Kyle Tapley Monday, March 20, 2017 Peoria, IL Regional Forecast
Weather and Climate Summary and Forecast Fall/Winter 2016
 Weather and Climate Summary and Forecast Fall/Winter 2016 Gregory V. Jones Southern Oregon University November 5, 2016 After a year where we were seemingly off by a month in terms of temperatures (March
March 2009 Climate Summary
 Joseph Mays (765) 494-6574 Apr 1, 2009 http://www.iclimate.org Summary March 2009 Climate Summary March is in the books and it continued the trend of extreme weather we have experienced during the first
Weather and Climate Risks and Effects on Agriculture
 Weather and Climate Risks and Effects on Agriculture Dr. Eric Snodgrass Official Journal of the Fluid Fertilizer Foundation Vol. 26, No. 2, Issue #100 DOWNLOAD Summary: So, what do we need to watch for?
May 2016 Volume 23 Number 5
 The Weather Wire May 2016 Volume 23 Number 5 Contents: Winter Summary Current Colorado and West-wide Snow Pack Drought Monitor April Summary/Statistics May Preview Snowfall Totals Winter Summary The Front
Weather and Climate Summary and Forecast October 2018 Report
 Weather and Climate Summary and Forecast October 2018 Report Gregory V. Jones Linfield College October 4, 2018 Summary: Much of Washington, Oregon, coastal California and the Bay Area and delta region
Weather and Climate Summary and Forecast February 2018 Report
 Weather and Climate Summary and Forecast February 2018 Report Gregory V. Jones Linfield College February 5, 2018 Summary: For the majority of the month of January the persistent ridge of high pressure
Impacts of the April 2013 Mean trough over central North America
 Impacts of the April 2013 Mean trough over central North America By Richard H. Grumm National Weather Service State College, PA Abstract: The mean 500 hpa flow over North America featured a trough over
J8.4 TRENDS OF U.S. SNOWFALL AND SNOW COVER IN A WARMING WORLD,
 J8.4 TRENDS OF U.S. SNOWFALL AND SNOW COVER IN A WARMING WORLD, 1948-2008 Richard R. Heim Jr. * NOAA National Climatic Data Center, Asheville, North Carolina 1. Introduction The Intergovernmental Panel
January 2013 Climate Summary
 Ken Scheeringa and Kayla Hudson Feb 7, 2013 (765) 494-8105 http://www.iclimate.org January 2013 Climate Summary Month Summary Winter or spring? January featured several dramatic swings in temperature and
NATIONAL WEATHER SERVICE
 NWS Form E-5 (PRES. BY NWS Instruction 10-924) MONTHLY REPORT OF HYDROLOGIC CONDITIONS HYDROLOGIC SERVICE AREA (HSA) NORTHERN INDIANA (IWX) MONTH YEAR TO: Hydrologic Information Center, W/OS31 NOAA s National
Crop / Weather Update
 Crop / Weather Update Corn Crop Condition Percent of Acreage Rated Good or Excellent 85 80 75 70 65 60 55 50 45 In its weekly Crop Progress Report for September 16, the USDA stated the 18-state average
Weather and Climate Summary and Forecast March 2019 Report
 Weather and Climate Summary and Forecast March 2019 Report Gregory V. Jones Linfield College March 2, 2019 Summary: Dramatic flip from a mild winter to a top five coldest February on record in many locations
The Pennsylvania Observer
 The Pennsylvania Observer August 3, 2015 July 2015 - Pennsylvania Weather Recap By: Arthur Person Although this seventh month of 2015 was fairly normal across Pennsylvania as a whole, the details reveal
The Pennsylvania Observer
 The Pennsylvania Observer December 2, 2015 November 2015 - Pennsylvania Weather Recap By: Anthny Chiavaroli This November was dry with above average temperatures across the state. Western PA saw some very
Weather and Climate Summary and Forecast January 2018 Report
 Weather and Climate Summary and Forecast January 2018 Report Gregory V. Jones Linfield College January 5, 2018 Summary: A persistent ridge of high pressure over the west in December produced strong inversions
The hydrologic service area (HSA) for this office covers Central Kentucky and South Central Indiana.
 for this office covers Central Kentucky and South Central Indiana.") MONTH YEAR January 2011 February 15, 2011 X An X inside this box indicates that no flooding occurred within this hydrologic service area. January 2011 was drier than normal in all locations in the area.
MONTH YEAR January 2011 February 15, 2011 X An X inside this box indicates that no flooding occurred within this hydrologic service area. January 2011 was drier than normal in all locations in the area.
Weather and Climate Summary and Forecast January 2019 Report
 Weather and Climate Summary and Forecast January 2019 Report Gregory V. Jones Linfield College January 4, 2019 Summary: December was mild and dry over much of the west, while the east was much warmer than
Weather and Climate Summary and Forecast April 2018 Report
 Weather and Climate Summary and Forecast April 2018 Report Gregory V. Jones Linfield College April 4, 2018 Summary: A near Miracle March played out bringing cooler and wetter conditions to the majority