September 2011 Climate Summary
|
|
|
- Lesley Austin
- 5 years ago
- Views:
Transcription

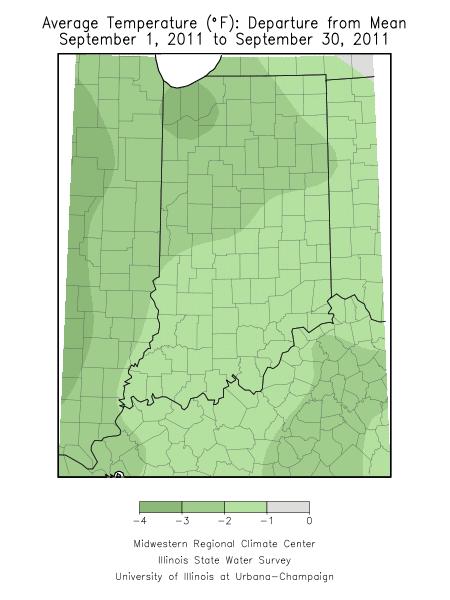
1 Ken Scheeringa and Kayla Hudson Oct 5, 2011 (765) September 2011 Climate Summary Month Summary The final blast of summer heat arrived at the start of September. It lasted just 3 days before autumn coolness settled in for much of the rest of the month. Two large cutoff low pressure systems in the upper atmosphere were players in September s cool weather: the remnants of tropical storm Lee from September 6 th through 9 th, and a second closed low system that dominated the eastern half of the country and parked itself over Indiana for nearly a week starting September 23 rd. There were many cloudy days with these systems which helped suppress the September state average temperature to 63.6, which is 2.0 below normal. Historically this ranks September 2011 as the 22 nd coolest September in Indiana since The most recent September that was cooler came in 2003, which averaged 63.4 and landed in 19 th place. The 20 th coolest September in Indiana featured a 63.5 average in The day split in September 2011 was 19 days of below normal temperature, 10 days above normal, and 1 day with normal temperature. There were 4 days this month when the daily state average temperature was at least 10 degrees colder than normal and 2 days with the daily average at least 10 degrees warmer than normal. The hottest temperature of the month was also the hottest of the year with 103 reported on September 3 rd in Terre Haute and again the next day in Shoals. The coldest temperature was 31 on September 18 th at Elwood. The late summer drought intensified the first half of the month. Significant rains returned to Indiana about September 18 th, reversing the drought cycle. Overall this month state precipitation averaged a surprising 5.39 inches, 2.3 inches above normal, which ranks as the 11 th wettest September on record. The most recent wetter September was in 2003 when 6.21 inches fell and comes in as 4 th wettest. These numbers still are far short of the 8.25 inches recorded during the wettest September on record in Regionally September 2011 precipitation ranges from one and a half times normal in northern Indiana to twice normal in southern counties. Some impressive one day rainfalls were noted in far southern Indiana. On September 25 th 5.67 inches drenched Poseyville. The next day the Patoka observer recorded 4.85 inches while 4.24 inches was observed in Jeffersonville. Soil moisture levels deteriorated the first half of the month before improving rapidly toward month s end. Nearly half the state area was classified in moderate to severe drought when the month began. As rains returned late in the month these two categories all but disappeared in the state. At the end of the month the northern half of Indiana is virtually drought free. Counties surrounding Terre Haute enter October as the driest portion of the state with a moderate drought (D1 category) classification.
2 The weather scene was rather quiet in Indiana the first half of September. Severe weather events picked up the second half of the month, including reports of 2 tornadoes. On September 26 th an EF1 tornado was confirmed in Jennings county, destroying a pole barn, damaging 2 homes, overturning a tractor, and taking down trees and power poles. Road flooding was also a problem in this area. The next day an EF0 tornado was confirmed in Elkhart county, resulting in minor roof and tree damage. There were no storm related injuries or deaths in Indiana this month. September 1 st 10 th Autumn begins this month but the hot summer of 2011 isn t over just yet. A warm frontal passage through Indiana on September 1 st allowed extreme temperatures to return for a few more days. Daily state temperatures averaged 9 to 12 above normal through September 3 rd. Maximum temperatures exceeded 100 in at least 9 locations with two cities, Shoals and Terre Haute, recording a steamy 103! A strong cold front barreled through the state on September 4 th, dropping temperatures more than 20 over the next two days. The remnants of Tropical Storm Lee entered the Indiana weather picture late in the 10 day interval, eroding away the cold to wrap up the interval at 2 below normal. For the 10 days overall temperatures finished on the cool side at 2 below normal. Typically this first week of September daily maximums are expected to range between 85 to 88 north to south across the state. Daily minimums should range from 63 in far northern Indiana to 64 in southwest counties. Most of the rain fell during these two weather systems, the cold front on September 4 th and the leftovers from Tropical Storm Lee after September 6 th. The cold front generated a quarter to a half inch of rain while the tropical storm remnants dropped up to another 0.8 inch, especially in the north. While the remnants of Lee zoomed up the Atlantic Coast a new isolated but intense low pressure center broke off from the main storm and drifted westward toward Kentucky. The wind circulation around the break away low caused the backward movement of rain showers east to west across Indiana for 3 days along with persistent cloudy skies. This low finally merged with a new low pressure system west of Indiana at the end of the 10 days carrying the dreary weather away, allowing the return of sunny skies. The combined rainfall from both weather systems totaled to near 1.2 inch in northern Indiana and 0.9 inch in central and southern areas. These totals are within 10% of normal for the 10 day interval. The heaviest 10 day totals among CoCoRaHS observers included 2.44 inches at Crown Point, 2.20 inches in Bluffton, and 2.19 inches in Winfield. The Lawrenceburg and Schererville volunteers measured 2.16 inch totals each. The cutoff low associated with the tropical storm remnants brought pesky rain showers to Indiana but surprisingly no severe weather. It was the earlier cold front that caused widespread wind damage but few reports of hail. In extreme northern Indiana hail ranging in diameter from 1.0 to 1.75 inch was reported in St Joseph and Elkhart counties with one lone report from Hancock county. On September 3 rd there were numerous reports of trees falling on power lines in north central Indiana, including in the counties of Porter, Laporte, Starke, Elkhart, and Lagrange. More reports of trees falling on power lines and roads came in from Fountain, Delaware, Madison, Marion, Hancock, Morgan, and Bartholomew counties around central Indiana. Severe weather had started on September 2 nd in Clark county of south central Indiana and continued the next day in nearby Scott county, snapping trees onto roadways.

3 Rainfall amounts are near normal so far in September but the added moisture has had little impact on the late summer Indiana drought. The National Drought Monitor edition for September 6 th reports no changes in the Indiana drought status since the week before. Except for southwest counties much of the southern half of Indiana continues in moderate drought (D1 class). Johnson and Morgan counties remain in the severe drought class (D2). Much of northeast Indiana is still considered abnormally dry (D0 class) while northwest Indiana is still drought free. September 11 th 17 th It is still summer by the calendar but late in the week it felt a lot more like autumn. A short warm up early this week was interrupted by a strong surge of cold Canadian air. A first weak cold front had crossed Indiana but then stalled along the Ohio River on September 14 th. A second much stronger front behind it quickly caught up the next day and carried the cold air south to Tennessee. The cold high pressure center then sprawled over the eastern three-fourths of the country on September 16 th before sliding eastward to end the week. Daily state average temperatures which started the week at normal had peaked at 4 above normal by September 13 th before plunging to 12 below normal two days later. A slow moderation lifted temperatures to 5 below normal to end the week. Overall for this week daily state temperatures averaged 4 below normal. Typically mid September daily maximum temperatures should range from 78 to 85 north to south across the state. Daily minimums normally vary from 57 in far northern Indiana to 61 in the southwest. A few tenths inch of rain generally fell with the passage of the cold fronts and about one tenth inch in the warmer air at the start of the week. For the week rainfall totaled about a third inch in northern and central Indiana and a half inch in the south. These amounts are about two thirds normal in southern Indiana but less than half normal elsewhere across the state. At this time of year about 0.8 inch is typical per week in Indiana. The heaviest one day CoCoRaHS amounts included 1.05 inch at Rensselaer, 0.92 inch in Williams, and 0.84 inch at Indianapolis. The greatest weekly total was 1.24 inch in Shelbyville, 1.23 inch at Evansville, and 1.15 inch in Williams. Despite the sharp temperature change the general lack of atmospheric moisture suppressed storm development. There were no reports of severe weather damage this week. But drought is still a problem in the Midwest as evidenced by the smoke from Minnesota wildfires which carried into
4 northern Indiana skies on the strong north winds of the cold front. The drought continued to intensify in Indiana as well. The National Drought Monitor increased the area coverage of severe drought (D2 class) in Indiana by 10% this week. The expanded area now includes parts of west central and southwest Indiana, that is, most of Vigo, Clay, Owen, Morgan, Parke, Putnam, Monroe, Greene, and Sullivan counties. Parts of Johnson, Vermillion, Hendricks, and Bartholomew counties are also in this classification. The portion of Indiana in moderate drought (D1 class) is generally south of a line drawn from the communities of Covington to Richmond. In addition abnormally dry conditions (D0 class) have expanded into southwest Indiana. The drought conditions have prompted a few counties to declare open burn bans. Daviess county ordered a one week open burn ban effective September 12 th. The open burn ban in effect in Sullivan county expired on September 15 th. September 18 th 24 th Weather systems picked up the pace this week as 4 fronts crossed Indiana in the space of just 4 days. But that all changed by the end of the week when an upper atmospheric storm system stalled and was left behind in the Midwest by the jet stream which shifted its track far northward into Canada. Daily average statewide temperatures started the week 4 below normal but rose steadily before peaking at 6 above normal. The first warm front passed through Indiana on September 19 th, immediately followed by its cold front the next day. The next storm system was right on the heels of the first, pulling another warm front through the state on September 21 st and followed by its paired cold front the next day. Daily state average temperatures now slid slowly on a downward trend, ending the week at 2 below normal. The slow flow and ebb of the temperature cycle averaged to normal this week. Daily normal maximum temperatures around Indiana this week generally range from about 75 in the north to 82 in the south. Typical daily minimums would vary between 53 in northern counties to 57 in far southwest Indiana. The many fronts triggered showers nearly every day with the heaviest amounts in central and southern Indiana. Regionally for the week about 0.8 inch of rain fell on average in northern Indiana, near 1.7 inch in central sections, and 1.9 inches across the south. While these totals are just 20% higher than normal in the north, rain accumulated to about two and a half times normal in
5 central and southern Indiana. In some local areas the rain which fell on September 18 th and 19 th were the most significant amounts measured since June 20 th, three months ago! Some of the heavier one day amounts recorded by CoCoRaHS observers included 2.87 inches in Melody Hill, 2.57 inches in Castleton, 2.30 inches at Woodburn, and 2.22 inches in Clay City. The highest weekly totals include 3.69 inches and 3.54 inches at two locations in Evansville, 3.51 inches in Clay City and Darmstadt, and 3.40 inches at Gosport. The first significant rains in many weeks were able to finally increase soil moisture and reverse the worsening drought situation in Indiana. The September 19 th edition of the National Drought Monitor noted a 13% reduction in the area of the state classified in moderate drought (D1 class) and a 5% area reduction in severe drought (D2 class) area. Improvement was seen in the center of the state where the severe drought area has decreased in size. Rains missed west central counties which remain in severe drought, including all of Vigo, Clay, and Owen and parts of Parke, Putnam, Greene, and Sullivan. The surrounding moderate drought area is located generally south and west of a Covington to Richmond to Corydon line, excluding areas west of a Boonville to Vincennes line. Crops in parts of west central Indiana which continue in severe drought are likely to suffer yield losses according to crop experts. A delayed spring planting season, followed by a hot and dry summer has been difficult on crops this year particularly in these continued severe drought areas. The recent rains have eliminated all open burn bans in Indiana. Officials in Daviess county have allowed the one week open fire ban there to expire on September 19 th.
6 September 25 th 30 th A huge stalled low pressure center in the upper atmosphere, cutoff from the jet stream and sprawled across the eastern half of the country, dominated our weather this week. The persistent cloudy skies and intermittent rain showers held state average temperatures 2 to 4 above normal the first half of the week. Finally the week-old cutoff low was picked up by upper level winds and transported eastward on September 29 th. A surge of cold Canadian air took its place over Indiana, lowering daily average temperatures to 7 below normal at month s end. Overall for the week daily temperatures averaged 3 below normal. Normally at the end of September daily maximum temperatures range from 72 in extreme northern Indiana to 79 in the far southwest. Daily minimums typically vary between 50 and 53 north to south across the state. Rainfall was an every day occurrence this week. The heaviest amounts fell with the passage of a first cold front on September 26 th with 1 inch readings common across northern Indiana and up to 2 inches across the south. Some locations in far southern Indiana found much heavier amounts in their rain gauges. The CoCoRaHS observer in Patoka measured 4.85 inches for that day while two Jeffersonville reporters recorded 4.24 inches and 4.20 inches. The Petersburg volunteer received 3.79 inches while 3.72 inches was noted in Poseyville. Rainfall became lighter on the following days with daily amounts just over a quarter inch in northern counties to less than a tenth inch in the south. The everyday rains really added up by the end of the week. About 2.7 inches was totaled across northern Indiana, 2.4 inches in central sections, and 3.0 inches in southern areas. These totals are more than 4 times normal in the northern and southern thirds of Indiana and just shy of 4 times normal in the central part of the state! Some of the heaviest CoCoRaHS weekly totals include 5.09 inches in Denver, 4.66 inches in Logansport, and 4.35 inches in Galveston. The intense rainfall along the Ohio River flooded roadways on the morning of September 26 th. In Clark and Floyd counties several roads were underwater and about 75 homes lost power. A little further north an EF1 tornado touched down in Jennings county, destroying a pole barn, damaging 2 homes, overturning a tractor, and taking down trees and power poles. Flooded roads were also a problem in this area. In Henry county hail up to 1.75 inch in diameter was reported. The next day an EF0 tornado was confirmed at the opposite end of the state in Elkhart county with 75 mph winds and a 0.6 mile long path. There was minor roof and tree damage. The cutoff low departed Indiana on September 29 th and the week s second cold front rushed in behind it. High 50 mph winds damaged utility lines in Tipton county and to the east in Delaware county high winds brought a tree down on top of a house. Some semi-trailers were banned for the day from the Indiana Toll Road in extreme northwest Indiana. Fortunately there were no injuries in any of the storms this week. One benefit of the heavy rain was the continued easing of the late summer drought in Indiana. According to the National Drought Monitor issued September 27 th the drought free region of Indiana has increased from 17% to 55% of the state area and consists largely of the northern half of the state. Areas classified as abnormally dry (D0 category) a week ago have decreased in coverage from 83% to 45% in area while moderate drought (D1 category) acres have fallen from 41% to 6% of total state area. There are no areas remaining in severe drought (D2 category) status. In general terms then most areas of Indiana have improved about one drought category from a week ago.
7 September 2011 Temperature Region Temperature Normal Deviation Northwest North Central Northeast West Central Central East Central Southwest South Central Southeast State Precipitation Region Precipitation Normal Deviation Percent of Normal Northwest North Central Northeast West Central Central East Central Southwest South Central Southeast State
8 Autumn 2011 (so far same as September) Temperature Region Temperature Normal Deviation Northwest North Central Northeast West Central Central East Central Southwest South Central Southeast State Precipitation Region Precipitation Normal Deviation Percent of Normal Northwest North Central Northeast West Central Central East Central Southwest South Central Southeast State
9 2011 Annual so far Temperature Region Temperature Normal Deviation Northwest North Central Northeast West Central Central East Central Southwest South Central Southeast State Precipitation Region Precipitation Normal Deviation Percent of Normal Northwest North Central Northeast West Central Central East Central Southwest South Central Southeast State
10
11
12
13 Drought Summary from the U.S. Drought Monitor Below is a drought summary for the state of Indiana from the U.S. drought monitor. Areas in white are not experiencing any drought. Yellow areas are abnormally dry, but not entirely considered a drought. Drought begins when the moisture levels become more severe, with beige, orange, red, and brown indicating increasing levels of drought (moderate, severe, extreme, and exceptional, respectively). The table below indicates how much of the state is not under drought conditions, and also how much of the state is under drought conditions from its respective column upwards. For example, September 27 th has 6.1% of Indiana under at least D1-D4 drought status, 44.9% under at least D0 through D4 drought status, and 55.1% drought free. Subtracting the D1-D4 category (6.1%) from the D0-D4 category (44.9%), tells us that 38.8% of Indiana is in D0 category alone (abnormally dry). Please note, however, that these areas are not exact, and much of this drought map has been created from reports throughout the state and in estimation, so use this information as a general view rather than for specifics.
14 September 6 th Drought Summary

15 September 13 th Drought Summary
16 September 20 th Drought Summary

17 September 27 th Drought Summary
October 2011 Climate Summary
 Ken Scheeringa and Kayla Hudson Nov 4, 2011 http://www.iclimate.org October 2011 Climate Summary Month Summary October weather evolved as a two part story. Weather conditions the first half of the month
July 2007 Climate Summary
 Dan Bowman (765) 494-6574 Sep 3, 2007 http://www.iclimate.org Summary July 2007 Climate Summary The month of July ended as a very unusual month. Many events occurred during the month of July that is not
September 2005 Climate Summary
 Ashley Brooks (765) 494-6574 Oct 5, 2005 http://iclimate.org September 2005 Climate Summary September 1-7 A cold front came through on the 1 st of the month, however little moisture was associated with
December 2011 Climate Summary
 Ken Scheeringa and Kayla Hudson Jan 17, 2012 (765) 494-8105 http://www.iclimate.org December 2011 Climate Summary Month Summary What a difference a year makes! A year ago the misery of a harsh, cold, and
August 2006 Summary. August 1-5
 Ashley Brooks (765) 494-6574 Sep 8, 2006 http://www.iclimate.org August 1-5 August 2006 Summary The heat wave that started during the end of July continued into the beginning parts of August with temperatures
January 2008 Climate Summary
 Joseph Mays (765) 494-6574 Feb 5, 2008 http://www.iclimate.org Summary January 2008 Climate Summary January was a mix bag of conditions, with an oscillatory pattern developing. We experienced phases of
August 2013 Climate Summary
 Ken Scheeringa and Matt Price Sep 6, 2013 (765) 494-8105 http://www.iclimate.org August 2013 Climate Summary Month Summary August weather began cool and wet but became progressively warmer and drier through
November 2010 Climate Summary
 Ken Scheeringa (765) 494-8105 Dec 6, 2010 http://www.iclimate.org November 2010 Climate Summary Summary A four month drought in Indiana is collapsing as significant rain fell the final week of November.
May 2005 Climate Summary
 Ashley Brooks (765) 494-6574 Jun 7, 2005 http://iclimate.org May 2005 Climate Summary May 1-5 Early May was characterized by an upper-level trough that was in place over Indiana that brought in very cool
November 2012 Climate Summary
 Ken Scheeringa and Kayla Hudson Dec 6, 2012 (765) 494-8105 http://www.iclimate.org November 2012 Climate Summary Month Summary November was one of those rare weather months in Indiana when not much happened:
2011 Year in Review TORNADOES
 2011 Year in Review The year 2011 had weather events that will be remembered for a long time. Two significant tornado outbreaks in April, widespread damage and power outages from Hurricane Irene in August
January 2006 Climate Summary
 Ashley Brooks (765) 494-6574 Feb 9, 2006 http://www.iclimate.org January 1-3 January 2006 Climate Summary Unseasonably warm conditions welcomed in the New Year with highs in the 40s across the northern
The hydrologic service area (HSA) for this office covers Central Kentucky and South Central Indiana.
 for this office covers Central Kentucky and South Central Indiana.") January 2012 February 13, 2012 An X inside this box indicates that no flooding occurred within this hydrologic service area. January 2012 continued the string of wet months this winter. Rainfall was generally
January 2012 February 13, 2012 An X inside this box indicates that no flooding occurred within this hydrologic service area. January 2012 continued the string of wet months this winter. Rainfall was generally
July 2010 Climate Summary
 Ken Scheeringa (765) 494-8105 Aug 4, 2010 http://www.iclimate.org July 2010 Climate Summary Summary The warm summer of 2010 continues. Daily state average temperatures were above normal on all but seven
September 2012 Climate Summary
 Ken Scheeringa and Kayla Hudson Oct 5, 2012 (765) 494-8105 http://www.iclimate.org September 2012 Climate Summary Month Summary Summer slipped away and it felt a lot more like autumn in Indiana this month
March 2014 Climate Summary
 Ken Scheeringa And Matt Price Apr 8, 2014 (765) 494-8105 http://www.iclimate.org March 2014 Climate Summary Month Summary Winter had officially ended by the calendar but snow and cold persisted in Indiana
January 2012 Climate Summary
 Ken Scheeringa and Kayla Hudson Feb 6, 2012 (765) 494-8105 http://www.iclimate.org January 2012 Climate Summary Month Summary Where is winter? This question found its way into many conversations throughout
May 2016 Climate Summary
 Ken Scheeringa And Andy Eggert Jun 6, 2016 (765) 494-8105 http://www.iclimate.org May 2016 Climate Summary Month Summary Cold weather dominated in May until the last week of the month. May began wet but
June 2010 Climate Summary
 Ken Scheeringa (765) 494-8105 Jul 6, 2010 http://www.iclimate.org June 2010 Climate Summary Summary Summer like heat and humidity arrived in Indiana on May 22 nd and dominated our weather scene nearly
October 2012 Climate Summary
 Ken Scheeringa and Kayla Hudson Nov 8, 2012 (765) 494-8105 http://www.iclimate.org October 2012 Climate Summary Month Summary In a reversal from the hot and dry summer, cooler and wetter than normal conditions
October 2017 Climate Summary
 Ken Scheeringa and Andy Eggert Nov 6, 2017 (765) 494-8105 http://www.iclimate.org October 2017 Climate Summary Month Summary After more than three weeks of warm temperatures October turned suddenly cold
August 2017 Climate Summary
 Ken Scheeringa And Andy Eggert Sep 7, 2017 (765) 494-8105 http://www.iclimate.org August 2017 Climate Summary Month Summary The coolest August in 13 years featured long cool and warm spells, below normal
October 2014 Climate Summary
 Ken Scheeringa And Matt Price Nov 10, 2014 (765) 494-8105 http://www.iclimate.org October 2014 Climate Summary Month Summary October featured a mix of weather. A very wet first half of the month evolved
The hydrologic service area (HSA) for this office covers Central Kentucky and South Central Indiana.
 for this office covers Central Kentucky and South Central Indiana.") MONTH YEAR January 2011 February 15, 2011 X An X inside this box indicates that no flooding occurred within this hydrologic service area. January 2011 was drier than normal in all locations in the area.
MONTH YEAR January 2011 February 15, 2011 X An X inside this box indicates that no flooding occurred within this hydrologic service area. January 2011 was drier than normal in all locations in the area.
National Wildland Significant Fire Potential Outlook
 National Wildland Significant Fire Potential Outlook National Interagency Fire Center Predictive Services Issued: September, 2007 Wildland Fire Outlook September through December 2007 Significant fire
April 2013 Climate Summary
 Ken Scheeringa and Kayla Hudson May 6, 2013 (765) 494-8105 http://www.iclimate.org April 2013 Climate Summary Month Summary Temperatures bounced high and low this month, keeping Hoosiers guessing which
November 2015 Climate Summary
 Ken Scheeringa And Mary Rose Mangan Dec 8, 2015 (765) 494-8105 http://www.iclimate.org November 2015 Climate Summary Month Summary November was much warmer than normal while precipitation was very near
Monthly Long Range Weather Commentary Issued: July 18, 2014 Steven A. Root, CCM, President/CEO
 Monthly Long Range Weather Commentary Issued: July 18, 2014 Steven A. Root, CCM, President/CEO sroot@weatherbank.com JUNE 2014 REVIEW Climate Highlights The Month in Review The average temperature for
Champaign-Urbana 1998 Annual Weather Summary
 Champaign-Urbana 1998 Annual Weather Summary ILLINOIS STATE WATER SURVEY Audrey Bryan, Weather Observer 2204 Griffith Dr. Champaign, IL 61820 wxobsrvr@sparc.sws.uiuc.edu The development of the El Nìno
March 2016 Climate Summary
 Ken Scheeringa And Andy Eggert Apr 8, 2016 (765) 494-8105 http://www.iclimate.org March 2016 Climate Summary Month Summary Count March as the 7 th month in a row that the state average temperature has
May 2018 Climate Summary
 Ken Scheeringa and Andy Eggert Jun 7, 2018 (765) 494-8105 http://www.iclimate.org May 2018 Climate Summary Month Summary As the calendar turned from April to May temperatures flipped dramatically away
Champaign-Urbana 1999 Annual Weather Summary
 Champaign-Urbana 1999 Annual Weather Summary ILLINOIS STATE WATER SURVEY 2204 Griffith Dr. Champaign, IL 61820 wxobsrvr@sws.uiuc.edu Maria Peters, Weather Observer A major snowstorm kicked off the new
November 2014 Climate Summary
 Ken Scheeringa And Matt Price Dec 10, 2014 (765) 494-8105 http://www.iclimate.org November 2014 Climate Summary Month Summary Unseasonable cold headlined the Indiana and national news in November. The
May 2015 Climate Summary
 Ken Scheeringa And Mary Rose Mangan Jun 8, 2015 (765) 494-8105 http://www.iclimate.org May 2015 Climate Summary Month Summary May was a very warm month. Rainfall averaged near normal but was distributed
September 2016 Climate Summary
 Ken Scheeringa And Andy Eggert Oct 6, 2016 (765) 494-8105 http://www.iclimate.org September 2016 Climate Summary Month Summary The warmest September in 77 years brought alternating weeks of dry and wet
June 2011 Climate Summary
 Ken Scheeringa (765) 494-8105 Jul 8, 2011 http://www.iclimate.org June 2011 Climate Summary Month Summary The abundance of extreme weather this year extended yet another month into June. This month has
NATIONAL WEATHER SERVICE
 January 2016 February 9, 2016 This was a dry month across the HSA despite one large and several smaller snowfalls. Most locations ended up 1-2 inches below normal for the month. The driest locations at
The Pennsylvania Observer
 The Pennsylvania Observer April 2, 2009 March 2009 Pennsylvania Weather Recap Prepared by Curt Harpster For the month of March the saying, In like a lion and out like a lamb really fit the pattern quite
Monthly Long Range Weather Commentary Issued: May 15, 2014 Steven A. Root, CCM, President/CEO
 Monthly Long Range Weather Commentary Issued: May 15, 2014 Steven A. Root, CCM, President/CEO sroot@weatherbank.com APRIL 2014 REVIEW Climate Highlights The Month in Review The average temperature for
April 2016 Climate Summary
 Ken Scheeringa And Andy Eggert May 9, 2016 (765) 494-8105 http://www.iclimate.org April 2016 Climate Summary Month Summary One month but two seasons. The first half of April was cold with snow. Wind damage
Monthly Long Range Weather Commentary Issued: SEPTEMBER 19, 2016 Steven A. Root, CCM, Chief Analytics Officer, Sr. VP,
 Monthly Long Range Weather Commentary Issued: SEPTEMBER 19, 2016 Steven A. Root, CCM, Chief Analytics Officer, Sr. VP, sroot@weatherbank.com SEPTEMBER 2016 Climate Highlights The Month in Review The contiguous
SEPTEMBER 2013 REVIEW
 Monthly Long Range Weather Commentary Issued: October 21, 2013 Steven A. Root, CCM, President/CEO sroot@weatherbank.com SEPTEMBER 2013 REVIEW Climate Highlights The Month in Review The average temperature
The Pennsylvania Observer
 The Pennsylvania Observer August 3, 2015 July 2015 - Pennsylvania Weather Recap By: Arthur Person Although this seventh month of 2015 was fairly normal across Pennsylvania as a whole, the details reveal
Champaign-Urbana 2001 Annual Weather Summary
 Champaign-Urbana 2001 Annual Weather Summary ILLINOIS STATE WATER SURVEY 2204 Griffith Dr. Champaign, IL 61820 wxobsrvr@sws.uiuc.edu Maria Peters, Weather Observer January: After a cold and snowy December,
March 2009 Climate Summary
 Joseph Mays (765) 494-6574 Apr 1, 2009 http://www.iclimate.org Summary March 2009 Climate Summary March is in the books and it continued the trend of extreme weather we have experienced during the first
January 2017 Climate Summary
 Ken Scheeringa And Andy Eggert Feb 8, 2017 (765) 494-8105 http://www.iclimate.org January 2017 Climate Summary Month Summary The warmest January in 11 years was nearly 4 F warmer than December 2016. An
July 2011 Climate Summary
 Ken Scheeringa (765) 494-8105 Aug 8, 2011 http://www.iclimate.org July 2011 Climate Summary Month Summary The upper atmospheric high pressure dome which baked the Texas area in heat and drought the past
April 2015 Climate Summary
 Ken Scheeringa And Mary Rose Mangan May 8, 2015 http://www iclimate org April 2015 Climate Summary Month Summary April was a month of extremes. Severe weather erupted on 4 days of the first week with multiple
August 2015 Climate Summary
 Ken Scheeringa And Mary Rose Mangan Sep 4, 2015 (765) 494-8105 http://www.iclimate.org August 2015 Climate Summary Month Summary A very active wet summer weather pattern turned much calmer and drier in
October 2016 Climate Summary
 Ken Scheeringa And Andy Eggert Nov 9, 2016 (765) 494-8105 http://www.iclimate.org October 2016 Climate Summary Month Summary October was the 9 th month so far this year to average above normal in temperature.
Monthly Long Range Weather Commentary Issued: NOVEMBER 16, 2015 Steven A. Root, CCM, Chief Analytics Officer, Sr. VP, sales
 Monthly Long Range Weather Commentary Issued: NOVEMBER 16, 2015 Steven A. Root, CCM, Chief Analytics Officer, Sr. VP, sales sroot@weatherbank.com OCTOBER 2015 Climate Highlights The Month in Review The
2012 Growing Season Weather Summary for North Dakota. Adnan Akyüz and Barbara A. Mullins Department of Soil Science October 30, 2012
 2012 Growing Season Weather Summary for North Dakota Adnan Akyüz and Barbara A. Mullins Department of Soil Science October 30, 2012 Introduction The 2012 growing season (the period from April through September)
November 2017 Climate Summary
 Ken Scheeringa and Andy Eggert Dec 8, 2017 (765) 494-8105 http://www.iclimate.org November 2017 Climate Summary Month Summary November temperatures alternated spells of warm and cool while precipitation
SIGNIFICANT EVENTS Severe Storms November 1994 January 1996 August 1998 and May 2000 March 2002 May 2002 Champaign County
 SIGNIFICANT EVENTS Severe Storms November 1994 On Nov. 1, 1994, high winds gusted over 60 mph at times across the northwest third of Ohio. The highest measured wind gust was 63 mph at Columbus Grove (Putnam).
January 2013 Climate Summary
 Ken Scheeringa and Kayla Hudson Feb 7, 2013 (765) 494-8105 http://www.iclimate.org January 2013 Climate Summary Month Summary Winter or spring? January featured several dramatic swings in temperature and
Illinois Drought Update, December 1, 2005 DROUGHT RESPONSE TASK FORCE Illinois State Water Survey, Department of Natural Resources
 Illinois Drought Update, December 1, 2005 DROUGHT RESPONSE TASK FORCE Illinois State Water Survey, Department of Natural Resources For more drought information please go to http://www.sws.uiuc.edu/. SUMMARY.
The Pennsylvania Observer
 The Pennsylvania Observer October 1, 2015 September 2015 - Pennsylvania Weather Recap By: Quinn Lease The month of September will be remembered for its above normal temperatures and dry conditions that
Monthly Long Range Weather Commentary Issued: APRIL 18, 2017 Steven A. Root, CCM, Chief Analytics Officer, Sr. VP,
 Monthly Long Range Weather Commentary Issued: APRIL 18, 2017 Steven A. Root, CCM, Chief Analytics Officer, Sr. VP, sroot@weatherbank.com MARCH 2017 Climate Highlights The Month in Review The average contiguous
June 2016 Climate Summary
 Ken Scheeringa And Andy Eggert Jul 8, 2016 (765) 494-8105 http://www.iclimate.org June 2016 Climate Summary Month Summary June was a warm month with below normal temperature on just 6 days. Rainfall was
KANSAS CLIMATE SUMMARY October 2016
 KANSAS CLIMATE SUMMARY October 2016 Record warmth Temperatures continued the warmer than normal pattern through much of October. The state-wide average temperature was 60.9 of, or 5.6 degrees warmer than
March 2011 Climate Summary
 Ken Scheeringa (765) 494-8105 Apr 5, 2011 http://www.iclimate.org March 2011 Climate Summary Summary The fast paced weather action of February slowed some in March. The major March weather features were
The Pennsylvania Observer
 The Pennsylvania Observer May 31, 2012 May 2012 - Pennsylvania Weather Recap By: Paul Knight The majority of the fifth month had temperatures averaging well above seasonal levels with two distinct hot
Monthly Long Range Weather Commentary Issued: SEPTEMBER 19, 2015 Steven A. Root, CCM, Chief Analytics Officer, Sr. VP, sales
 Monthly Long Range Weather Commentary Issued: SEPTEMBER 19, 2015 Steven A. Root, CCM, Chief Analytics Officer, Sr. VP, sales sroot@weatherbank.com AUGUST 2015 Climate Highlights The Month in Review The
October 2010 Climate Summary
 Ken Scheeringa (765) 494-8105 Nov 5, 2010 http://www.iclimate.org October 2010 Climate Summary Summary Rain fell on about 10 days in October but did little to slow the drought raging across Indiana. For
NWS FORM E-5 U.S. DEPARTMENT OF COMMERCE HSA OFFICE:
 NWS FORM E-5 U.S. DEPARTMENT OF COMMERCE HSA OFFICE: NOAA, NATIONAL WEATHER SERVICE MONTHLY REPORT OF RIVER AND FLOOD CONDITIONS DATE: TO: North Webster, IN REPORT FOR (MONTH &YEAR): July 1998 August 5,
but 2012 was dry Most farmers pulled in a crop
 After a winter that wasn t, conditions late in the year pointed to a return to normal snow and cold conditions Most farmers pulled in a crop but 2012 was dry b y M i k e Wr o b l e w s k i, w e a t h e
Weather and Climate Summary and Forecast October 2017 Report
 Weather and Climate Summary and Forecast October 2017 Report Gregory V. Jones Linfield College October 4, 2017 Summary: Typical variability in September temperatures with the onset of fall conditions evident
February 2017 Climate Summary
 Ken Scheeringa And Andy Eggert Mar 9, 2017 (765) 494-8105 http://www.iclimate.org February 2017 Climate Summary Month Summary February 2017 was the warmest February in Indiana since state climate records
2018 Year in Review for Central and Southeast Illinois By: Chris Geelhart, Meteorologist National Weather Service, Lincoln IL
 By: Chris Geelhart, Meteorologist National Weather Service, Lincoln IL While 2018 featured some significant out-of-season weather, including below zero temperatures in April and 90-degree highs in early
KANSAS CLIMATE SUMMARY February 2015
 KANSAS CLIMATE SUMMARY February 2015 Extended Cold Despite some record warm readings at a few locations, February was characterized by colder than normal conditions. This was particularly true during the
Colorado CoCoRaHS. Colorado CoCoRaHS. Because Every Drop Counts! November 2014 Volume 2, Issue 11
 U.S. PRECIPITATION (% OF AVERAGE) LOOKING BACK AT OCTOBER 2014 October was a fairly dry month for much of the nation with the exception of the Pacific Northwest, portions of New England and the Tennessee
NWS FORM E-5 U.S. DEPARTMENT OF COMMERCE I HYDRO SERVICE AREA NOAA, NATIONAL WEATHER SERVICE I Indianapolis, IN MONTHLY REPORT
 NWS FORM E-5 U.S. DEPARTMENT OF COMMERCE I HYDRO SERVICE AREA NOAA, NATIONAL WEATHER SERVICE I Indianapolis, IN. 1-------------------- MONTHLY REPORT OF RIVER AND FLOOD CONDITIONSI REPORT FOR I November
April 2011 Climate Summary
 Ken Scheeringa (765) 494-8105 May 9, 2011 http://www.iclimate.org April 2011 Climate Summary Summary After somewhat of a respite in March Indiana weather ramped up with a vengeance in April. Extreme weather
Arizona Climate Summary May 2012
 Arizona Climate Summary May 2012 Summary of conditions for April 2012 April 2012 Temperature and Precipitation Summary April 1 st 16 th : Although April began with another low pressure system sweeping
Foundations of Earth Science, 6e Lutgens, Tarbuck, & Tasa
 Foundations of Earth Science, 6e Lutgens, Tarbuck, & Tasa Weather Patterns and Severe Weather Foundations, 6e - Chapter 14 Stan Hatfield Southwestern Illinois College Air masses Characteristics Large body
Weather and Climate Summary and Forecast Summer 2017
 Weather and Climate Summary and Forecast Summer 2017 Gregory V. Jones Southern Oregon University August 4, 2017 July largely held true to forecast, although it ended with the start of one of the most extreme
Air Masses, Fronts, Storm Systems, and the Jet Stream
 Air Masses, Fronts, Storm Systems, and the Jet Stream Air Masses When a large bubble of air remains over a specific area of Earth long enough to take on the temperature and humidity characteristics of
The Weather Wire. Contents: Summer 2018 Outlook. Summer 2018 Outlook Drought Monitor May Summary/Statistics June Preview Rainfall Totals
 The Weather Wire June 2018 Volume 25 Number 6 Contents: Summer 2018 Outlook Drought Monitor May Summary/Statistics June Preview Rainfall Totals Summer 2018 Outlook June 1 st marked the first day of meteorological
April 2017 Climate Summary
 Ken Scheeringa And Andy Eggert May 8, 2017 (765) 494-8105 http://www.iclimate.org April 2017 Climate Summary Month Summary April was a very warm and wet month in Indiana, nearly setting a new monthly temperature
How strong does wind have to be to topple a garbage can?
 How strong does wind have to be to topple a garbage can? Imagine winds powerful enough to pick up a truck and toss it the length of a football field. Winds of this extreme sometimes happen in a tornado.
March 2018 Climate Summary
 Ken Scheeringa and Andy Eggert Apr 5, 2018 (765) 494-8105 http://www.iclimate.org March 2018 Climate Summary Month Summary March turned cold with below normal temperatures on two-thirds of its days. Along
Storm and Storm Systems Related Vocabulary and Definitions. Magnitudes are measured differently for different hazard types:
 Storm and Storm Systems Related Vocabulary and Definitions Magnitude: this is an indication of the scale of an event, often synonymous with intensity or size. In natural systems, magnitude is also related
Monthly Long Range Weather Commentary Issued: February 15, 2015 Steven A. Root, CCM, President/CEO
 Monthly Long Range Weather Commentary Issued: February 15, 2015 Steven A. Root, CCM, President/CEO sroot@weatherbank.com JANUARY 2015 Climate Highlights The Month in Review During January, the average
November 2016 Climate Summary
 Ken Scheeringa And Andy Eggert Dec 15, 2016 (765) 494-8105 http://www.iclimate.org November 2016 Climate Summary Month Summary Unseasonably warm, pleasant, and sunny weather the first half of the month
New Hampshire State Climate Office Dr. Mary D. Stampone, State Climatologist
 New Hampshire State Climate Office Dr. Mary D. Stampone, State Climatologist University of New Hampshire c/o Department of Geography 73 Main Street Durham, NH 03824 Phone: 603-862-3136 Fax: 603-862-4362
Arizona Climate Summary
 May 2015 Temperature and Precipitation Summary Arizona Climate Summary June 2015 Summary of conditions for May 2015 May 1 st 14 th : May began with high pressure in the west, and May 1 st was dry statewide,
KANSAS CLIMATE SUMMARY January 2018
 KANSAS CLIMATE SUMMARY January 2018 Some welcome moisture After an extended period with little to no moisture, parts of Kansas recorded some significant precipitation. At Tribune, a small snow event on
July 2014 Climate Summary
 Ken Scheeringa And Matt Price Aug 8, 2014 (765) 494-8105 http://www.iclimate.org July 2014 Climate Summary Month Summary July was unseasonably cool and drier than normal. Rainfall was light in parts of
W I N T E R STORM HAZARD DESCRIPTION
 W I N T E R STORM HAZARD DESCRIPTION... 1 LOCATION... 2 EXTENT... 2 HISTORICAL OCCURRENCES... 4 SIGNIFICANT PAST EVENTS... 4 PROBABILITY OF FUTURE EVENTS... 5 VULNERABILITY AND IMPACT... 5 HAZARD DESCRIPTION
Nebraska experienced a wide
 Issue 1 August 2016 CLIMATE UPDATE A MONTHLY SUMMARY FROM THE neclimate.unl.edu August saw reprieve from dryness, cooler temps Overview Nebraska experienced a wide range of conditions across the state
The hydrologic service area (HSA) for this office covers Central Kentucky and South Central Indiana.
 for this office covers Central Kentucky and South Central Indiana.") NWS Form E-5 (04-2006) NATIONAL OCEANIC AND ATMOSPHERIC ADMINISTRATION (PRES. BY NWS Instruction 10-924) NATIONAL WEATHER SERVICE MONTHLY REPORT OF HYDROLOGIC CONDITIONS HYDROLOGIC SERVICE AREA (HSA) Louisville
NWS Form E-5 (04-2006) NATIONAL OCEANIC AND ATMOSPHERIC ADMINISTRATION (PRES. BY NWS Instruction 10-924) NATIONAL WEATHER SERVICE MONTHLY REPORT OF HYDROLOGIC CONDITIONS HYDROLOGIC SERVICE AREA (HSA) Louisville
2015: A YEAR IN REVIEW F.S. ANSLOW
 2015: A YEAR IN REVIEW F.S. ANSLOW 1 INTRODUCTION Recently, three of the major centres for global climate monitoring determined with high confidence that 2015 was the warmest year on record, globally.
3 Severe Weather. Critical Thinking
 CHAPTER 2 3 Severe Weather SECTION Understanding Weather BEFORE YOU READ After you read this section, you should be able to answer these questions: What are some types of severe weather? How can you stay
Monthly Long Range Weather Commentary Issued: APRIL 1, 2015 Steven A. Root, CCM, President/CEO
 Monthly Long Range Weather Commentary Issued: APRIL 1, 2015 Steven A. Root, CCM, President/CEO sroot@weatherbank.com FEBRUARY 2015 Climate Highlights The Month in Review The February contiguous U.S. temperature
NATIONAL WEATHER SERVICE
 NWS Form E-5 (PRES. BY NWS Instruction 10-924) MONTHLY REPORT OF HYDROLOGIC CONDITIONS HYDROLOGIC SERVICE AREA (HSA) NORTHERN INDIANA (IWX) MONTH YEAR TO: Hydrologic Information Center, W/OS31 NOAA s National
KANSAS CLIMATE SUMMARY August 2015
 KANSAS CLIMATE SUMMARY August 2015 Cool and Dry August was drier than normal in most of the state. State-wide average precipitation was 2.80 inches or 85 percent of normal. The Northeast division of the
The Pennsylvania Observer
 The Pennsylvania Observer September 3, 2008 Summer 2008 Weather Summary Written by: Brian Thompson The opening days of June started dry, but a warm front brought a widespread rain a couple of days into
January 2018 Climate Summary
 Ken Scheeringa and Andy Eggert Feb 8, 2018 (765) 494-8105 http://www.iclimate.org January 2018 Climate Summary Month Summary January temperature swings were amazing. In the first few days arctic cold pushed
Ch. 3: Weather Patterns
 Ch. 3: Weather Patterns Sect. 1: Air Mass & Fronts Sect. 2: Storms Sect. 3: Predicting the Weather Sect. 4: Weather forecasters use advanced technologies Ch. 3 Weather Fronts and Storms Objective(s) 7.E.1.3
KANSAS CLIMATE SUMMARY May 2018
 KANSAS CLIMATE SUMMARY May 2018 From Cold to Hot May came close to setting the record as the hottest since 1895. The state-wide average temperature for the month was 70.6 o F. This was 7.2 degrees warmer