August 2017 Climate Summary
|
|
|
- Irene Bryant
- 5 years ago
- Views:
Transcription

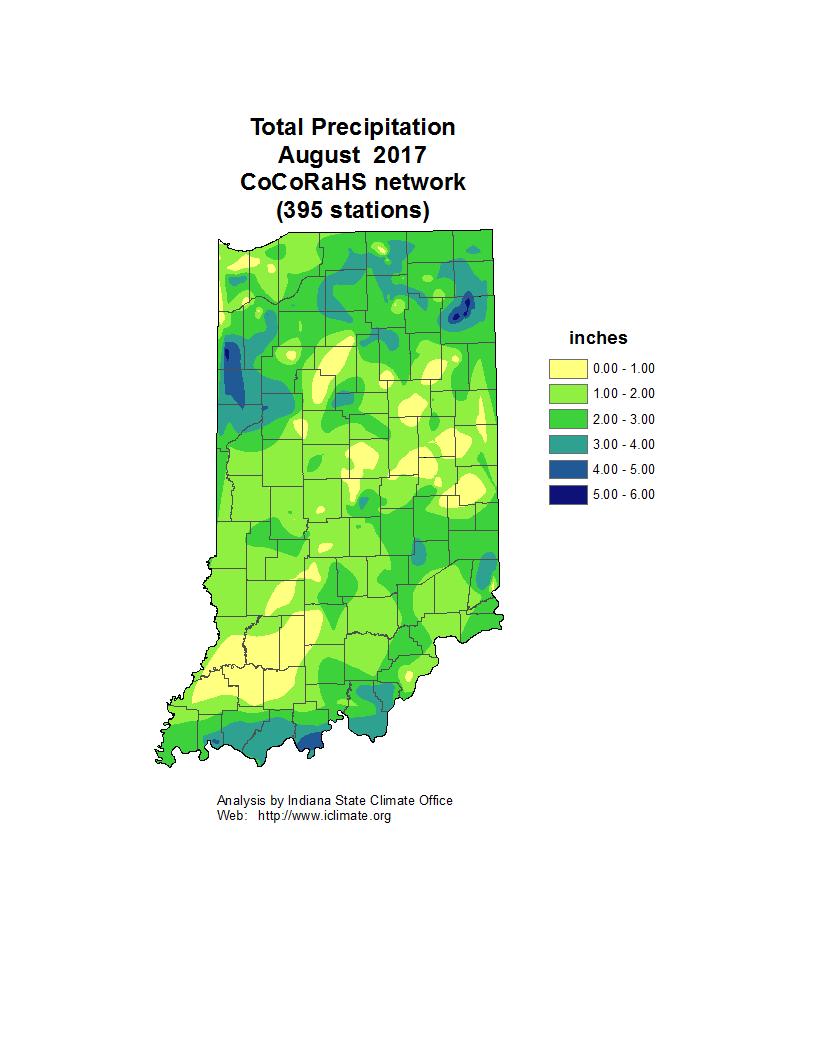
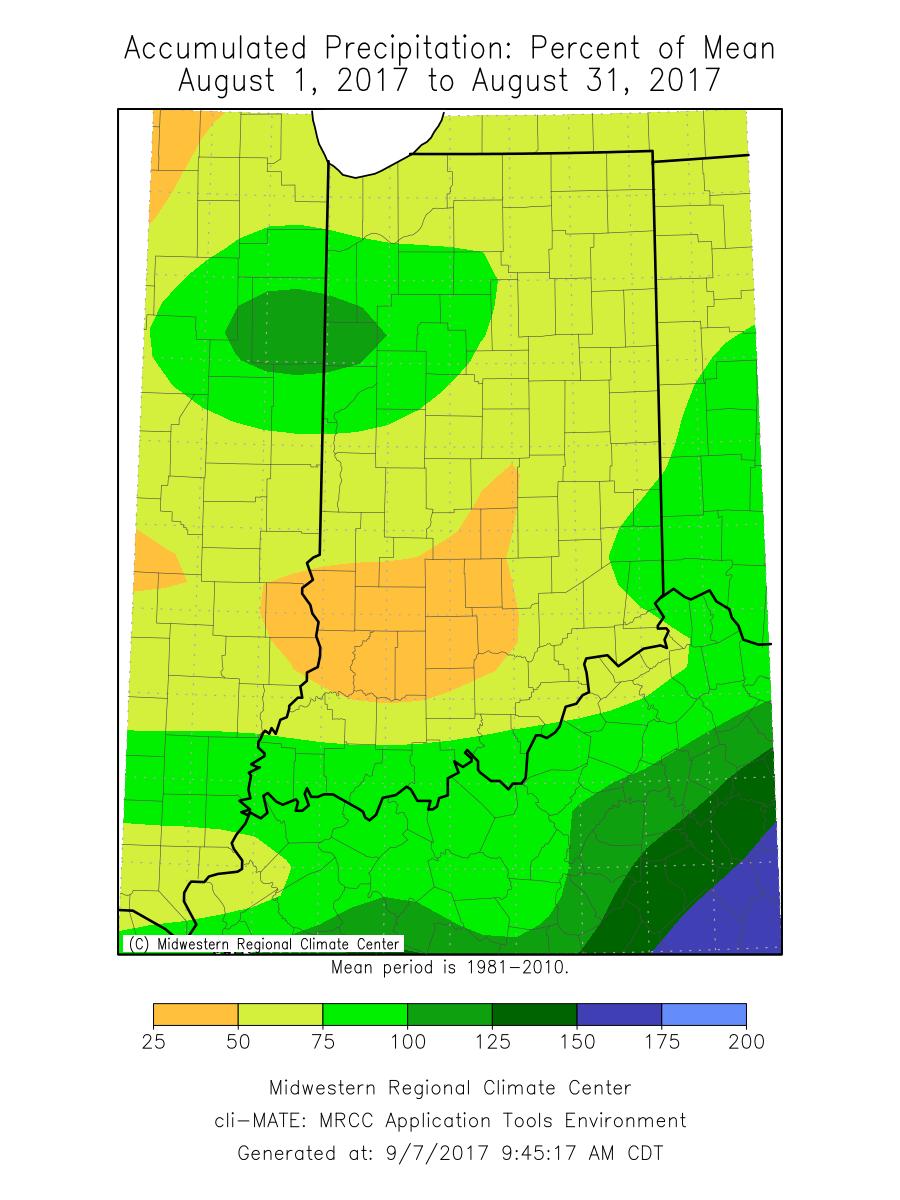
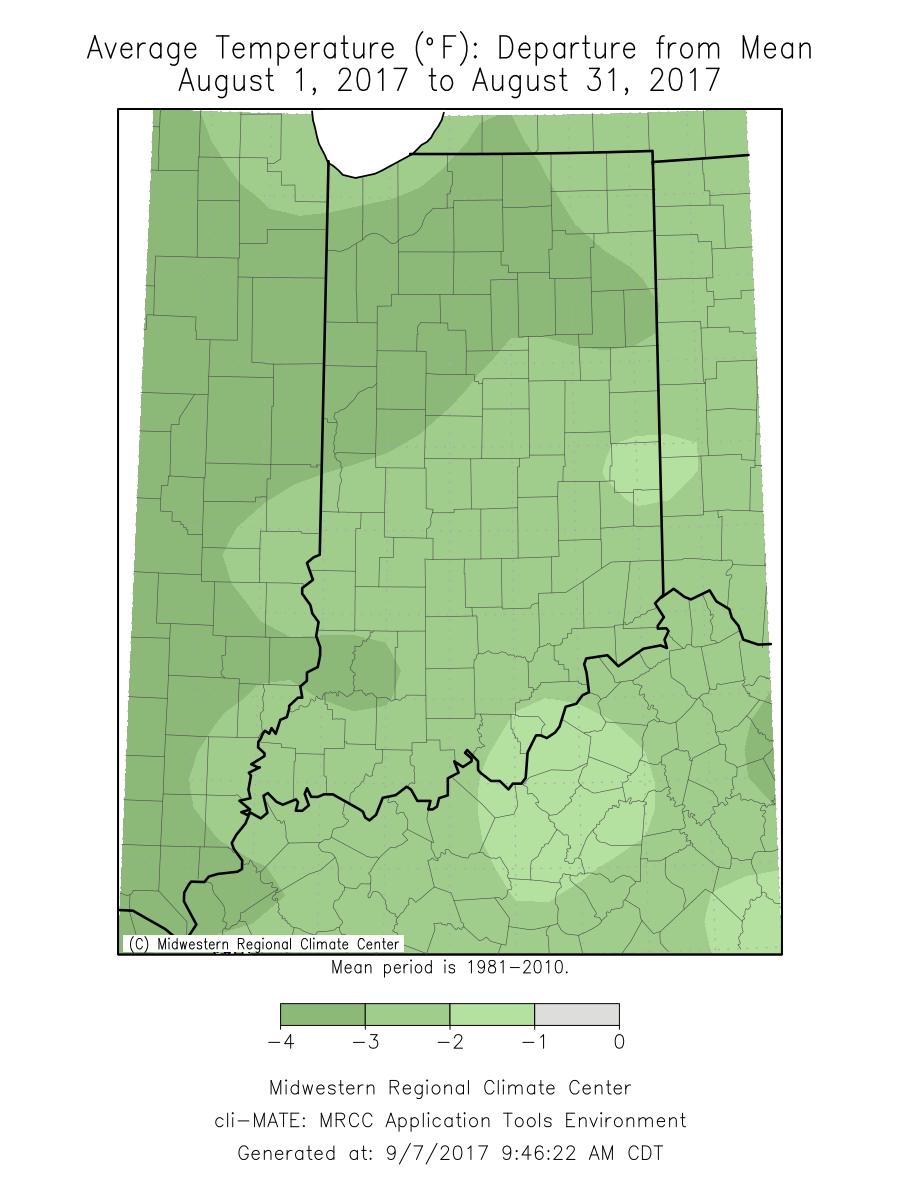
1 Ken Scheeringa And Andy Eggert Sep 7, 2017 (765) August 2017 Climate Summary Month Summary The coolest August in 13 years featured long cool and warm spells, below normal rainfall, and 6 severe weather days. Local flooding in thunderstorms on August 22 nd forced some residents in Benton county to evacuate their homes. There was one weather related death in Fulton county on August 3 rd. Despite cooler temperatures and lower evapotranspiration demand, farmers irrigated specialty crops on many August days. The August state average temperature was 70.3 F which ties 1965 as the 19 th coolest August on record. The most recent cooler August was in 2004 with 68.6 F, good for 6 th coolest. The coolest August on record came in 1927 at 66.3 F. August 2017 often had small day to day changes in average state temperature. The day split was 20 days of below normal temperature, 8 days above normal, and 3 days at normal. The daily state mean temperature was never 10 F or more above or below normal. The month included spells of 11 cool days followed by 8 warm days, then 9 cool days to the end of the month. The highest temperature of the month was 96 F at Vincennes 5ne on August 21 st. The coolest was 39 F on August 8 th at French Lick 3n. August state precipitation averaged This is 1.49 below normal and places the month as the 18 th driest August on record since The most recent drier Augusts since 2000 occurred in 2008 with 2.01 at 9 th driest, and in 2010 and 2013 with 1.84, tied for 4 th driest. The driest August on record was long ago in 1897 when the state average was just The heaviest single day precipitation among cooperative network stations in August 2017 was 2.84 on August 7 th at Evansville Fort Court. The highest in the CoCoRaHS network was 2.88 on August 29 th at Fort Wayne 8ne. The largest month total precipitation in the cooperative network was 4.81 at West Lafayette 6nw. In the CoCoRaHS network the largest total was 5.90 at Fort Wayne 4.1ne. Widespread precipitation fell on about 13 days this month. Regionally August 2017 precipitation summed to about 75% of normal across northern Indiana, and near 55% in the central and southern sections of the state. Normal August precipitation ranges from 3.6 in east central Indiana to 4.0 in the west central part of the state.
2 August 1 st 7 th The first week of August was cool with daily state mean temperatures on all 7 days at or below normal. Rainfall was recorded every day except August 1 st but totals were above normal only in northern Indiana. The July trend of frequent severe weather continued immediately in August with local hail and wind damage noted on August 1 st. Another round of wind damage followed two days later. Two counties remained with abnormally dry soils according to the USDM. Farmers made good field progress this week as crops are now well into their reproductive stages. A ridge was overhead Indiana on August 1 st. The daily state average temperature was right at normal and would remain there the next two days. The next day a cold front advanced to northern Illinois but showed signs of slowing as a low center rode the front into Michigan. By August 3 rd the cold front had stopped just short of the Indiana border and converted into a warm front on the leading edge of a low pressure system over Iowa. This low system traveled into upper Michigan the next day, dragging its cold front through Indiana. Strong high pressure had pushed south from Montana into Nebraska and prompted this reversion of the warm front back into its cold front form that advanced through Indiana. Cold Canadian air poured into Indiana and the state temperature plummeted to 7 F below normal with windy conditions. The daily state temperature would remain at this level over the next two days. The heaviest rain of the week fell as this front crossed the state. The Nebraska high center began to sprawl eastward on August 5 th and stretched from Iowa to Kentucky. Indiana was sunny and winds lightened to make for a pleasant summer day. On August 6 th the ridge shuttled east to the Appalachian Mountains. The old cold front in the Gulf states had become stationary. A low pressure wave formed at the front s western edge in Oklahoma and spawned a trough from there into southwest Indiana. Skies turned cloudy and rain started to fall in far southern Indiana. On August 7 th a low center rode up the old cold front, now a stationary front, from Oklahoma to Kentucky. As the storm passed south of the Ohio River it spread more rain across the southern tier of Indiana counties. Warmer air brought northward by the storm center helped lift the daily Indiana temperature to 4 F below normal to close out the week. Over the 7 day interval the Indiana daily state temperature averaged to 3 F below normal. Usually to start August the daily high temperature should range between 82 F and 88 F north to south. Normal daily minimum temperatures should vary from 63 F in far northern Indiana to 67 F in the southwest corner of the state. The warmest daily temperature among cooperative network stations was 91 F at Terre Haute ISU on August 2 nd. The coolest daily temperature among stations in this same network was 46 F at Farmland 5 nnw on August 4 th. Scattered rain showers fell statewide on August 2 nd. Rain covered the north half of Indiana on August 4 th and the southern half on August 7 th. The only day with no reported rainfall was August 1 st. The heaviest single day amounts were measured on August 4 th in northern Indiana when the CoCoRaHS observer near Middlebury recorded The volunteer in the vicinity of Goshen collected 2.75 and 2.50 was noted near Brook. For the week the largest totals included 3.25 at the Middlebury location, 2.75 outside Boonville, 2.45 near South Bend, 2.44 at Newburgh, and 2.39 in New Paris.
3 On the weekly rainfall totals map 2 to 3 fell in a band from Kentland to Elkhart and also between Evansville and Elizabeth. Less than a half inch was found generally in central and southwest Indiana. At least a half inch was tallied in the northern third of Indiana and in the southern tier of counties along the Ohio River. Regionally about 1.2 was received across the northern third of the state, 0.5 in the central section, and 0.7 in southern Indiana. These amounts equate to about 130% of normal in northern Indiana, 60% in central, and 70% in the southern third of the state. Isolated hail and wind damage were reported in a few counties on August 1 st and 3 rd. On August 1 st 1.0 diameter hail were noted in Hamilton and Clark counties. Tree limbs fell in Hamilton county while trees and utility lines were downed in Rush county due to high winds. Wind gust damage was reported in northern Indiana on August 3 rd. Two trees fell on power lines in Porter county with more trees down in Huntington county. A man was killed in Fulton county when his moped ran into a tree lying on a state highway that had been ripped down by high winds. Wind speeds that day were estimated at 60 mph in Howard county to the south. There was no change in areas designated with abnormally dry soils since the previous week according to the US Drought Monitor edition of August 8 th. Only all of Elkhart county and the northwest half of adjacent Lagrange county were rated in the D0 category. The remainder of the state was declared to be in normal soil moisture status for this time of year. The D0 region covered 2% of total Indiana land area. According to the USDA Indiana Crop Weather bulletin edition of August 7 th, weather this week helped farmers make good field progress, especially with hay making. Earlier in the week some farmers continued irrigation on specialty crops. About half the state corn crop was rated in good to excellent condition while soybean condition was similar. Some hail damage to crops was evident in northwest Indiana. Growth stage continues to vary widely from field to field. Weeds and disease problems persist although pastures and livestock were in very good shape due to the cooler temperatures.
4 August 8 th 14 th The cool spell continued. Through the first 14 days of August the daily state average temperature has yet to reach normal. Temperatures this second week have not only been cool but extremely stable with a maximum range of just 3 F! The week was very dry at less than 20% of normal precipitation. More counties have been designated as having abnormally dry soils according to the US Drought Monitor. Farmers irrigated crops this week which were well on their way in the reproductive stage. There was one isolated wind gust report. August 8 th was cool in Indiana with a state average temperature 5 F below normal. A ridge of high pressure moved from Iowa to overhead Indiana the next day. This ridge remained in place but weakened on August 10 th, allowing the advance of a low pressure system into Minnesota and a southern trough into Kentucky. A warm front over Wisconsin and Michigan helped nudge the Indiana state temperature upward to 3 F below normal. The Minnesota low traveled to Michigan on August 11 th, dragging its cold front into northwest Indiana. The state temperature edged higher to 2 F below normal ahead of this front, but behind it slightly cooler air was on its way from the Dakotas. The cold front passed completely through Indiana on August 12 th. High pressure transported the new air mass into the state, lowering the temperature just a tad to 3 F below normal. The next day the ridge settled directly over Indiana and spread throughout the Great Lakes. The Indiana temperature dipped to 5 F below normal with sunny skies and light winds. The ridge slid east to New England on August 14 th, setting up a warming backflow into Indiana. Moisture overran two warm fronts south of the Ohio River, setting up showers over southern Indiana. The state temperature rose to 2 F below normal to close out the week. Over the 7 days the state temperature varied little and averaged to 4 F below normal. Typically in the second week of August the daily maximum temperature would range between 81 F and 88 F north to south across the state. Daily minimum temperatures should vary from 62 F in far northern Indiana to 66 F in the southwest corner of the state. The warmest temperature of the week observed by cooperative network stations was 89 F on August 11 th at Terre Haute ISU and Vincennes 5 ne. The coolest temperature among stations in this same network was 39 F on August 8 th at French Lick 3n. Rainfall was observed on 4 days this week. Rain fell mostly in southern Indiana on August 8 th, 12 th, and 14 th and in northern Indiana only on August 11 th. No rainfall was tallied on the mornings of August 9 th, 10 th, and 13 th. On no days did it rain statewide. The heaviest single day amounts were recorded on August 12 th with 1.01 near North Vernon and 0.97 outside Greensburg. The previous day 0.59 fell in the South Bend vicinity, 0.53 near Leesburg, and 0.52 at Hudson. The largest weekly totals included 1.04 outside North Vernon, 1.03 around Greensburg, 0.65 northwest of Bedford, 0.48 just outside Goshen, and 0.47 at Wakarusa. On the weekly precipitation map no rain was recorded in 15 to 20 counties just north of central Indiana and in the far northwest counties of the state. Almost an inch was measured in the Decatur and Jennings county region. In much of the rest of Indiana up to a quarter inch was common. Regionally about 0.10 was noted across northern, central, and southern Indiana. This equates to 10% of normal in northern and southern Indiana and 20% of normal in the central part of the state.
5 Just one wind gust report was received this week. A 58 mph gust was measured at the Michigan City lighthouse in Laporte county on August 10 th but no damage was noted. The drier than normal August to date has begun to dry out Indiana soils. Besides the existing D0 abnormally dry region in Elkhart and Lagrange county, a new area of abnormally dry D0 category land has been designated by the US Drought Monitor in its August 15 th edition. The new D0 region adds parts of 11 counties stretching roughly southeast from Vermillion to Johnson county, then southwest on to Monroe county. The two D0 regions sum to 10% of total Indiana land area rated in D0 category status. The remaining 90% of state area continued in normal soil moisture status for this time of year. The August 14 th edition of the USDA Weather Crop Report for Indiana also made note of the August dryness. Many farmers stated they were irrigating crops as the critical reproductive stage was underway. The cooler than normal temperatures helped slow down crop water demand, however. Corn and soybeans were more than two-thirds the way through reproduction. Conditions of both crops continued to be rated about 50% in good to excellent condition. Some signs of drought stress were showing. Yet pasture and livestock condition persisted at the good rating. August 15 th 21 st The August temperature cycle flipped this week from cool to warm. The Indiana daily average temperature rose above normal for the first time this month on August 15 th and remained above normal all week long. What did not change was the small average temperature range, again just 3 F. Rainfall was recorded every day someplace in Indiana but totals were generally below normal. There were 2 local severe weather events reported. Farmers irrigated daily to relieve crop stress. There was a minor increase in Indiana land area rated as abnormally dry. Indiana was wedged between two stationary fronts on its northern and southern borders on August 15 th. The state average temperature broke through the daily normal threshold for the first time with a daily average at 2 F above normal. The next day the two stationary fronts merged over southern Indiana. The state temperature lifted slightly to 3 F above normal.
6 A low center in Nebraska traveled to Minnesota on August 17 th, tugging the stationary front north through Indiana as a warm front. The system cold front was positioned in Illinois, forming a warm sector overhead Indiana. There was only slight movement in the state temperature though, rising to 4 F above normal. The next day the Illinois cold front pushed east across and through Indiana, forming a cold pocket where the warm sector had been. The state temperature dipped a few degrees to 2 F above normal. The cold front surged east to the Atlantic Ocean on August 19 th and a weak ridge slid over Kentucky. The Indiana state temperature nudged upward to 3 F above normal. A new stationary front settled east to west across central Illinois. The next day a low center developed over Minnesota, converting the Illinois stationary front into a warm front that extended from the low center into southern Indiana. High pressure over Alabama established a new warm backflow into Indiana behind the warm front. The state temperature edged slowly up to 3 F above normal. Weather fronts over Indiana continued to be weak. On August 21 st the warm front stalled as a stationary front over northern Indiana. Warm air continued flowing in from the Gulf states, however, closing the week with an Indiana state temperature at 5 F above normal, the warmest day of the week. Over the 7 days the state temperature averaged to 3 F above normal. Usually around mid-august the daily maximum temperature across Indiana should range between 81 F in far northern counties to 88 F in the southwest corner of the state. Daily minimums normally very between 62 F and 66 F north to south across the state. The warmest temperature of the week according to stations in the cooperative observation network was 96 F at Vincennes 5ne on August 21 st. The coolest temperature among stations in this same network was 46 F at Terre Haute ISU on August 20 th. Rain was observed on all 7 days but only on August 18 th was coverage close to statewide. Rain was reported in northern Indiana on August 19 th and 21 st and only along the Ohio River on August 15 th and 20 th. The heaviest single day amounts were found in the CoCoRaHS morning report of August 18 th with 1.80 near Cannelton, 1.67 at Angola, and 1.53 in the Kendallville vicinity. The heaviest weekly totals included 1.80 at Crown Point and near Cannelton, 1.72 outside Hudson, 1.46 at Auburn, and 1.38 in North Webster. On the weekly precipitation map more than 2 fell in far northeast Indiana, especially in Noble, DeKalb, and Steuben counties. At least a quarter inch was tallied mostly in the northern third of Indiana, along the Ohio border, and along the Ohio River. Less than a quarter inch was common elsewhere across the state. Regionally about 0.6 was noted across the northern third of Indiana, 0.4 across central counties, and 0.5 in the south. These amounts equate to about 70% of normal in northern and southern Indiana, and 50% of normal across the central part of the state. There were two isolated severe weather events reported this week. On August 20 th hail to 1.25 in diameter was observed in White county. Wind gusts ripped down one large tree in Jasper county that same day. The US Drought Monitor edition of August 22 nd slightly relocated the northern edge of the existing D0 category area in west central and south central Indiana. The new expanded abnormally dry D0 category land now also includes all of Vermillion, the south half of Warren, nearly all of Fountain, all of Montgomery, and most of Hendricks counties. The change in this region brings statewide D0
7 category coverage to 13% of total Indiana land area. The remaining 87% continues in normal soil moisture status according to the USDM product. Farmers ran irrigation systems where possible across Indiana in the midst of another dry week according to the August 21 st edition of the USDA Weather Crop bulletin. There wasn t enough rain to benefit corn and soybeans which have shown moisture stress in non-irrigated areas. Both corn and soybeans continued with about 50% of crops rated in good to excellent condition. Heavy weed problems persist and diseases are showing up in corn according to the weekly report. Some livestock were under heat stress and pastures needed water. August 22 nd 31 st The eighth day of a warm spell concluded on August 22 nd. The remainder of August was cool with nine consecutive days of below normal daily average temperature. Only two fronts entered Indiana during the 10 day interval, one on August 23 rd and the other on August 31 st. Rainfall was near normal in northern Indiana but trended drier southward to the Ohio River. The Indiana Crop Weather bulletin noted some pastures were showing dryness. There were two isolated reports of wind damage over the 10 day interval. A week long warm spell was underway on August 22 nd. The state temperature stood at 2 F above normal. A stationary front across central Indiana fizzled but a cold front was entering northwest Indiana with locally heavy thunderstorms. A strong ridge of high pressure behind the front muscled the cold front quickly through the state and into the Gulf states the next day. Rainfall tapered off and the state temperature plummeted to 5 F below normal. The ridge sprawled to cover the entire east half of the country on August 24 th. The old cold front had advanced to the Atlantic and Gulf coastlines from Virginia to Texas. Cool air continued pouring into Indiana, lowering the state temperature to 7 F below normal. The huge ridge began to collapse the next day and its core shrank to include most of Wisconsin, Michigan, and Indiana. The coldest air of the 10 days now settled over Indiana with the state temperature at 8 F below normal. Winds began to shift to the southwest. On August 26 th the Michigan ridge edged slightly eastward. The Indiana state temperature remained unchanged with mostly sunny skies and light winds. A storm system in South Dakota
8 planted a warm front in Minnesota while Hurricane Harvey made landfall in Texas. The ridge departed Indiana the next day allowing the South Dakota storm to enter Wisconsin, its warm front in Illinois, and its cold front over Iowa, defining a very narrow warm sector. The Indiana state temperature nudged upward to 7 F below normal. The cold front outran the warm front on August 28 th, forming an occluded front in Illinois. Rain showers developed in Indiana ahead of the occluded front as a trough formed. The state temperature rose to 5 F below normal. By the next day the occluded front had dissolved while the trough and showers remained. The warming continued with the state temperature at 2 F below normal. On August 30 th Hurricane Harvey made its final landfall and moved into Louisiana. The Indiana trough moved to Ohio and was linked to the hurricane. Weak high pressure in Iowa spread to Indiana. The state temperature was not affected, still at 2 F below normal. High pressure over Manitoba forced a Wisconsin cold front south over northern Indiana, where it became stationary on August 31 st. A reinforcement of cool air filtered into Indiana. The state temperature closed the month at 3 F below normal. Over the 10 day interval the state temperature averaged to 5 F below normal. Usually near the end of August daily maximum temperatures should range between 80 F and 88 F north to south. Daily minimums normally vary from 61 F in far northern counties to 64 F in the southwest corner of the state. The warmest temperature in the cooperative observer network over these 10 days was 95 F at Terre Haute ISU on August 22 nd. The coolest temperature among stations in this same network was 44 F at Goshen Airport on August 25 th. According to morning CoCoRaHS reports rain fell generally statewide on August 23 rd and 29 th, and statewide except in southeast Indiana on August 22 nd and 28 th. No rain was reported on August 24 th, 26 th, and 27 th, and only scattered amounts on August 25 th and 31 st. The largest single day amounts were recorded near Fort Wayne with 4.00 on August 30 th and 2.88 on the previous day. The CoCoRaHS observer in the nearby town of Leo had 2.86 on August 30 th. Earlier Kentland had 2.63 on August 22 nd and an Indianapolis observer had 2.57 on August 29 th. Some heavier 10 day totals included 2.39 at Indianapolis, 2.35 in rural West Lafayette, and 2.22 at Greenwood. On the weekly precipitation map totals of 2 to 4 fell in spots of Benton, Allen, Marion, and Rush counties. Sums of 1 to 2 were noted mostly north of a Greencastle to Peru to Decatur line except near Michigan, including most of Marion, Shelby, Rush, Bartholomew, and Decatur counties, and parts of south central Indiana. Elsewhere about 1 was common. Regionally in the 10 days about 1.1 fell across northern and central Indiana with 0.7 across the south. These totals equate to near normal in northern Indiana, 90% of normal in central areas, and 60% of normal in southern Indiana. Heavy thunderstorms on August 22 nd caused flooding in northwest Indiana. Some homes in Benton county were flooded with 3 feet of water requiring residents to evacuate. Local disaster teams assisted with the cleanup. There were two isolated wind damage reports. On August 28 th wind gusts downed a large tree and limbs in Whitley county. The next day a town east of Fort Wayne in Allen county lost power due to wind gusts in that area.
9 Existing dry areas in west central Indiana and near the Michigan border did not benefit much from rain which fell during the 10 days. The US Drought Monitor edition of August 29 th shows no change in the extent of abnormally dry soils since the week prior. State coverage by abnormally dry D0 category soils remains at 13% of total Indiana land area. The remaining 87% continues in normal soil moisture status. According to the August 28 th edition of the USDA Indiana Crop Weather report, more pastures are drying out due to the cool dry week but hay harvesting is doing well. Small areas of crop harvesting have begun. The report mentions the local extreme rainfall in Benton county. Overall about half the corn and soybean crop is still rated in good to excellent condition.
10 August 2017 Temperature Region Temperature Normal Deviation Northwest North Central Northeast West Central Central East Central Southwest South Central Southeast State Precipitation Region Precipitation Normal Deviation Percent of Normal Northwest North Central Northeast West Central Central East Central Southwest South Central Southeast State
11 Summer (June - August) Temperature Region Temperature Normal Deviation Northwest North Central Northeast West Central Central East Central Southwest South Central Southeast State Precipitation Region Precipitation Normal Deviation Percent of Normal Northwest North Central Northeast West Central Central East Central Southwest South Central Southeast State
12 2017 Annual so far (Jan - Aug) Temperature Region Temperature Normal Deviation Northwest North Central Northeast West Central Central East Central Southwest South Central Southeast State Precipitation Region Precipitation Normal Deviation Percent of Normal Northwest North Central Northeast West Central Central East Central Southwest South Central Southeast State
13
14
15

16 Drought Summary from the U.S. Drought Monitor Below is a drought summary for the state of Indiana from the U.S. Drought Monitor. Areas in white are not experiencing any drought. Yellow areas are abnormally dry, but not considered a drought. Drought begins when the moisture levels become more severe, with beige, orange, red, and brown indicating increasing levels of drought (moderate, severe, extreme, and exceptional, respectively). The table below indicates what percentage of the state is drought free, and how much of the state is in drought by degree of severity (D1 - D4 category).
17 Aug 1 st Drought Summary
18 Aug 8 th Drought Summary
19 Aug 15 th Drought Summary
20 Aug 22 nd Drought Summary
21 Aug 29 th Drought Summary
October 2011 Climate Summary
 Ken Scheeringa and Kayla Hudson Nov 4, 2011 http://www.iclimate.org October 2011 Climate Summary Month Summary October weather evolved as a two part story. Weather conditions the first half of the month
August 2013 Climate Summary
 Ken Scheeringa and Matt Price Sep 6, 2013 (765) 494-8105 http://www.iclimate.org August 2013 Climate Summary Month Summary August weather began cool and wet but became progressively warmer and drier through
July 2007 Climate Summary
 Dan Bowman (765) 494-6574 Sep 3, 2007 http://www.iclimate.org Summary July 2007 Climate Summary The month of July ended as a very unusual month. Many events occurred during the month of July that is not
September 2016 Climate Summary
 Ken Scheeringa And Andy Eggert Oct 6, 2016 (765) 494-8105 http://www.iclimate.org September 2016 Climate Summary Month Summary The warmest September in 77 years brought alternating weeks of dry and wet
August 2015 Climate Summary
 Ken Scheeringa And Mary Rose Mangan Sep 4, 2015 (765) 494-8105 http://www.iclimate.org August 2015 Climate Summary Month Summary A very active wet summer weather pattern turned much calmer and drier in
November 2012 Climate Summary
 Ken Scheeringa and Kayla Hudson Dec 6, 2012 (765) 494-8105 http://www.iclimate.org November 2012 Climate Summary Month Summary November was one of those rare weather months in Indiana when not much happened:
May 2018 Climate Summary
 Ken Scheeringa and Andy Eggert Jun 7, 2018 (765) 494-8105 http://www.iclimate.org May 2018 Climate Summary Month Summary As the calendar turned from April to May temperatures flipped dramatically away
October 2017 Climate Summary
 Ken Scheeringa and Andy Eggert Nov 6, 2017 (765) 494-8105 http://www.iclimate.org October 2017 Climate Summary Month Summary After more than three weeks of warm temperatures October turned suddenly cold
November 2015 Climate Summary
 Ken Scheeringa And Mary Rose Mangan Dec 8, 2015 (765) 494-8105 http://www.iclimate.org November 2015 Climate Summary Month Summary November was much warmer than normal while precipitation was very near
August 2006 Summary. August 1-5
 Ashley Brooks (765) 494-6574 Sep 8, 2006 http://www.iclimate.org August 1-5 August 2006 Summary The heat wave that started during the end of July continued into the beginning parts of August with temperatures
December 2011 Climate Summary
 Ken Scheeringa and Kayla Hudson Jan 17, 2012 (765) 494-8105 http://www.iclimate.org December 2011 Climate Summary Month Summary What a difference a year makes! A year ago the misery of a harsh, cold, and
January 2017 Climate Summary
 Ken Scheeringa And Andy Eggert Feb 8, 2017 (765) 494-8105 http://www.iclimate.org January 2017 Climate Summary Month Summary The warmest January in 11 years was nearly 4 F warmer than December 2016. An
May 2016 Climate Summary
 Ken Scheeringa And Andy Eggert Jun 6, 2016 (765) 494-8105 http://www.iclimate.org May 2016 Climate Summary Month Summary Cold weather dominated in May until the last week of the month. May began wet but
March 2014 Climate Summary
 Ken Scheeringa And Matt Price Apr 8, 2014 (765) 494-8105 http://www.iclimate.org March 2014 Climate Summary Month Summary Winter had officially ended by the calendar but snow and cold persisted in Indiana
January 2008 Climate Summary
 Joseph Mays (765) 494-6574 Feb 5, 2008 http://www.iclimate.org Summary January 2008 Climate Summary January was a mix bag of conditions, with an oscillatory pattern developing. We experienced phases of
February 2017 Climate Summary
 Ken Scheeringa And Andy Eggert Mar 9, 2017 (765) 494-8105 http://www.iclimate.org February 2017 Climate Summary Month Summary February 2017 was the warmest February in Indiana since state climate records
September 2005 Climate Summary
 Ashley Brooks (765) 494-6574 Oct 5, 2005 http://iclimate.org September 2005 Climate Summary September 1-7 A cold front came through on the 1 st of the month, however little moisture was associated with
September 2011 Climate Summary
 Ken Scheeringa and Kayla Hudson Oct 5, 2011 (765) 494-8105 http://www.iclimate.org September 2011 Climate Summary Month Summary The final blast of summer heat arrived at the start of September. It lasted
November 2016 Climate Summary
 Ken Scheeringa And Andy Eggert Dec 15, 2016 (765) 494-8105 http://www.iclimate.org November 2016 Climate Summary Month Summary Unseasonably warm, pleasant, and sunny weather the first half of the month
June 2016 Climate Summary
 Ken Scheeringa And Andy Eggert Jul 8, 2016 (765) 494-8105 http://www.iclimate.org June 2016 Climate Summary Month Summary June was a warm month with below normal temperature on just 6 days. Rainfall was
October 2014 Climate Summary
 Ken Scheeringa And Matt Price Nov 10, 2014 (765) 494-8105 http://www.iclimate.org October 2014 Climate Summary Month Summary October featured a mix of weather. A very wet first half of the month evolved
May 2015 Climate Summary
 Ken Scheeringa And Mary Rose Mangan Jun 8, 2015 (765) 494-8105 http://www.iclimate.org May 2015 Climate Summary Month Summary May was a very warm month. Rainfall averaged near normal but was distributed
October 2016 Climate Summary
 Ken Scheeringa And Andy Eggert Nov 9, 2016 (765) 494-8105 http://www.iclimate.org October 2016 Climate Summary Month Summary October was the 9 th month so far this year to average above normal in temperature.
March 2018 Climate Summary
 Ken Scheeringa and Andy Eggert Apr 5, 2018 (765) 494-8105 http://www.iclimate.org March 2018 Climate Summary Month Summary March turned cold with below normal temperatures on two-thirds of its days. Along
January 2006 Climate Summary
 Ashley Brooks (765) 494-6574 Feb 9, 2006 http://www.iclimate.org January 1-3 January 2006 Climate Summary Unseasonably warm conditions welcomed in the New Year with highs in the 40s across the northern
November 2014 Climate Summary
 Ken Scheeringa And Matt Price Dec 10, 2014 (765) 494-8105 http://www.iclimate.org November 2014 Climate Summary Month Summary Unseasonable cold headlined the Indiana and national news in November. The
March 2016 Climate Summary
 Ken Scheeringa And Andy Eggert Apr 8, 2016 (765) 494-8105 http://www.iclimate.org March 2016 Climate Summary Month Summary Count March as the 7 th month in a row that the state average temperature has
May 2005 Climate Summary
 Ashley Brooks (765) 494-6574 Jun 7, 2005 http://iclimate.org May 2005 Climate Summary May 1-5 Early May was characterized by an upper-level trough that was in place over Indiana that brought in very cool
September 2012 Climate Summary
 Ken Scheeringa and Kayla Hudson Oct 5, 2012 (765) 494-8105 http://www.iclimate.org September 2012 Climate Summary Month Summary Summer slipped away and it felt a lot more like autumn in Indiana this month
April 2013 Climate Summary
 Ken Scheeringa and Kayla Hudson May 6, 2013 (765) 494-8105 http://www.iclimate.org April 2013 Climate Summary Month Summary Temperatures bounced high and low this month, keeping Hoosiers guessing which
April 2016 Climate Summary
 Ken Scheeringa And Andy Eggert May 9, 2016 (765) 494-8105 http://www.iclimate.org April 2016 Climate Summary Month Summary One month but two seasons. The first half of April was cold with snow. Wind damage
October 2012 Climate Summary
 Ken Scheeringa and Kayla Hudson Nov 8, 2012 (765) 494-8105 http://www.iclimate.org October 2012 Climate Summary Month Summary In a reversal from the hot and dry summer, cooler and wetter than normal conditions
November 2010 Climate Summary
 Ken Scheeringa (765) 494-8105 Dec 6, 2010 http://www.iclimate.org November 2010 Climate Summary Summary A four month drought in Indiana is collapsing as significant rain fell the final week of November.
January 2018 Climate Summary
 Ken Scheeringa and Andy Eggert Feb 8, 2018 (765) 494-8105 http://www.iclimate.org January 2018 Climate Summary Month Summary January temperature swings were amazing. In the first few days arctic cold pushed
March 2009 Climate Summary
 Joseph Mays (765) 494-6574 Apr 1, 2009 http://www.iclimate.org Summary March 2009 Climate Summary March is in the books and it continued the trend of extreme weather we have experienced during the first
April 2017 Climate Summary
 Ken Scheeringa And Andy Eggert May 8, 2017 (765) 494-8105 http://www.iclimate.org April 2017 Climate Summary Month Summary April was a very warm and wet month in Indiana, nearly setting a new monthly temperature
April 2015 Climate Summary
 Ken Scheeringa And Mary Rose Mangan May 8, 2015 http://www iclimate org April 2015 Climate Summary Month Summary April was a month of extremes. Severe weather erupted on 4 days of the first week with multiple
The hydrologic service area (HSA) for this office covers Central Kentucky and South Central Indiana.
 for this office covers Central Kentucky and South Central Indiana.") January 2012 February 13, 2012 An X inside this box indicates that no flooding occurred within this hydrologic service area. January 2012 continued the string of wet months this winter. Rainfall was generally
January 2012 February 13, 2012 An X inside this box indicates that no flooding occurred within this hydrologic service area. January 2012 continued the string of wet months this winter. Rainfall was generally
National Wildland Significant Fire Potential Outlook
 National Wildland Significant Fire Potential Outlook National Interagency Fire Center Predictive Services Issued: September, 2007 Wildland Fire Outlook September through December 2007 Significant fire
July 2010 Climate Summary
 Ken Scheeringa (765) 494-8105 Aug 4, 2010 http://www.iclimate.org July 2010 Climate Summary Summary The warm summer of 2010 continues. Daily state average temperatures were above normal on all but seven
August 2016 Climate Summary
 Ken Scheeringa And Andy Eggert Sep 12, 2016 (765) 494-8105 http://www.iclimate.org August 2016 Climate Summary Month Summary Hot but tranquil weather the first half of August transitioned to a tormented
2012 Growing Season Weather Summary for North Dakota. Adnan Akyüz and Barbara A. Mullins Department of Soil Science October 30, 2012
 2012 Growing Season Weather Summary for North Dakota Adnan Akyüz and Barbara A. Mullins Department of Soil Science October 30, 2012 Introduction The 2012 growing season (the period from April through September)
June 2010 Climate Summary
 Ken Scheeringa (765) 494-8105 Jul 6, 2010 http://www.iclimate.org June 2010 Climate Summary Summary Summer like heat and humidity arrived in Indiana on May 22 nd and dominated our weather scene nearly
November 2017 Climate Summary
 Ken Scheeringa and Andy Eggert Dec 8, 2017 (765) 494-8105 http://www.iclimate.org November 2017 Climate Summary Month Summary November temperatures alternated spells of warm and cool while precipitation
July 2011 Climate Summary
 Ken Scheeringa (765) 494-8105 Aug 8, 2011 http://www.iclimate.org July 2011 Climate Summary Month Summary The upper atmospheric high pressure dome which baked the Texas area in heat and drought the past
The hydrologic service area (HSA) for this office covers Central Kentucky and South Central Indiana.
 for this office covers Central Kentucky and South Central Indiana.") MONTH YEAR January 2011 February 15, 2011 X An X inside this box indicates that no flooding occurred within this hydrologic service area. January 2011 was drier than normal in all locations in the area.
MONTH YEAR January 2011 February 15, 2011 X An X inside this box indicates that no flooding occurred within this hydrologic service area. January 2011 was drier than normal in all locations in the area.
Crop / Weather Update
 Crop / Weather Update Corn Crop Condition Percent of Acreage Rated Good or Excellent 85 80 75 70 65 60 55 50 45 The U.S. corn crop was rated 69% good-to-excellent on September 23, up 1% from week-ago,
National Drought Summary August 14, 2018
 National Drought Summary August 14, 2018 The discussion in the Looking Ahead section is a description of what the official national guidance from the National Weather Service (NWS) National Centers for
New Hampshire State Climate Office Dr. Mary D. Stampone, State Climatologist
 New Hampshire State Climate Office Dr. Mary D. Stampone, State Climatologist University of New Hampshire c/o Department of Geography 73 Main Street Durham, NH 03824 Phone: 603-862-3136 Fax: 603-862-4362
Crop / Weather Update
 Crop / Weather Update Corn Crop Condition Percent of Acreage Rated Good or Excellent 85 80 75 70 65 60 55 50 45 As of September 9, USDA rates the crop at 68% good to excellent. The rating is up one point
Crop / Weather Update
 Crop / Weather Update Corn Crop Condition Percent of Acreage Rated Good or Excellent 85 80 75 70 65 60 55 50 45 In its weekly Crop Progress Report for September 16, the USDA stated the 18-state average
The Pennsylvania Observer
 The Pennsylvania Observer August 3, 2015 July 2015 - Pennsylvania Weather Recap By: Arthur Person Although this seventh month of 2015 was fairly normal across Pennsylvania as a whole, the details reveal
The Pennsylvania Observer
 The Pennsylvania Observer September 3, 2008 Summer 2008 Weather Summary Written by: Brian Thompson The opening days of June started dry, but a warm front brought a widespread rain a couple of days into
June 2015 Climate Summary
 Ken Scheeringa And Mary Rose Mangan Jul 10, 2015 (765) 494-8105 http://www.iclimate.org June 2015 Climate Summary Month Summary Indiana set a new June rainfall record this month with a state average 8.99.
Champaign-Urbana 1999 Annual Weather Summary
 Champaign-Urbana 1999 Annual Weather Summary ILLINOIS STATE WATER SURVEY 2204 Griffith Dr. Champaign, IL 61820 wxobsrvr@sws.uiuc.edu Maria Peters, Weather Observer A major snowstorm kicked off the new
NWS FORM E-5 U.S. DEPARTMENT OF COMMERCE HSA OFFICE:
 NWS FORM E-5 U.S. DEPARTMENT OF COMMERCE HSA OFFICE: NOAA, NATIONAL WEATHER SERVICE MONTHLY REPORT OF RIVER AND FLOOD CONDITIONS DATE: TO: North Webster, IN REPORT FOR (MONTH &YEAR): July 1998 August 5,
NATIONAL WEATHER SERVICE
 January 2016 February 9, 2016 This was a dry month across the HSA despite one large and several smaller snowfalls. Most locations ended up 1-2 inches below normal for the month. The driest locations at
February 2016 Climate Summary
 Ken Scheeringa And Andy Eggert Mar 9, 2016 (765) 494-8105 http://www.iclimate.org February 2016 Climate Summary Month Summary February was the 6 th consecutive month with an above normal state average
KANSAS CLIMATE SUMMARY August 2015
 KANSAS CLIMATE SUMMARY August 2015 Cool and Dry August was drier than normal in most of the state. State-wide average precipitation was 2.80 inches or 85 percent of normal. The Northeast division of the
Monthly Long Range Weather Commentary Issued: July 18, 2014 Steven A. Root, CCM, President/CEO
 Monthly Long Range Weather Commentary Issued: July 18, 2014 Steven A. Root, CCM, President/CEO sroot@weatherbank.com JUNE 2014 REVIEW Climate Highlights The Month in Review The average temperature for
January 2012 Climate Summary
 Ken Scheeringa and Kayla Hudson Feb 6, 2012 (765) 494-8105 http://www.iclimate.org January 2012 Climate Summary Month Summary Where is winter? This question found its way into many conversations throughout
Crop / Weather Update
 Crop / Weather Update Corn Crop Condition Percent of Acreage Rated Good or Excellent 85 80 75 70 65 60 55 50 45 Corn condition this week is the same as the last two weeks in the good/excellent category,
The Weather Wire. Contents: Summer 2018 Outlook. Summer 2018 Outlook Drought Monitor May Summary/Statistics June Preview Rainfall Totals
 The Weather Wire June 2018 Volume 25 Number 6 Contents: Summer 2018 Outlook Drought Monitor May Summary/Statistics June Preview Rainfall Totals Summer 2018 Outlook June 1 st marked the first day of meteorological
Nebraska experienced a wide
 Issue 1 August 2016 CLIMATE UPDATE A MONTHLY SUMMARY FROM THE neclimate.unl.edu August saw reprieve from dryness, cooler temps Overview Nebraska experienced a wide range of conditions across the state
Monthly Long Range Weather Commentary Issued: SEPTEMBER 19, 2016 Steven A. Root, CCM, Chief Analytics Officer, Sr. VP,
 Monthly Long Range Weather Commentary Issued: SEPTEMBER 19, 2016 Steven A. Root, CCM, Chief Analytics Officer, Sr. VP, sroot@weatherbank.com SEPTEMBER 2016 Climate Highlights The Month in Review The contiguous
April 2011 Climate Summary
 Ken Scheeringa (765) 494-8105 May 9, 2011 http://www.iclimate.org April 2011 Climate Summary Summary After somewhat of a respite in March Indiana weather ramped up with a vengeance in April. Extreme weather
January 2013 Climate Summary
 Ken Scheeringa and Kayla Hudson Feb 7, 2013 (765) 494-8105 http://www.iclimate.org January 2013 Climate Summary Month Summary Winter or spring? January featured several dramatic swings in temperature and
NATIONAL WEATHER SERVICE
 NWS Form E-5 (PRES. BY NWS Instruction 10-924) MONTHLY REPORT OF HYDROLOGIC CONDITIONS HYDROLOGIC SERVICE AREA (HSA) NORTHERN INDIANA (IWX) MONTH YEAR TO: Hydrologic Information Center, W/OS31 NOAA s National
2011 Year in Review TORNADOES
 2011 Year in Review The year 2011 had weather events that will be remembered for a long time. Two significant tornado outbreaks in April, widespread damage and power outages from Hurricane Irene in August
July 2014 Climate Summary
 Ken Scheeringa And Matt Price Aug 8, 2014 (765) 494-8105 http://www.iclimate.org July 2014 Climate Summary Month Summary July was unseasonably cool and drier than normal. Rainfall was light in parts of
Weather and Climate Summary and Forecast Summer 2017
 Weather and Climate Summary and Forecast Summer 2017 Gregory V. Jones Southern Oregon University August 4, 2017 July largely held true to forecast, although it ended with the start of one of the most extreme
WeatherManager Weekly
 Issue 288 July 14, 2016 WeatherManager Weekly Industries We Serve Agriculture Energy/Utilities Construction Transportation Retail Our Weather Protection Products Standard Temperature Products Lowest Daily
June 2011 Climate Summary
 Ken Scheeringa (765) 494-8105 Jul 8, 2011 http://www.iclimate.org June 2011 Climate Summary Month Summary The abundance of extreme weather this year extended yet another month into June. This month has
Above normal temperatures and precipitation continue across the HSA
 NWS Form E-5 (PRES. BY NWS Instruction 10-924) MONTHLY REPORT OF HYDROLOGIC CONDITIONS HYDROLOGIC SERVICE AREA (HSA) MONTH YEAR TO: Hydrologic Information Center, W/OS31 NOAA s National Weather Service
July 2015 Climate Summary
 Ken Scheeringa And Mary Rose Mangan Aug 6, 2015 (765) 494-8105 http://www.iclimate.org July 2015 Climate Summary Month Summary Record setting rainfall in June persisted into the first three weeks of July.
Table 1. August average temperatures and departures from normal ( F) for selected cities.
 for selected cities.") Climate Summary for Florida August 2016 Prepared by Lydia Stefanova and David Zierden Florida Climate Center, The Florida State University, Tallahassee, Florida Online at: http://climatecenter.fsu.edu/products-services/summaries
Climate Summary for Florida August 2016 Prepared by Lydia Stefanova and David Zierden Florida Climate Center, The Florida State University, Tallahassee, Florida Online at: http://climatecenter.fsu.edu/products-services/summaries
Weather and Climate Summary and Forecast October 2017 Report
 Weather and Climate Summary and Forecast October 2017 Report Gregory V. Jones Linfield College October 4, 2017 Summary: Typical variability in September temperatures with the onset of fall conditions evident
NWS FORM E-5 U.S. DEPARTMENT OF COMMERCE I HYDRO SERVICE AREA NOAA, NATIONAL WEATHER SERVICE I Indianapolis, IN MONTHLY REPORT
 NWS FORM E-5 U.S. DEPARTMENT OF COMMERCE I HYDRO SERVICE AREA NOAA, NATIONAL WEATHER SERVICE I Indianapolis, IN. 1-------------------- MONTHLY REPORT OF RIVER AND FLOOD CONDITIONSI REPORT FOR I November
NIDIS Weekly Climate, Water and Drought Assessment Summary. Upper Colorado River Basin July 31, 2012
 NIDIS Weekly Climate, Water and Drought Assessment Summary Upper Colorado River Basin July 31, 2012 Fig. 1: July month-to-date precipitation in inches. Fig. 2: SNOTEL WYTD precipitation percentiles (50%
Crop / Weather Update
 Crop / Weather Update The next will be published November 13, 2018, due to the Veteran s Day holiday on Monday. Corn Harvesting Progress 100% 90% 80% 70% 60% 50% 40% 30% 20% 10% 0% 9/9 9/16 9/23 9/30 10/7
Champaign-Urbana 1998 Annual Weather Summary
 Champaign-Urbana 1998 Annual Weather Summary ILLINOIS STATE WATER SURVEY Audrey Bryan, Weather Observer 2204 Griffith Dr. Champaign, IL 61820 wxobsrvr@sparc.sws.uiuc.edu The development of the El Nìno
The Pennsylvania Observer
 The Pennsylvania Observer May 31, 2012 May 2012 - Pennsylvania Weather Recap By: Paul Knight The majority of the fifth month had temperatures averaging well above seasonal levels with two distinct hot
UNITED STATES AND SOUTH AMERICA OUTLOOK (FULL REPORT) Thursday, December 28, 2017
 Thursday, December 28, 2017") T-storm Weather Summary Despite scattered t-storms Sat.-Sun. in central and northern areas in Argentina, more will likely be needed especially in sunflower areas of the southwest. Some t-storms likely
T-storm Weather Summary Despite scattered t-storms Sat.-Sun. in central and northern areas in Argentina, more will likely be needed especially in sunflower areas of the southwest. Some t-storms likely
Arizona Climate Summary May 2012
 Arizona Climate Summary May 2012 Summary of conditions for April 2012 April 2012 Temperature and Precipitation Summary April 1 st 16 th : Although April began with another low pressure system sweeping
Fronts. Direction of Front
 Fronts Direction of Front Direction of Front Warm Front A cold air mass meets and displaces a warm air mass. Because the moving cold air is more dense, it moves under the less-dense warm air, pushing it
Monthly Long Range Weather Commentary Issued: APRIL 18, 2017 Steven A. Root, CCM, Chief Analytics Officer, Sr. VP,
 Monthly Long Range Weather Commentary Issued: APRIL 18, 2017 Steven A. Root, CCM, Chief Analytics Officer, Sr. VP, sroot@weatherbank.com MARCH 2017 Climate Highlights The Month in Review The average contiguous
National Wildland Significant Fire Potential Outlook
 National Wildland Significant Fire Potential Outlook National Interagency Fire Center Predictive Services Issued: April 1, 2008 Next Issue: May 1, 2008 Wildland Fire Outlook April 2008 through July 2008
Monthly Long Range Weather Commentary Issued: May 15, 2014 Steven A. Root, CCM, President/CEO
 Monthly Long Range Weather Commentary Issued: May 15, 2014 Steven A. Root, CCM, President/CEO sroot@weatherbank.com APRIL 2014 REVIEW Climate Highlights The Month in Review The average temperature for
Champaign-Urbana 2001 Annual Weather Summary
 Champaign-Urbana 2001 Annual Weather Summary ILLINOIS STATE WATER SURVEY 2204 Griffith Dr. Champaign, IL 61820 wxobsrvr@sws.uiuc.edu Maria Peters, Weather Observer January: After a cold and snowy December,
The hydrologic service area (HSA) for this office covers Central Kentucky and South Central Indiana.
 for this office covers Central Kentucky and South Central Indiana.") NWS Form E-5 (04-2006) NATIONAL OCEANIC AND ATMOSPHERIC ADMINISTRATION (PRES. BY NWS Instruction 10-924) NATIONAL WEATHER SERVICE MONTHLY REPORT OF HYDROLOGIC CONDITIONS HYDROLOGIC SERVICE AREA (HSA) Louisville
NWS Form E-5 (04-2006) NATIONAL OCEANIC AND ATMOSPHERIC ADMINISTRATION (PRES. BY NWS Instruction 10-924) NATIONAL WEATHER SERVICE MONTHLY REPORT OF HYDROLOGIC CONDITIONS HYDROLOGIC SERVICE AREA (HSA) Louisville
CropCast Corn and Soybean Report Kyle Tapley Monday, March 20, 2017
 Accumulated Rainfall (inches) Accumulated GDDs Temperature ( F)/Wind Speed (mph) Precipitation (inches) CropCast Corn and Soybean Report Kyle Tapley Monday, March 20, 2017 Peoria, IL Regional Forecast
Weather and Climate Risks and Effects on Agriculture
 Weather and Climate Risks and Effects on Agriculture Dr. Eric Snodgrass Official Journal of the Fluid Fertilizer Foundation Vol. 26, No. 2, Issue #100 DOWNLOAD Summary: So, what do we need to watch for?
Weather and Climate Summary and Forecast December 2017 Report
 Weather and Climate Summary and Forecast December 2017 Report Gregory V. Jones Linfield College December 5, 2017 Summary: November was relatively cool and wet from central California throughout most of
January 25, Summary
 January 25, 2013 Summary Precipitation since the December 17, 2012, Drought Update has been slightly below average in parts of central and northern Illinois and above average in southern Illinois. Soil
INDIANAPOLIS, INDIANA
 The NWS FORM E-5 U.S. DEPARTMENT OF COMMERCE HYDROLOGIC SERVICE AREA: NATIONAL OCEANIC AND ATMOSPHERIC ADMINISTRATION NATIONAL WEATHER SERVICE INDIANAPOLIS, INDIANA REPORT FOR: MONTHLY REPORT OF RIVER
SIGNIFICANT EVENTS Severe Storms November 1994 January 1996 August 1998 and May 2000 March 2002 May 2002 Champaign County
 SIGNIFICANT EVENTS Severe Storms November 1994 On Nov. 1, 1994, high winds gusted over 60 mph at times across the northwest third of Ohio. The highest measured wind gust was 63 mph at Columbus Grove (Putnam).
KANSAS CLIMATE SUMMARY January 2018
 KANSAS CLIMATE SUMMARY January 2018 Some welcome moisture After an extended period with little to no moisture, parts of Kansas recorded some significant precipitation. At Tribune, a small snow event on
NATIONAL WEATHER SERVICE
 NWS Form E-5 (PRES. BY NWS Instruction 10-924) MONTHLY REPORT OF HYDROLOGIC CONDITIONS HYDROLOGIC SERVICE AREA (HSA) MONTH YEAR TO: Hydrologic Information Center, W/OS31 NOAA s National Weather Service
but 2012 was dry Most farmers pulled in a crop
 After a winter that wasn t, conditions late in the year pointed to a return to normal snow and cold conditions Most farmers pulled in a crop but 2012 was dry b y M i k e Wr o b l e w s k i, w e a t h e
Weather and Climate Summary and Forecast August 2018 Report
 Weather and Climate Summary and Forecast August 2018 Report Gregory V. Jones Linfield College August 5, 2018 Summary: July 2018 will likely go down as one of the top five warmest July s on record for many