July 2011 Climate Summary
|
|
|
- Barnard Grant
- 6 years ago
- Views:
Transcription

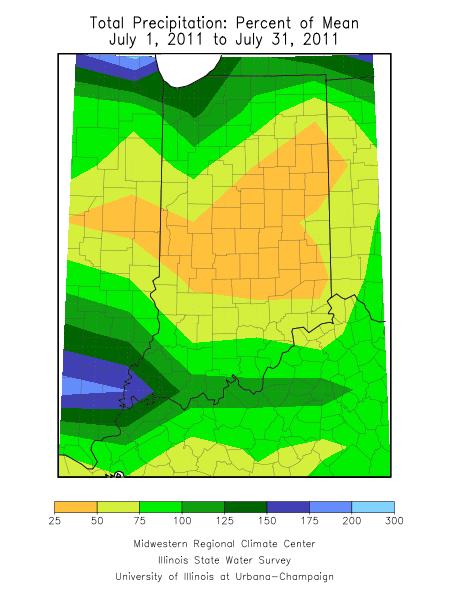
1 Ken Scheeringa (765) Aug 8, July 2011 Climate Summary Month Summary The upper atmospheric high pressure dome which baked the Texas area in heat and drought the past few months expanded to include much of the nation in July. The heat wave became the major weather event and news story in Indiana this month, reaching its peak during the week of July 18 th through 24 th. Heat related impacts included a jump in heat illness visits to hospitals, increased air conditioning sales and service calls, problems with underground utility electrical cables, and a developing drought leading to urban water restrictions. The intense heat fueled severe storms that week including an unconfirmed tornado near Kentland on July 23 rd. The early part of the month was a mix of above and below normal temperatures. The first real signs of a pending heat wave came on July 11 th when a brief surge of heat and humidity engulfed the state. The full intensity of the intolerable conditions arrived on July 18 th and continued over the next 8 days. Comparisons to past heat waves in 1995, 1988, 1941, and even 1936 were in the news. The heat wave lost some of its edge the final week of July although temperatures in Indiana remained well above normal. Taking the month as a whole the state average temperature calculates to 78.9, an impressive 4.5 above normal to place as the 5 th warmest July on record in Indiana since The warmest July in the record books was in 1936 with a monthly temperature a full 2.0 warmer than the current month! The day split in July 2011 was 2 days with below normal temperatures, 26 days above normal, and 3 days with near normal temperatures. The daily mean temperature was 10 or more above normal on two days this month. The hottest reported temperature of the month was 102 at Terre Haute on July 22 nd and the coolest at 49 in Lexington on July 14 th. On average state precipitation was about two-thirds of the July normal at 2.78 inches, a deviation of 1.40 inches below normal. This ranks July 2011 as the 24 th driest July on record in Indiana. The most recent drier July was in 2002 when the mean state precipitation was 2.76 inches, good for 22 nd driest in a tie with The driest July on record was a meager 1.29 inches which fell in Among CoCoRaHS volunteers the wettest single day occurred in Demotte with reports of 6.71 inches and 5.82 inches on July 23 rd. Regionally July precipitation averaged about 3.1 inches in northern Indiana, 1.9 inches in central, and 3.2 inches in southern Indiana. These totals are about 80% of normal in the north, 45% in central, and 75% of normal in southern sections. There were 8 days of severe weather in July including a string of 5 days between July 19 th and 23 rd during the week of intense heat. In the first two days of the month lightning jolted a police dispatcher talking on the phone and started a home fire. Two people had to be rescued from a flooded storm drain. On July 11 th heavy storms in northern Indiana flipped semi trucks in addition
2 to the usual tree damage to power lines and home roofs. But the longest stretch of severe weather came during the week of intense heat resulting in an interstate grass fire and an unconfirmed tornado, and of course, the usual wind and hail damage. One person was injured when a tree fell on a house. Week by week descriptions and details of these severe events and their impacts are found in the narratives which follow below. July 1 st 10 th Weather systems usually slow in summer months increasing the tendency for weather fronts to stall and become stationary. This trend was very evident this week as two cold fronts tried but each failed to pass through Indiana. A first cold front washed out on July 5 th, allowing warm and humid air to reclaim the state the next day. A second cold front on July 7 th also failed to reach the Ohio River, again surrendering to surging warm air from our south. It wasn t until July 9 th that a stronger cold front managed to push its way to the southern states and quiet our weather. The inability for cooler air to take control of Indiana was reflected in the state average temperatures. All 10 days of this interval had temperatures at or above normal. Warm air near the start of the interval raised temperatures on July 2 nd to 5 above normal. Stormy skies let temperatures slip a few degrees each day, falling back to normal by July 5 th. There was little temperature change the rest of the 10 days, settling into a pattern 1 to 2 above normal each day. Overall for the 10 day interval temperatures averaged 2 above normal around the state. Normally this time of year daytime high temperatures would average between 87 and 92 from north to south across Indiana. Daily minimums typically vary between 65 and 70 from far north to extreme southwest counties. Rain fell somewhere in Indiana nearly all 10 days. Severe weather was limited to the first 3 days of the month, drifting southward across the state over that time. Total rainfall averaged about 0.9 inch in northern Indiana, 0.6 inch in central, and 1.5 inch across southern Indiana over the 10 days. These amounts are near 80% of normal in northern, 50% of normal in central Indiana, and right about normal across southern Indiana. As expected rainfall was much heavier in local summer thunderstorms. Heavier amounts measured on July 8 th included 4.09 inches in Chandler, 3.65 inches at Darmstadt, and 3.37 inches in Melody Hill. Earlier in the week the CoCoRaHS observer at Michigan City recorded 4.10 inches on July 1 st while in nearby Chesterton the observer there noted 3.27 inches on July 2 nd. Over the entire 10 days the Chandler location received a total of 5.47 inches, while Newburgh recorded 4.71 inches and two reports from Boonville were 4.37 inches and 4.32 inches. Darmstadt had 4.19 inches for the 10 day interval. Severe weather action didn t wait long in July to begin. On July 1 st two Porter county residents were shaken up when they were hit by lightning while talking on the phone. In one situation officers at a police dispatch center watched sparks climb down the walls of their room just before lightning jolted the person on the phone. Hail up to 1.75 inch in diameter was noted. There were other reports of injuries and damages as the storm passed through. A small number of homes lost power during the storm. Some roads in the county were flooded but caused few traffic problems. The areal coverage and impact of severe storms the next day was much greater. A Tippecanoe county home caught fire due to a lightning strike, destroying the roof. Nearby two people were trapped inside a storm drain and had to be rescued by police and fire fighters. In other places power was lost, trees came down, and hail fell. Some witnesses saw weak storm rotation. In neighboring
3 Carroll county 3 to 4 inches of rain quickly flooded local roads. Roads were closed due to flooding in Clinton and White counties while trees and power lines came down in Boone county. To the north 2.0 inch hail fell in Lagrange while 1.0 to 2.2 inch hail was common in Laporte county. Residents of Starke county also saw 1.0 inch hail as did folks in Hendricks county in central Indiana. These storms packed plenty of high wind as well. Numerous trees fell on roads and power lines in Starke, Kosciusko, Wabash, Whitley, Fulton, Cass, Tippecanoe, Clinton, and Boone counties in northern and central Indiana. In Kosciusko county a large field irrigation system overturned. In Knox county of southern Indiana a trampoline was wrapped around a tree by high winds. The storm system continued moving south for a third day but weakened. On July 3 rd hail was reported in Dubois county but no other damage was noted. July 11 th 17 th Severe storms battered far northern and eastern counties of Indiana to start the week. But it was the oppressive combination of heat and humidity on July 11th that spread summer misery to all Hoosiers statewide. This surge of warm humid air was quickly replaced the next day by cooler air behind a cold front. The surface high pressure center behind this front moved east of Indiana after a few days but this allowed the uncomfortable warm and sticky air mass to return to Indiana to end the week. Meanwhile in the upper atmosphere a huge high pressure dome of hot air from the Texas drought region was spreading northward, poised to take over and dominate Midwest weather in the days ahead. Indiana temperatures began the week 7 above normal then cooled to as low as 3 below normal in midweek in the cooler air mass. This cooling trend was reversed on July 15 th as the surface high pressure moved east and warmer air returned on the backside southerly flow of the high center. Temperatures rebounded and the statewide average temperature climbed to 5 above normal to close out the week. Overall for the week the temperature averaged 3 above normal. Normally in mid July the daily maximum temperature would range between 87 to 91 north to south across the state. Daily minimum temperatures should vary from 66 in far northern counties to 70 in the far southwest region.
4 Rain fell the first few days of the week but amounts overall were quite light. The second half of the week was mostly dry. Totals for the week ranged from about 0.3 inch in northern Indiana, to 0.1 inch in central sections, and nearly a half inch in the south. These totals represent less than 40% of normal in northern counties, under 20% in central, and 50% of normal in southern Indiana. As is typical of summer there were localized heavy amounts in thunderstorms. On July 13 th heavy showers occurred in southwest Indiana. Some of the larger amounts measured by CoCoRaHS observers included 3.93 inches at Stendal, 3.54 inches in Princeton, 3.45 inches at Evansville, 3.41 inches in Francisco, and 2.95 inches in Petersburg. There was no additional rainfall this week at Francisco and Petersburg but Darmstadt observed 5.45 inches and Boonville 2.90 inches for the full week. Huntingburg noted 2.83 inches and Holland 2.54 inches during the week. July 11 th was an eventful weather day featuring both severe storms and extreme heat and humidity. A heat advisory was issued for many Indiana counties as temperatures moved into the 90s and dew points beyond 80 degrees, common in the tropics but rare for Indiana. The heat index soared to more than 120 in parts of southern Indiana, forcing some universities to rotate air conditioning blackouts among its buildings and curtail student athletics. The high heat indices created a very unstable air mass, ripe for the development of thunderstorms and damaging winds. Counties along the Michigan and Ohio borders experienced the worst of the severe weather that day. There were several reports of downed trees and power lines in Laporte, St Joseph, Elkhart, Lagrange, Steuben, Noble, and Whitley counties due to winds up to 70 mph. In Kosciusko county high winds brought down telephone poles. Wind gusts caused two semi trucks to roll over on I-69 at two locations in DeKalb county. Trees fell on homes and power lines in Allen and Huntington counties. To the south in Wayne county high winds in a thunderstorm tore the roof off a legacy baseball stadium. Trees fell on homes and roads causing roof damage and interfering with traffic. In central Indiana there was isolated wind damage in Hamilton county as trees fell on top of power lines and roads, and telephone poles were snapped. One inch diameter hail was reported in Randolph county while hail 1.75 inch in diameter fell in Clinton county. There was only one report of wind damage the next day in Gibson county as trees fell on top of power lines in that area.
5 July 18 th 24 th An intense heat wave dominated Indiana this entire week, reminiscent of previous episodes in 1995, 1988, and even The heat combined with unusually humid conditions to push heat indices to 115 and higher, a dangerous situation that prompted a week long excessive heat warning for those working outdoors. The most intense heat of the summer so far arrived on July 20 th and 21 st. For some cities the daily maximums above 100 were their hottest days since July and August 1988 and would become part of the warmest 8 day stretch since July Despite the mostly sunny skies there were 4 days with local severe weather events around the state. The huge high pressure dome of hot air in the upper atmosphere which originates in Texas expanded northeast into the Great Lakes region this week. A cold front entered northern Indiana on July 19 th and traveled as far south as Lafayette the next day. Here it stalled unable to advance against the strong high pressure dome and it retreated northward into Michigan by July 22 nd. The hot humid air mass resumed control of Indiana weather the final days of the week. The cold front in mid week was hardly noticeable. State average temperatures which started the week at 7 above normal actually warmed a bit each day, peaking at 10 above normal on July 21 st. Temperatures slid a bit from there to end the week at 7 above normal, the same level as a week ago. For the week overall state temperatures averaged 9 above normal. Normal daily maximum temperatures range from 86 in far northern Indiana to 92 in the southwest. Daily minimums typically vary between 67 and 71 north to south across the state. Light rain fell every day somewhere in the state despite the hot sinking air mass. The daily light showers each yielded a few hundreths inch before increasing to average near a quarter inch on the final day of the week. Total rainfall for the week averaged near 0.8 inch in northern Indiana, about 0.5 inch in central sections, and 0.7 inch across the south. These totals are about 75% of normal in northern and southern areas and barely half of normal in central Indiana. In the vicinity of the retreating cold front in northern Indiana, however, thunderstorms were heavy in isolated spots. On July 23 rd four CoCoRaHS observers near Demotte recorded highly variable amounts, ranging from 6.71 inches to 5.82 inches, 2.94 inches, and 2.80 inches. Other heavy amounts that day were 2.24 inches and 2.29 inches in Bourbon, and 2.03 inches at Hebron. Some grand totals for the week were 6.90 inches at Demotte, 2.89 inches in Angola, and 2.81 inches at Bourbon and Hebron. The intense heat is certainly impacting daily life. Indiana hospitals are reporting increased emergency room visits due to heat illnesses. Air conditioner sales around Indiana are brisk in home supply stores. Some cities are opening cooling centers for residents without home air conditioning. Businesses with outdoor sales have noticed a sharp drop off in customers due to the extremely uncomfortable conditions. Even our infrastructure struggles with the heat. Utility companies have had to reduce the voltage of its underground supply lines to avoid overheating caused by high electrical demand. Some utilities have implemented rolling power blackouts. Indianapolis has ordered residents to stop watering lawns to curtail water demand. Field crops are suffering right along with people. Most corn was planted later in the wet spring and pollination was delayed until a later and hotter part of summer. Pollen is susceptible to heat and its reduced effectiveness may lead to smaller ears, missing kernels, and in turn lower yields. The quick loss of topsoil moisture due to high evaporative demand is also a concern depending on soil type.
6 The intense heat is quickly drying topsoil vegetation but is also firing up thunderstorms. On July 18 th a semi truck blew a tire on I-65 near Lafayette, setting the grass shoulder on fire. The next day a local wind storm brought down trees and power lines in Harrison county in far southern Indiana. The action moved to central Indiana on July 20 th. Trees fell on roads and hail 1.00 inch to 1.75 inch in diameter was observed in Henry county. High winds in Lawrence county pulled down utility poles and uprooted trees that fell on roads and houses. Severe weather on July 22 nd and 23 rd occurred mainly in northern Indiana. On July 22 nd over 40 trees fell in high winds in Steuben county while an old barn was leveled and about 1000 acres of corn lodged. Corn was lodged over a 4 square mile area in Randolph county due to high winds there. In Allen county a gas station canopy was ripped down. Trees falling on power lines or roads were a common theme in Allen, Dekalb, Huntington, Whitley, Kosciusko, Marshall, and Pulaski counties. One person was injured in Starke county when a tree fell on a house. Winds were estimated around 70 mph throughout northern Indiana during these storms. The weather became more violent the next day. On July 23 rd an unconfirmed tornado touched down briefly near Kentland in Newton county tearing down tree branches. In northeast Indiana a barn roof was torn off in Whitley county and trees were uprooted or snapped off there and in Kosciusko county. To the south in Randolph county high winds caused small structural damage and toppled trees and utility poles. The dry down of soils in the intense heat has prompted an alert to closely monitor soil moisture conditions. The National Drought Monitor introduced a D0 classification (abnormally dry) for northeast Indiana in its July 19 th edition. The affected area includes counties bounded on the north and east by the Michigan and Ohio state lines, and on the west by a line roughly from Goshen to Elwood, then on to Winchester. The D0 area represents about 18% of the total state area.
7 July 25 th 31 st The summer heat wave relented briefly this week as maximum temperatures in some cities dipped below 90. The dominant high pressure ridge in the upper atmosphere that has controlled our weather this month is still in place, expanding and shrinking in area in a slow long cycle. At ground level a cold front passed half way through the state on July 27 th before it stalled, then retreated as a warm front the next day into Michigan. A second try a few days later was more successful. The cold front pushed its way across the Ohio River, allowing less humid air into the state at the close of the week and month. State average temperatures early in the week ranged 4 to 6 above normal, then warmed up a few degrees to 7 to 9 above normal after July 27 th. For the week overall temperatures averaged 7 above normal. Typically in the last week of July daily maximum temperatures should range from 86 to 91 north to south across Indiana. Daily minimums normally vary from 66 in the far north to 70 in the southwest corner of the state. The week began with about 0.8 inch of rain in southern Indiana and a quarter inch in northern and central sections. Dry weather followed the next 3 days. Light showers fell the next two days with the passage of the second cold front. Total rainfall for the week averaged near 1.1 inch in northern Indiana and about 0.6 elsewhere across the state. These amounts are about 130% of normal across the north and 60% to 70% of normal in central and southern Indiana. As expected the summer heat aided the development of locally heavy thunderstorms. On July 29 th the CoCoRaHS observer in Fowler recorded 5.00 inches. Three Valparaiso gauges collected 3.14 inches, 3.10 inches, and 3.05 inches that day. Earlier in the week the Pendleton volunteer measured 3.10 inches on July 25 th. Among the higher grand totals for the week were 3.63 inches in Kentland and 3.45 inches at Brook. The Valparaiso trio totaled 3.61 inches, 3.35 inches, and 3.34 inches. Certainly rain has not fallen uniformly across Indiana and this fact is demonstrated in the latest National Drought Monitor product. The July 26 th edition of this report shows the area classified as abnormally dry (D0 category) has nearly doubled in one week from 18% of the state area to 33% in the latest report. This eastern D0 area is now generally bound within a line from Elkhart to Tipton to Martinsville, then on to Columbus and Brookville. The impacted area has expanded southward into southeast Indiana and westward into central Indiana this week. The remaining two thirds of the state remains classified as normal and not in drought. Noticeably missing this week is severe weather. Only a single report of fallen trees and power lines was noted in a thunderstorm in Vigo county. The persistently high maximum temperatures, unusually high dew points and heat indices, warm night time temperatures, and high evapotranspiration rates have certainly impacted people without home air conditioning. Many home improvement stores report record window air conditioner sales. By some estimates new home central air conditioning installations have increased 10% above normal for this time of year while central air service calls have increased 20% or more.

8 July 2011 Temperature Region Temperature Normal Deviation Northwest North Central Northeast West Central Central East Central Southwest South Central Southeast State Precipitation Region Precipitation Normal Deviation Percent of Normal Northwest North Central Northeast West Central Central East Central Southwest South Central Southeast State
9 Summer 2011 (June July so far) Temperature Region Temperature Normal Deviation Northwest North Central Northeast West Central Central East Central Southwest South Central Southeast State Precipitation Region Precipitation Normal Deviation Percent of Normal Northwest North Central Northeast West Central Central East Central Southwest South Central Southeast State Annual so far Temperature Region Temperature Normal Deviation Northwest North Central Northeast West Central Central East Central Southwest South Central Southeast State
10 Precipitation Region Precipitation Normal Deviation Percent of Normal Northwest North Central Northeast West Central Central East Central Southwest South Central Southeast State
11
12
13
14 Drought Summary from the U.S. Drought Monitor Below is a drought summary for the state of Indiana from the U.S. drought monitor. Areas in white are not experiencing any drought. Yellow areas are abnormally dry, but not entirely considered a drought. Drought begins when the moisture levels become more severe, with beige, orange, red, and brown indicating increasing levels of drought (moderate, severe, extreme, and exceptional, respectively). The table below indicates how much of the state is not under drought conditions, and also how much of the state is under drought conditions from its respective column upwards. For example, July 26 th has 66.5% of Indiana under no drought, and 33.5% of Indiana under at least D0 through D4 drought status. Please note, however, that these areas are not exact, and much of this drought map has been created from reports throughout the state and estimation, so use this information as a general view rather than for specifics.
15 July 5 th Drought Summary
16 July 12 th Drought Summary

17 July 19 th Drought Summary
18 July 26 th Drought Summary

19 August 2 nd Drought Summary
October 2011 Climate Summary
 Ken Scheeringa and Kayla Hudson Nov 4, 2011 http://www.iclimate.org October 2011 Climate Summary Month Summary October weather evolved as a two part story. Weather conditions the first half of the month
August 2006 Summary. August 1-5
 Ashley Brooks (765) 494-6574 Sep 8, 2006 http://www.iclimate.org August 1-5 August 2006 Summary The heat wave that started during the end of July continued into the beginning parts of August with temperatures
July 2007 Climate Summary
 Dan Bowman (765) 494-6574 Sep 3, 2007 http://www.iclimate.org Summary July 2007 Climate Summary The month of July ended as a very unusual month. Many events occurred during the month of July that is not
August 2013 Climate Summary
 Ken Scheeringa and Matt Price Sep 6, 2013 (765) 494-8105 http://www.iclimate.org August 2013 Climate Summary Month Summary August weather began cool and wet but became progressively warmer and drier through
September 2005 Climate Summary
 Ashley Brooks (765) 494-6574 Oct 5, 2005 http://iclimate.org September 2005 Climate Summary September 1-7 A cold front came through on the 1 st of the month, however little moisture was associated with
May 2015 Climate Summary
 Ken Scheeringa And Mary Rose Mangan Jun 8, 2015 (765) 494-8105 http://www.iclimate.org May 2015 Climate Summary Month Summary May was a very warm month. Rainfall averaged near normal but was distributed
December 2011 Climate Summary
 Ken Scheeringa and Kayla Hudson Jan 17, 2012 (765) 494-8105 http://www.iclimate.org December 2011 Climate Summary Month Summary What a difference a year makes! A year ago the misery of a harsh, cold, and
January 2008 Climate Summary
 Joseph Mays (765) 494-6574 Feb 5, 2008 http://www.iclimate.org Summary January 2008 Climate Summary January was a mix bag of conditions, with an oscillatory pattern developing. We experienced phases of
September 2011 Climate Summary
 Ken Scheeringa and Kayla Hudson Oct 5, 2011 (765) 494-8105 http://www.iclimate.org September 2011 Climate Summary Month Summary The final blast of summer heat arrived at the start of September. It lasted
August 2017 Climate Summary
 Ken Scheeringa And Andy Eggert Sep 7, 2017 (765) 494-8105 http://www.iclimate.org August 2017 Climate Summary Month Summary The coolest August in 13 years featured long cool and warm spells, below normal
August 2015 Climate Summary
 Ken Scheeringa And Mary Rose Mangan Sep 4, 2015 (765) 494-8105 http://www.iclimate.org August 2015 Climate Summary Month Summary A very active wet summer weather pattern turned much calmer and drier in
July 2010 Climate Summary
 Ken Scheeringa (765) 494-8105 Aug 4, 2010 http://www.iclimate.org July 2010 Climate Summary Summary The warm summer of 2010 continues. Daily state average temperatures were above normal on all but seven
May 2018 Climate Summary
 Ken Scheeringa and Andy Eggert Jun 7, 2018 (765) 494-8105 http://www.iclimate.org May 2018 Climate Summary Month Summary As the calendar turned from April to May temperatures flipped dramatically away
March 2009 Climate Summary
 Joseph Mays (765) 494-6574 Apr 1, 2009 http://www.iclimate.org Summary March 2009 Climate Summary March is in the books and it continued the trend of extreme weather we have experienced during the first
April 2013 Climate Summary
 Ken Scheeringa and Kayla Hudson May 6, 2013 (765) 494-8105 http://www.iclimate.org April 2013 Climate Summary Month Summary Temperatures bounced high and low this month, keeping Hoosiers guessing which
March 2014 Climate Summary
 Ken Scheeringa And Matt Price Apr 8, 2014 (765) 494-8105 http://www.iclimate.org March 2014 Climate Summary Month Summary Winter had officially ended by the calendar but snow and cold persisted in Indiana
June 2011 Climate Summary
 Ken Scheeringa (765) 494-8105 Jul 8, 2011 http://www.iclimate.org June 2011 Climate Summary Month Summary The abundance of extreme weather this year extended yet another month into June. This month has
June 2016 Climate Summary
 Ken Scheeringa And Andy Eggert Jul 8, 2016 (765) 494-8105 http://www.iclimate.org June 2016 Climate Summary Month Summary June was a warm month with below normal temperature on just 6 days. Rainfall was
May 2005 Climate Summary
 Ashley Brooks (765) 494-6574 Jun 7, 2005 http://iclimate.org May 2005 Climate Summary May 1-5 Early May was characterized by an upper-level trough that was in place over Indiana that brought in very cool
November 2012 Climate Summary
 Ken Scheeringa and Kayla Hudson Dec 6, 2012 (765) 494-8105 http://www.iclimate.org November 2012 Climate Summary Month Summary November was one of those rare weather months in Indiana when not much happened:
November 2010 Climate Summary
 Ken Scheeringa (765) 494-8105 Dec 6, 2010 http://www.iclimate.org November 2010 Climate Summary Summary A four month drought in Indiana is collapsing as significant rain fell the final week of November.
June 2010 Climate Summary
 Ken Scheeringa (765) 494-8105 Jul 6, 2010 http://www.iclimate.org June 2010 Climate Summary Summary Summer like heat and humidity arrived in Indiana on May 22 nd and dominated our weather scene nearly
The Pennsylvania Observer
 The Pennsylvania Observer August 3, 2015 July 2015 - Pennsylvania Weather Recap By: Arthur Person Although this seventh month of 2015 was fairly normal across Pennsylvania as a whole, the details reveal
January 2012 Climate Summary
 Ken Scheeringa and Kayla Hudson Feb 6, 2012 (765) 494-8105 http://www.iclimate.org January 2012 Climate Summary Month Summary Where is winter? This question found its way into many conversations throughout
October 2014 Climate Summary
 Ken Scheeringa And Matt Price Nov 10, 2014 (765) 494-8105 http://www.iclimate.org October 2014 Climate Summary Month Summary October featured a mix of weather. A very wet first half of the month evolved
September 2012 Climate Summary
 Ken Scheeringa and Kayla Hudson Oct 5, 2012 (765) 494-8105 http://www.iclimate.org September 2012 Climate Summary Month Summary Summer slipped away and it felt a lot more like autumn in Indiana this month
April 2015 Climate Summary
 Ken Scheeringa And Mary Rose Mangan May 8, 2015 http://www iclimate org April 2015 Climate Summary Month Summary April was a month of extremes. Severe weather erupted on 4 days of the first week with multiple
January 2013 Climate Summary
 Ken Scheeringa and Kayla Hudson Feb 7, 2013 (765) 494-8105 http://www.iclimate.org January 2013 Climate Summary Month Summary Winter or spring? January featured several dramatic swings in temperature and
The hydrologic service area (HSA) for this office covers Central Kentucky and South Central Indiana.
 for this office covers Central Kentucky and South Central Indiana.") January 2012 February 13, 2012 An X inside this box indicates that no flooding occurred within this hydrologic service area. January 2012 continued the string of wet months this winter. Rainfall was generally
January 2012 February 13, 2012 An X inside this box indicates that no flooding occurred within this hydrologic service area. January 2012 continued the string of wet months this winter. Rainfall was generally
May 2016 Climate Summary
 Ken Scheeringa And Andy Eggert Jun 6, 2016 (765) 494-8105 http://www.iclimate.org May 2016 Climate Summary Month Summary Cold weather dominated in May until the last week of the month. May began wet but
January 2006 Climate Summary
 Ashley Brooks (765) 494-6574 Feb 9, 2006 http://www.iclimate.org January 1-3 January 2006 Climate Summary Unseasonably warm conditions welcomed in the New Year with highs in the 40s across the northern
November 2014 Climate Summary
 Ken Scheeringa And Matt Price Dec 10, 2014 (765) 494-8105 http://www.iclimate.org November 2014 Climate Summary Month Summary Unseasonable cold headlined the Indiana and national news in November. The
February 2017 Climate Summary
 Ken Scheeringa And Andy Eggert Mar 9, 2017 (765) 494-8105 http://www.iclimate.org February 2017 Climate Summary Month Summary February 2017 was the warmest February in Indiana since state climate records
Champaign-Urbana 2001 Annual Weather Summary
 Champaign-Urbana 2001 Annual Weather Summary ILLINOIS STATE WATER SURVEY 2204 Griffith Dr. Champaign, IL 61820 wxobsrvr@sws.uiuc.edu Maria Peters, Weather Observer January: After a cold and snowy December,
2012 Growing Season Weather Summary for North Dakota. Adnan Akyüz and Barbara A. Mullins Department of Soil Science October 30, 2012
 2012 Growing Season Weather Summary for North Dakota Adnan Akyüz and Barbara A. Mullins Department of Soil Science October 30, 2012 Introduction The 2012 growing season (the period from April through September)
April 2017 Climate Summary
 Ken Scheeringa And Andy Eggert May 8, 2017 (765) 494-8105 http://www.iclimate.org April 2017 Climate Summary Month Summary April was a very warm and wet month in Indiana, nearly setting a new monthly temperature
KANSAS CLIMATE SUMMARY August 2015
 KANSAS CLIMATE SUMMARY August 2015 Cool and Dry August was drier than normal in most of the state. State-wide average precipitation was 2.80 inches or 85 percent of normal. The Northeast division of the
MIAMI-SOUTH FLORIDA National Weather Service Forecast Office
 MIAMI-SOUTH FLORIDA National Weather Service Forecast Office http://www.weather.gov/miami June 2015 South Florida Weather Summary Dry East, Wet West...Drought Remains SE Florida July 3, 2015: Depending
August 2016 Climate Summary
 Ken Scheeringa And Andy Eggert Sep 12, 2016 (765) 494-8105 http://www.iclimate.org August 2016 Climate Summary Month Summary Hot but tranquil weather the first half of August transitioned to a tormented
October 2010 Climate Summary
 Ken Scheeringa (765) 494-8105 Nov 5, 2010 http://www.iclimate.org October 2010 Climate Summary Summary Rain fell on about 10 days in October but did little to slow the drought raging across Indiana. For
Champaign-Urbana 1998 Annual Weather Summary
 Champaign-Urbana 1998 Annual Weather Summary ILLINOIS STATE WATER SURVEY Audrey Bryan, Weather Observer 2204 Griffith Dr. Champaign, IL 61820 wxobsrvr@sparc.sws.uiuc.edu The development of the El Nìno
April 2016 Climate Summary
 Ken Scheeringa And Andy Eggert May 9, 2016 (765) 494-8105 http://www.iclimate.org April 2016 Climate Summary Month Summary One month but two seasons. The first half of April was cold with snow. Wind damage
2011 Year in Review TORNADOES
 2011 Year in Review The year 2011 had weather events that will be remembered for a long time. Two significant tornado outbreaks in April, widespread damage and power outages from Hurricane Irene in August
The Pennsylvania Observer
 The Pennsylvania Observer September 3, 2008 Summer 2008 Weather Summary Written by: Brian Thompson The opening days of June started dry, but a warm front brought a widespread rain a couple of days into
June 2015 Climate Summary
 Ken Scheeringa And Mary Rose Mangan Jul 10, 2015 (765) 494-8105 http://www.iclimate.org June 2015 Climate Summary Month Summary Indiana set a new June rainfall record this month with a state average 8.99.
October 2012 Climate Summary
 Ken Scheeringa and Kayla Hudson Nov 8, 2012 (765) 494-8105 http://www.iclimate.org October 2012 Climate Summary Month Summary In a reversal from the hot and dry summer, cooler and wetter than normal conditions
March 2016 Climate Summary
 Ken Scheeringa And Andy Eggert Apr 8, 2016 (765) 494-8105 http://www.iclimate.org March 2016 Climate Summary Month Summary Count March as the 7 th month in a row that the state average temperature has
September 2016 Climate Summary
 Ken Scheeringa And Andy Eggert Oct 6, 2016 (765) 494-8105 http://www.iclimate.org September 2016 Climate Summary Month Summary The warmest September in 77 years brought alternating weeks of dry and wet
January 2017 Climate Summary
 Ken Scheeringa And Andy Eggert Feb 8, 2017 (765) 494-8105 http://www.iclimate.org January 2017 Climate Summary Month Summary The warmest January in 11 years was nearly 4 F warmer than December 2016. An
November 2015 Climate Summary
 Ken Scheeringa And Mary Rose Mangan Dec 8, 2015 (765) 494-8105 http://www.iclimate.org November 2015 Climate Summary Month Summary November was much warmer than normal while precipitation was very near
III. Section 3.3 Vertical air motion can cause severe storms
 III. Section 3.3 Vertical air motion can cause severe storms http://www.youtube.com/watch?v=nxwbr60tflg&feature=relmfu A. Thunderstorms form from rising moist air Electrical charges build up near the tops
The Pennsylvania Observer
 The Pennsylvania Observer October 1, 2015 September 2015 - Pennsylvania Weather Recap By: Quinn Lease The month of September will be remembered for its above normal temperatures and dry conditions that
Chapter 3: Weather Fronts & Storms
 Chapter 3: Weather Fronts & Storms An AIR MASS is a large body of air that has similar characteristics (temperature, humidity) throughout. Air masses can be massively large. Air masses are classified by
The Weather Wire. Contents: Summer 2018 Outlook. Summer 2018 Outlook Drought Monitor May Summary/Statistics June Preview Rainfall Totals
 The Weather Wire June 2018 Volume 25 Number 6 Contents: Summer 2018 Outlook Drought Monitor May Summary/Statistics June Preview Rainfall Totals Summer 2018 Outlook June 1 st marked the first day of meteorological
2018 Year in Review for Central and Southeast Illinois By: Chris Geelhart, Meteorologist National Weather Service, Lincoln IL
 By: Chris Geelhart, Meteorologist National Weather Service, Lincoln IL While 2018 featured some significant out-of-season weather, including below zero temperatures in April and 90-degree highs in early
Monthly Long Range Weather Commentary Issued: July 18, 2014 Steven A. Root, CCM, President/CEO
 Monthly Long Range Weather Commentary Issued: July 18, 2014 Steven A. Root, CCM, President/CEO sroot@weatherbank.com JUNE 2014 REVIEW Climate Highlights The Month in Review The average temperature for
NATIONAL WEATHER SERVICE
 January 2016 February 9, 2016 This was a dry month across the HSA despite one large and several smaller snowfalls. Most locations ended up 1-2 inches below normal for the month. The driest locations at
April 2011 Climate Summary
 Ken Scheeringa (765) 494-8105 May 9, 2011 http://www.iclimate.org April 2011 Climate Summary Summary After somewhat of a respite in March Indiana weather ramped up with a vengeance in April. Extreme weather
National Wildland Significant Fire Potential Outlook
 National Wildland Significant Fire Potential Outlook National Interagency Fire Center Predictive Services Issued: September, 2007 Wildland Fire Outlook September through December 2007 Significant fire
SIGNIFICANT EVENTS Severe Storms November 1994 January 1996 August 1998 and May 2000 March 2002 May 2002 Champaign County
 SIGNIFICANT EVENTS Severe Storms November 1994 On Nov. 1, 1994, high winds gusted over 60 mph at times across the northwest third of Ohio. The highest measured wind gust was 63 mph at Columbus Grove (Putnam).
KANSAS CLIMATE SUMMARY January 2018
 KANSAS CLIMATE SUMMARY January 2018 Some welcome moisture After an extended period with little to no moisture, parts of Kansas recorded some significant precipitation. At Tribune, a small snow event on
Arizona Climate Summary September 2014 Summary of conditions for August 2014
 Arizona Climate Summary September 2014 Summary of conditions for August 2014 August 2014 Temperature and Precipitation Summary August 1 st 16 th : The first 5 days of August were quite wet with high pressure
Ch. 3: Weather Patterns
 Ch. 3: Weather Patterns Sect. 1: Air Mass & Fronts Sect. 2: Storms Sect. 3: Predicting the Weather Sect. 4: Weather forecasters use advanced technologies Ch. 3 Weather Fronts and Storms Objective(s) 7.E.1.3
3 Severe Weather. Critical Thinking
 CHAPTER 2 3 Severe Weather SECTION Understanding Weather BEFORE YOU READ After you read this section, you should be able to answer these questions: What are some types of severe weather? How can you stay
Above normal temperatures and precipitation continue across the HSA
 NWS Form E-5 (PRES. BY NWS Instruction 10-924) MONTHLY REPORT OF HYDROLOGIC CONDITIONS HYDROLOGIC SERVICE AREA (HSA) MONTH YEAR TO: Hydrologic Information Center, W/OS31 NOAA s National Weather Service
Nebraska experienced a wide
 Issue 1 August 2016 CLIMATE UPDATE A MONTHLY SUMMARY FROM THE neclimate.unl.edu August saw reprieve from dryness, cooler temps Overview Nebraska experienced a wide range of conditions across the state
November 2017 Climate Summary
 Ken Scheeringa and Andy Eggert Dec 8, 2017 (765) 494-8105 http://www.iclimate.org November 2017 Climate Summary Month Summary November temperatures alternated spells of warm and cool while precipitation
July 2014 Climate Summary
 Ken Scheeringa And Matt Price Aug 8, 2014 (765) 494-8105 http://www.iclimate.org July 2014 Climate Summary Month Summary July was unseasonably cool and drier than normal. Rainfall was light in parts of
October 2016 Climate Summary
 Ken Scheeringa And Andy Eggert Nov 9, 2016 (765) 494-8105 http://www.iclimate.org October 2016 Climate Summary Month Summary October was the 9 th month so far this year to average above normal in temperature.
New Hampshire State Climate Office Dr. Mary D. Stampone, State Climatologist
 New Hampshire State Climate Office Dr. Mary D. Stampone, State Climatologist University of New Hampshire c/o Department of Geography 73 Main Street Durham, NH 03824 Phone: 603-862-3136 Fax: 603-862-4362
but 2012 was dry Most farmers pulled in a crop
 After a winter that wasn t, conditions late in the year pointed to a return to normal snow and cold conditions Most farmers pulled in a crop but 2012 was dry b y M i k e Wr o b l e w s k i, w e a t h e
Your Task: Read each slide then use the underlined red or underlined information to fill in your organizer.
 Severe Weather: Tornadoes and Hurricanes Thunderstorms and Lightning S6E4 d. Construct an explanation of the relationship between air pressure, weather fronts, and air masses and meteorological events
NWS FORM E-5 U.S. DEPARTMENT OF COMMERCE HSA OFFICE:
 NWS FORM E-5 U.S. DEPARTMENT OF COMMERCE HSA OFFICE: NOAA, NATIONAL WEATHER SERVICE MONTHLY REPORT OF RIVER AND FLOOD CONDITIONS DATE: TO: North Webster, IN REPORT FOR (MONTH &YEAR): July 1998 August 5,
October 2017 Climate Summary
 Ken Scheeringa and Andy Eggert Nov 6, 2017 (765) 494-8105 http://www.iclimate.org October 2017 Climate Summary Month Summary After more than three weeks of warm temperatures October turned suddenly cold
What a Hurricane Needs to Develop
 Weather Weather is the current atmospheric conditions, such as air temperature, wind speed, wind direction, cloud cover, precipitation, relative humidity, air pressure, etc. 8.10B: global patterns of atmospheric
Table 1. August average temperatures and departures from normal ( F) for selected cities.
 for selected cities.") Climate Summary for Florida August 2016 Prepared by Lydia Stefanova and David Zierden Florida Climate Center, The Florida State University, Tallahassee, Florida Online at: http://climatecenter.fsu.edu/products-services/summaries
Climate Summary for Florida August 2016 Prepared by Lydia Stefanova and David Zierden Florida Climate Center, The Florida State University, Tallahassee, Florida Online at: http://climatecenter.fsu.edu/products-services/summaries
Hurricanes form over warm ocean water.
 KEY CONCEPT Low-pressure systems can become storms. BEFORE, you learned Moving air masses cause changes in weather A low-pressure system brings stormy weather NOW, you will learn How hurricanes develop
Champaign-Urbana 1999 Annual Weather Summary
 Champaign-Urbana 1999 Annual Weather Summary ILLINOIS STATE WATER SURVEY 2204 Griffith Dr. Champaign, IL 61820 wxobsrvr@sws.uiuc.edu Maria Peters, Weather Observer A major snowstorm kicked off the new
Module 11: Meteorology Topic 6 Content: Severe Weather Notes
 Severe weather can pose a risk to you and your property. Meteorologists monitor extreme weather to inform the public about dangerous atmospheric conditions. Thunderstorms, hurricanes, and tornadoes are
The Pennsylvania Observer
 The Pennsylvania Observer May 31, 2012 May 2012 - Pennsylvania Weather Recap By: Paul Knight The majority of the fifth month had temperatures averaging well above seasonal levels with two distinct hot
KANSAS CLIMATE SUMMARY June 2016
 KANSAS CLIMATE SUMMARY June 2016 Summer arrives early June made a quick turn-around with both temperature and precipitation in most of the state. Only the Southwest Division averaged above normal precipitation
KANSAS CLIMATE SUMMARY June 2017
 KANSAS CLIMATE SUMMARY June 2017 Uneven rainfall The wet May gave way to uneven rainfall in June. The statewide average precipitation was 3.23 inches or 74 percent of normal. The East Central and West
Precipitation. Standardized Precipitation Index. NIDIS Intermountain West Drought Early Warning System September 5, 2017
 9/6/2017 NIDIS Drought and Water Assessment NIDIS Intermountain West Drought Early Warning System September 5, 2017 Precipitation The images above use daily precipitation statistics from NWS COOP, CoCoRaHS,
NWS FORM E-5 U.S. DEPARTMENT OF COMMERCE I HYDRO SERVICE AREA NOAA, NATIONAL WEATHER SERVICE I Indianapolis, IN MONTHLY REPORT
 NWS FORM E-5 U.S. DEPARTMENT OF COMMERCE I HYDRO SERVICE AREA NOAA, NATIONAL WEATHER SERVICE I Indianapolis, IN. 1-------------------- MONTHLY REPORT OF RIVER AND FLOOD CONDITIONSI REPORT FOR I November
KANSAS CLIMATE SUMMARY April 2017
 KANSAS CLIMATE SUMMARY April 2017 Epic Blizzard While much of the month was warmer than normal, the last week brought a return to cold, wintery weather in the western third of the state, and cold rainy
Community Collaborative Rain, Hail & Snow Network
 Community Collaborative Rain, Hail & Snow Network NWS Gray and Matt Spies September 2016 Hello Observers! This is the first edition of a newsletter that we will be sending out to our current CoCoRaHS observers.
KANSAS CLIMATE SUMMARY October 2016
 KANSAS CLIMATE SUMMARY October 2016 Record warmth Temperatures continued the warmer than normal pattern through much of October. The state-wide average temperature was 60.9 of, or 5.6 degrees warmer than
March 2018 Climate Summary
 Ken Scheeringa and Andy Eggert Apr 5, 2018 (765) 494-8105 http://www.iclimate.org March 2018 Climate Summary Month Summary March turned cold with below normal temperatures on two-thirds of its days. Along
Flood warnings were issued for the Maumee, St. Marys, Blanchard, St. Joseph (Ohio), Tippecanoe, Tiffin, Eel and Wabash Rivers on the 30 th and 31 st.
, Tippecanoe, Tiffin, Eel and Wabash Rivers on the 30 th and 31 st.") NWS FORM E-5 U.S. DEPARTMENT OF COMMERCE HSA OFFICE: NOAA, NATIONAL WEATHER SERVICE MONTHLY REPORT OF RIVER AND FLOOD CONDITIONS DATE: TO: North Webster, IN REPORT FOR (MONTH &YEAR): January 2002 February
NWS FORM E-5 U.S. DEPARTMENT OF COMMERCE HSA OFFICE: NOAA, NATIONAL WEATHER SERVICE MONTHLY REPORT OF RIVER AND FLOOD CONDITIONS DATE: TO: North Webster, IN REPORT FOR (MONTH &YEAR): January 2002 February
Weather. A. atmosphere is a layer of gases that wrap around the Earth like a blanket.
 Weather I. The air around us A. atmosphere is a layer of gases that wrap around the Earth like a blanket. II. Weather Temperature Humidity Air pressure Wind 1. contains the air we breathe, protects us
Arizona Climate Summary May 2012
 Arizona Climate Summary May 2012 Summary of conditions for April 2012 April 2012 Temperature and Precipitation Summary April 1 st 16 th : Although April began with another low pressure system sweeping
How strong does wind have to be to topple a garbage can?
 How strong does wind have to be to topple a garbage can? Imagine winds powerful enough to pick up a truck and toss it the length of a football field. Winds of this extreme sometimes happen in a tornado.
Arizona Climate Summary
 August 2015 Temperature and Precipitation Summary Arizona Climate Summary September 2015 Summary of conditions for August 2015 August 1 st 16 th : August was a wet month across the state with only 3 days
Key Concept Weather results from the movement of air masses that differ in temperature and humidity.
 Section 2 Fronts and Weather Key Concept Weather results from the movement of air masses that differ in temperature and humidity. What You Will Learn Differences in pressure, temperature, air movement,
KANSAS CLIMATE SUMMARY May 2018
 KANSAS CLIMATE SUMMARY May 2018 From Cold to Hot May came close to setting the record as the hottest since 1895. The state-wide average temperature for the month was 70.6 o F. This was 7.2 degrees warmer
HAZARD DESCRIPTION... 1 LOCATION... 1 EXTENT... 1 HISTORICAL OCCURRENCES...
 WINTER STORM HAZARD DESCRIPTION... 1 LOCATION... 1 EXTENT... 1 HISTORICAL OCCURRENCES... 3 SIGNIFICANT PAST EVENTS... 4 PROBABILITY OF FUTURE EVENTS... 5 VULNERABILITY AND IMPACT... 5 Hazard Description
March 2011 Climate Summary
 Ken Scheeringa (765) 494-8105 Apr 5, 2011 http://www.iclimate.org March 2011 Climate Summary Summary The fast paced weather action of February slowed some in March. The major March weather features were
The hydrologic service area (HSA) for this office covers Central Kentucky and South Central Indiana.
 for this office covers Central Kentucky and South Central Indiana.") MONTH YEAR January 2011 February 15, 2011 X An X inside this box indicates that no flooding occurred within this hydrologic service area. January 2011 was drier than normal in all locations in the area.
MONTH YEAR January 2011 February 15, 2011 X An X inside this box indicates that no flooding occurred within this hydrologic service area. January 2011 was drier than normal in all locations in the area.
Guided Notes Weather. Part 2: Meteorology Air Masses Fronts Weather Maps Storms Storm Preparation
 Guided Notes Weather Part 2: Meteorology Air Masses Fronts Weather Maps Storms Storm Preparation The map below shows North America and its surrounding bodies of water. Country borders are shown. On the
NWS FORM E-5 U.S. DEPARTMENT OF COMMERCE HSA OFFICE:
 NWS FORM E-5 U.S. DEPARTMENT OF COMMERCE HSA OFFICE: NOAA, NATIONAL WEATHER SERVICE MONTHLY REPORT OF RIVER AND FLOOD CONDITIONS DATE: TO: North Webster, IN REPORT FOR (MONTH &YEAR): January 2001 February