September 2016 Climate Summary
|
|
|
- Primrose Farmer
- 6 years ago
- Views:
Transcription

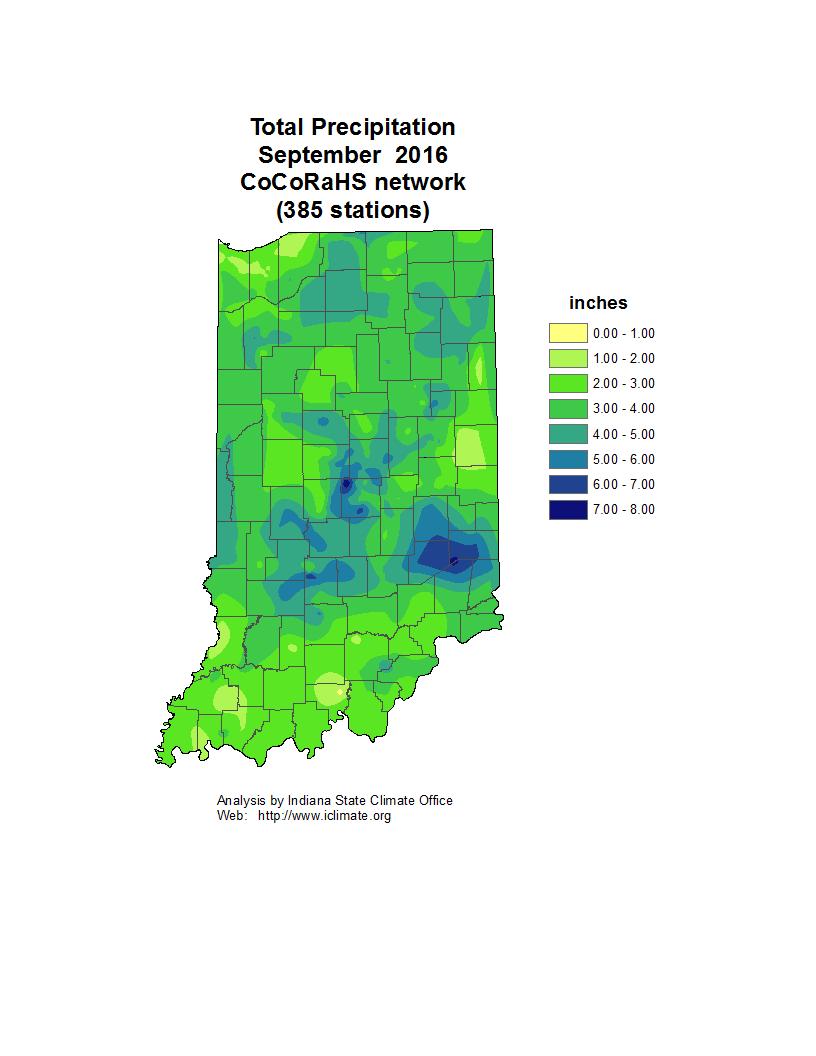
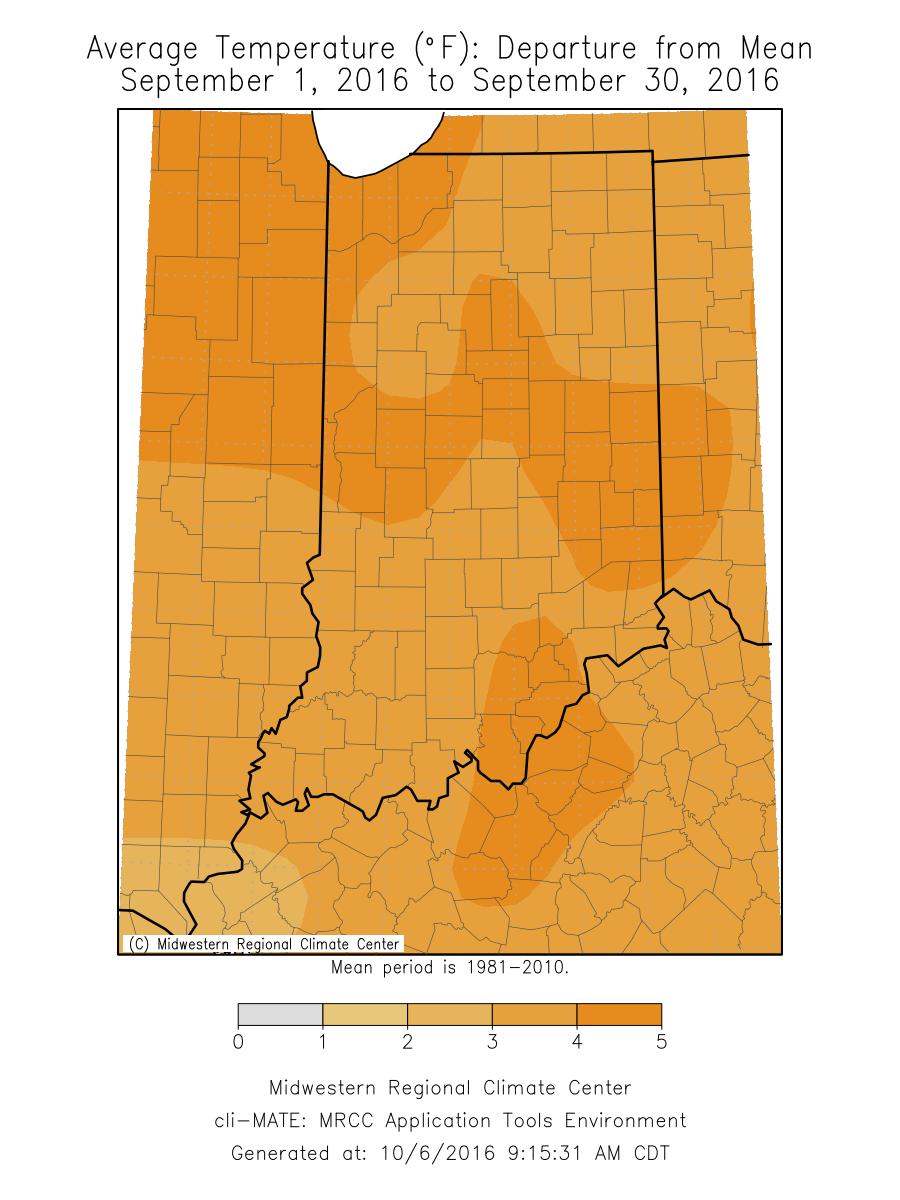
1 Ken Scheeringa And Andy Eggert Oct 6, 2016 (765) September 2016 Climate Summary Month Summary The warmest September in 77 years brought alternating weeks of dry and wet weather to Indiana. The month began and ended cool with many warm days in between. Moderate drought ended in northeast counties. About 85% of field crops reached maturity this month and were safe from frost. Wind damage occurred on 3 days in the first half of September. Tornadoes did not occur despite numerous warnings on September 9 th. The September state average temperature was 70.1 F which is 4.4 F above normal. This places the month as the 6 th warmest September on record. Last year was the 21 st warmest September at 68.8 F. The most recent warmer September was in 1939 with a 70.6 state average temperature, good for 4 th place. The warmest September on record came in 1925 with a 71.9 F average. The day split in September 2016 was 9 days of below normal temperature, 20 days above normal, and 1 day at normal. There were 6 days when the mean daily temperature was at least 10 F warmer than normal but no days at least 10 F cooler than normal. The highest temperature of the month was 99 F on September 14 th at Myers Lock & Dan and the coolest was 42 F on September 28 th at Shoals 8s. The September state precipitation average was 3.57 at 0.48 above normal. This puts September 2016 into a tie with 1924 as the 48 th wettest September on record. The most recent wetter September was in 2012 when 5.18 was the state average. A year earlier a 5.31 average was noted. The wettest September on record was the 8.21 state average in The heaviest one day precipitation among cooperative stations in September 2016 was 5.18 on September 9 th at Brookville. The highest among CoCoRaHS stations was 4.75 that same day at Batesville 0.5nne. The largest month total precipitation in the cooperative network was 7.60 at Brookville. In the CoCoRaHS network the heaviest was 7.65 at Batesville 1.3sw. Widespread precipitation fell on about 12 days this month. Regionally September 2016 precipitation was near 120% of normal in northern and central Indiana and right about normal in southern Indiana. Normal September precipitation ranges from 2.8 in east central to 3.3 in north central Indiana. Indiana farmers had to deal with starts and stops in harvest progress this month. The first and third weeks were drier than normal and provided good harvest weather but the second and fourth weeks were rainy. An upper atmosphere cutoff low pressure system parked over Indiana outside the storm track late in September was slow to move out and put harvest progress a little behind schedule.
2 September 1 st 10 th After a few brief cool days early September temperatures ramped up quickly as a reminder of recent August heat. There was little to no rain until September 8 th when daily heavy showers announced the arrival of a cool down. With the temperature change came 3 days of severe weather. Wind damage was reported on September 8 th and 10 th. Tornado warnings based on radar were issued on September 9 th but none formed. There was no change in Indiana drought status. Mold and weeds became significant field crop problems in the warm and humid conditions. The state average temperature on September 1 st was 2 F below normal. A stationary front was located along the Ohio River with a ridge pushing south from Canada toward Iowa. The strong ridge forced the now cold front south to Georgia the next day to meet up with Tropical Storm Hermine. The core of the high pressure settled over the Great Lakes generating sunny skies and cool north winds for Indiana. The state temperature dipped to its coolest of the 10 days at 4 F below normal. A 5-day warmup was on the way. Hermine was on the North Carolina shore but Indiana weather was controlled by the Great Lakes ridge. As the ridge drifted east on September 3 rd its warm wind backflow kept Indiana sunny with a state temperature of 3 F below normal. Hermine left offshore the next day allowing the ridge to slide east and ride all along the Atlantic coast. Indiana temperatures crept up to normal with mostly sunny skies. Hermine pushed due north offshore on September 5 th, locking in the east ridge for another day. Warm southerly winds under sunny skies nudged Indiana temperatures to 5 F above normal with no change in weather conditions. The next day Hermine changed course and moved west to the New Jersey coast. The east coast ridge was still unable to go anywhere. Its southerly wind flow persisted into Indiana another day, allowing the state temperature to rise to 8 F above normal. Hermine weakened on September 7 th and the north half of the east ridge disintegrated. A long cold front took its place and stretched from eastern Quebec to upper Michigan, then to Iowa and Kansas. Yet the warm backflow from the southeast ridge continued into Indiana, raising the state temperature to 10 F above normal, the warmest of the 10 days. On September 8 th the old southeast ridge held its ground, halting the cold front in Iowa. Its paired warm front set up over the western Great Lakes. A definite warm sector had now formed with Indiana in its reach. The state temperature dipped slightly to 9 F above normal. Skies had turned cloudy and rain began to fall in northern Indiana. The cold front rolled through Michigan on September 9 th but stalled as a stationary front along the Michigan-Indiana border. Indiana remained in the warm air sector as rain fell statewide and cooled Indiana temperatures to 6 F above normal. On September 10 th the stationary front surged north into Michigan as a warm front. The warm sector over Indiana was squeezed from the west as its paired cold front lunged through Illinois. The state temperature closed the 10 day interval at 5 F above normal. Over the 10 days the state temperature averaged to 3 F above normal. Usually at the start of September daily maximum temperatures should range from 78 F in far northern Indiana to 85 F in the southwest corner of the state. Normal daily minimums vary between 58 F and 61 F north to south across the state. The warmest temperature of the 10 days within the cooperative station
3 network was 95 F at Evansville Airport on September 7 th. The coolest temperature among stations in this same network was 44 F at Wanatah 2wnw on September 5 th. No fronts passed through Indiana in the first 7 days of September. In this time two days had minimal rainfall. It was the mix of fronts in the last 3 days that produced the bulk of the 10 day precipitation. Rain was tabulated in the northern third of Indiana on September 8 th, statewide on September 9 th, and in all but the southeast corner of the state on September 10 th. Showers were locally heavy in southeast Indiana according to CoCoRaHS reports on the morning of September 9 th. A Brookville observer had 5.50 that day while four volunteers near Batesville measured 4.75, 4.66, 4.56, and Over the 10 day interval some of the Batesville totals summed to 5.29, 4.90, 4.84, and A Rushville gage had tallied Generally on the 10-day total precipitation map less than an inch was caught in the southern quarter of the state and in most of east central Indiana. In contrast 5 to 6 drenched the near southeast, mostly in Franklin and Decatur counties. In nearby west areas 3 to 5 fell as well as along a Fowler to South Bend line in northwest Indiana. About 1 to 3 was common elsewhere. Regionally about 2.2 accumulated across northern Indiana, 1.5 in central counties, and 1.0 across the south. These totals equate to about 210% of normal in the north, 160% in central, and 120% of normal in southern Indiana. Severe weather over the 10 days was limited. On September 8 th a few trees fell on to a road in Decatur county. Two days later a tree fell and blocked a state highway in Switzerland county and a large tree limb was reported down. In Washington county a few trees were noted down on the ground. Before the heavy rains the September 6 th edition of the US Drought Monitor reported no change in Indiana drought conditions since August had ended. Moderate drought (D1 category) conditions persisted in Noble and Allen counties and on the fringes of Lagrange and Kosciusko counties. Abnormally dry (D0 category) soils surrounded all the drought areas. By the numbers 2% of Indiana land was rated in moderate drought, 4% as abnormally dry, and the remaining 94% in normal soil moisture status for this time of year. The USDA Crop Weather report for Indiana, also for September 6 th, noted it was a great work week. Soils were drying after being saturated earlier. Cutting and bailing of hay were underway and livestock were in good condition. The report stated that corn was maturing at almost 25% completed. Soybeans were slightly behind normal harvest progress. Mold had become somewhat of a problem in both crops.
4 September 11 th 17 th A steady warming trend nearly all week long cooled off on the last day. Only 2 cold fronts passed through Indiana this week but it rained somewhere on 5 of 7 days. Wind damage was reported on September 16 in two counties. Drought conditions finally ended in northeast Indiana due to recent heavy rainfall. Early harvest slowed due to recent heavy precipitation putting planting of cover crops and winter wheat on standby. Half the state s corn crop had matured and was safe from frost. A broad ridge centered over Missouri had sprawled over half the country on September 11 th. A long cold front nearly touched the entire Atlantic and Gulf coast lines ahead of the expansive ridge. Indiana skies were sunny with the state temperature at 3 F below normal. The next day the high center had traveled to New York. A warm air backflow was set to begin with the Indiana state temperature rising to 1 F below normal. The ridge moved offshore into the Atlantic on September 13 th. The warmup slowly continued as the Indiana state temperature now inched upward to 1 F above normal. A new ridge had lumbered southeast from Alberta to North Dakota, preceded by a cold front moving through Wisconsin and Iowa. The North Dakota high pressed forward on September 14 th forcing the cold front into Indiana. Yet the state temperature continued upward to 2 F above normal. The next day the cold front had reached Mississippi and Alabama but the ridge itself was redirected northeast into Quebec. This position blocked cold air advection into Indiana and immediately set up another southwesterly backflow of warmer air. In response the Indiana state temperature bounced to 6 F above normal. The next day the Quebec ridge drifted to Maine and extended down the Atlantic coast to South Carolina just west of Tropical Storm Julia in the Atlantic. The backflow of these high centers persisted, allowing Indiana temperatures to peak at 8 F above normal. On September 17 th a storm in North Dakota pushed east to Ontario with two cold fronts. The leading front was traveling slowly across Indiana, tapping into cooler Canadian air. The state temperature fell slightly to 6 F above normal with heavy rainfall. For the week the state temperature averaged to 3 F above normal. Typically in the second week of September daily maximum temperatures should range between 75 F and 82 F north to south across
5 the state. Daily minimums usually vary from 54 F in far northern counties to 58 F in the southwest corner of the state. The warmest temperature of the week among cooperative network stations was 90 F at Vincennes 5ne and Evansville Airport on September 14 th. The coolest temperature among stations in this same network was 50 F at multiple locations on several dates. Rainfall was noted in the morning reports of all days except September 12 th and 13 th. Rain fell statewide according to reports on September 11 th and 17 th, although the report on the 11 th reflected rain which had actually fallen the day before. In the weekly precipitation map the heaviest accumulations were 2.5 to 3.0 along a Sullivan to Marion line. A secondary heavy area was in Ohio and Switzerland counties where up to 2 had fallen. On the lighter side less than a half inch was seen mostly north of a Lafayette to Auburn line and in a band across southern Indiana, generally along a Petersburg to Seymour to Richmond line. The heaviest single day rainfall appeared in the CoCoRaHS morning reports of September 17 th. On that date the volunteer in Greencastle had 2.79, Sheridan 2.67, Clay City 2.62, Lebanon 2.59, and Jasonville 2.52, all in central and west central Indiana. The largest sums for the week were in central Indiana, and included Avon with 3.17, Brownsburg 2.92, Zionsville 2.81, Greencastle 2.80, and Carmel with Regionally about 0.7 was averaged in northern Indiana, 1.1 in central sections, and 0.8 across southern Indiana. These amounts equate to about 80% of normal in the north, 140% of normal across central counties, and 110% of normal in southern Indiana. Severe weather was reported in 2 counties on September 16 th. Wind gusts damaged power lines which resulted in at least 500 homes without power in central and northern Marion county. In Cass county a utility pole was broken and lines came down on a house in strong winds. A small area of corn was flattened. The damage pattern pointed to a brief microburst as the likely cause. The September 13 th edition of the US Drought Monitor erased all remaining moderate drought (D1 category) in the state, essentially Noble and Allen counties. The surrounding area of abnormally dry soils (D0 category) shrank in size. The revised D0 area included most of Noble and east Allen counties along with bits of Lagrange, Kosciusko, Elkhart, Steuben, Dekalb, and Adams counties. After all improvements were considered about 2% of Indiana land area remained abnormally dry with 98% rated in normal soil moisture status for this time of year. In the September 13 th USDA Crop Weather report some Indiana fields were left underwater at the start of the week, causing a slowing of corn harvest and soybean maturity. Mold and fungus growth were problematic and weeds were abundant. Flooding had washed out some southeast Indiana roads. Livestock were stressed from the heat and mud. The weekly report on September 19 th provided an update. Fields were drying but recent spotty showers continued to slow the harvest pace. Pastures were lush and some were still saturated but would recover. Hay harvest was ending and winter wheat planting waited on the slow soybean harvest which had to be completed first. The corn crop was rated as half mature but mold and ear rot impacted some fields. Corn tested too wet which was slowing down harvest operations. Weeds and mold persisted as significant problems for farmers.
6 September 18 th 24 th Hot and mostly dry weather this week allowed farmers to make good harvest progress. Corn continued toward full maturity. Rain fell on 3 days with widespread coverage only on the first day. Soil moisture conditions improved slightly in northern Indiana, nearing full normal status. The state temperature opened the week at 8 F above normal. Two cold fronts merged before passing through Indiana on September 18 th. The cold front stumbled to a halt in Ohio the next day, morphing into a stationary front that stretched from New York to Ohio, then to Alabama, Mississippi, and Oklahoma. Skies had cleared over Indiana with the state temperature at 6 F above normal, the coolest day of the week. By September 20 th the stationary front had wandered to the Atlantic coast. A new cold front had raced to the Michigan-Indiana border running well ahead of its occluded low center over Hudson Bay. The state average temperature changed little at 7 F above normal. The cold front washed out as a trough the next day and high pressure settled over Missouri and Illinois. Light southwesterly winds lifted the Indiana temperature to 11 F above normal. The old cold front reformed over the upper Great Lakes on September 22 nd, creating a defined warm air sector from the Gulf of Mexico north into Indiana and its neighbor states. The temperature nudged upward some more to 12 F above normal. Manitoba high pressure shifted eastward north of the Great Lakes the next day, forcing the cold front to return south to the Michigan-Indiana border before it stopped again over northern Indiana. On September 24 th a Canadian high center moving north of Lake Superior shoved the cold front south of the Ohio River. The state temperature didn t change, ending the week at 15 F above normal. For the week the Indiana state temperature averaged to 11 F above normal. Typically in mid- September the daily maximum temperature would range from 72 F in far northern Indiana to 80 F in the southwest corner of the state. Daily minimums normally vary between 51 F and 54 F north to south across the state. The warmest temperature of the week occurred at 86 F on September 21 st at Jeffersonville among stations in the NWS cooperative network. The coolest temperature among stations in this same network was 30 F at Elwood on September 23 rd.
7 Rainfall totals became lighter on entering the second half of the month. A few isolated showers were noted in the September 19 th CoCoRaHS morning report. Rain was observed statewide the previous morning according to CoCoRaHS observers. Four dry days followed. On September 24 th rainfall was measured in far northern Indiana but the rest of the state remained dry. For the week rainfall averaged near 0.2 statewide. These amounts equate to 30% of normal in northern and central Indiana and 25% of normal in the south. On the weekly precipitation map it remained nearly dry in the west quarter of the state. The heavier amounts ranged from 1.0 to 1.3 along a Greene county to Allen county line and in Rush county. In the rest of the state up to 1.0 totals were summed. The heaviest single day amounts were found in the September 18 th morning reports and included 1.60 near Rushville, 1.45 at Paoli, 1.26 in Granger, 1.17 outside Spencer, and 1.10 at Russiaville. Among weekly totals Paoli had 1.45, Spencer 1.17, Leo 0.95, and Gosport According to the September 20 th edition of the US Drought Monitor there was slight improvement in Indiana soil moisture status. The abnormally dry (D0 category) area was erased in Allen county, reducing state D0 coverage from 2% to 1% of total Indiana land area, leaving 99% of Indiana land in normal soil moisture status for this time of year. Essentially only Noble county is still rated in any type of dryness in Indiana as of the map date. The hot and humid weather this week helped speed up the rate of corn and soybean harvesting. The final cutting of hay was made but it was slow to dry in the high humidity. Winter wheat planting is a little behind but is keeping up with the soybean harvest. An abundance of weeds and insects persisted. Livestock in pastures were doing mostly well. Corn maturity had reached 75% across the state. Soybeans were also near 75% done. September 25 th 30 th A closed low pressure system in the upper atmosphere was sidelined off the main weather track and dominated Indiana these final days of September. Abnormally warm state temperatures at the start of the 6 day interval were replaced by sharply colder conditions to the end of the month. The closed system produced intermittent rain showers in Indiana on 5 of the 6 days. The frequent showers
8 halted field work and harvest progress. Yet all or parts of 14 counties near the Ohio River were deemed abnormally dry by the US Drought Monitor. High pressure over Pennsylvania on September 25 th brought light winds and sunny skies to Indiana, boosting the state temperature to a warm 13 F above normal. A very narrow warm air sector raced through Indiana the next day. The storm whipped its warm front, then immediately afterward its cold front, miles ahead of its own core anchored near Hudson Bay. The storm core was held back by an intensifying closed low pressure system in the upper atmosphere. The surface air temperature behind the cold front was sharply colder. The Indiana state temperature plummeted to 3 F above normal. On September 27 th the cold front roared east to the Atlantic coast, far outpacing its storm core then over Lake Superior. The northern part of the cold front was severely wrapped around the storm center as an occluded front headed north into Quebec. Back in Indiana cold air advection continued. The state temperature kept falling to 1 F below normal. The next day the spent mature storm dissolved over Lake Michigan, transferring its energy to a new occluded low center over Indiana. The state temperature bottomed out at 4 F below normal as colder air poured into the state. In the upper atmosphere the closed low center drifted south over Indiana, marking the pool of coldest air. On September 29 th the cold front dove southeast from Indiana to South Carolina. The upper atmospheric closed low moved to Kentucky, near enough to Indiana to generate rainfall statewide. The state temperature slightly recovered to 2 F below normal. On the last day of the month the old surface storm system moved little towards the Atlantic shore but rain persisted in Indiana as troughs reached back from the coastal fronts. Under cloudy and cool skies the state temperature finished the month at 1 F below normal. In the upper atmosphere the closed low settled in isolation over Kentucky, far removed from the storm track. For the 6 day interval the Indiana state temperature averaged to 1 F above normal. Typically at the end of September the daily maximum temperature should range between 69 F and 78 F north to south across the state. Daily minimums normally vary from 48 F in the far northern counties to 51 F in the southwest corner of the state. The warmest temperature over the 6 days was 93 F at several locations on September 25 th and 26 th in the cooperative station network. The coolest temperature among stations within that same network was 42 F at Shoals 8s on September 28 th. It was a wet 6 day interval with rainfall recorded on every day except September 25 th. Rainfall was observed statewide on September 29 th and 30 th. On the 6 day total rainfall map precipitation was heaviest in the southeast half of the state. More than an inch fell generally south of a Sullivan to Greene to Adams county line as well as including Lagrange, Steuben, Noble, and DeKalb counties of northeast Indiana. The heaviest rain exceeded 2 in Washington and Steuben counties. It was drier in northwest Indiana with under an inch. Less than a half inch was measured in parts of west central and north central Indiana. The heaviest single day amounts were noted on September 29 th with 1.79 and 1.75 measured by two CoCoRaHS observers near Hudson. In the Angola area 1.65 was collected. Three days earlier 1.64 was in the rain gage at Plainville while 1.44 was found in the Washington gage. The largest 6 day totals included 2.49 and 2.46 outside Hudson and 2.31 at Oolitic. Outside Angola the sums were 2.28 and 2.24 over the 6 day interval. Regionally about 0.9 was tallied in northern
9 Indiana, 1.0 in central, and 1.1 in the south. These amounts equate to about 140% of normal in the north, 170% of normal in central counties, and 180% of normal across southern Indiana. A new region of abnormally dry soils was added to far southern Indiana by the US Drought Monitor on September 27 th. Nearly all of Vanderburgh, Warrick, Dubois, Spencer, Perry, Crawford, Orange, Washington, Harrison, Floyd, Clark, Scott, and parts of Gibson and Pike counties were given a D0 category designation. The Noble county D0 rating remained from the previous week. The resulting D0 state coverage had increased from 1% a week ago to 15% on September 27 th. The net Indiana land area with adequate soil moisture had decreased from 99% to 85%. According to the October 3 rd USDA Indiana weekly crop and weather report the frequent showers caused by the upper atmospheric closed low had halted fieldwork and harvest progress. Pastures were lush and livestock were in good condition. Corn had advanced to 87% mature and safe from frost while about 80% of soybeans had dropped their leaves. Soybean harvest was falling behind normal. Weeds and mold continued to be headaches for farmers.
10 September 2016 Temperature Region Temperature Normal Deviation Northwest North Central Northeast West Central Central East Central Southwest South Central Southeast State Precipitation Region Precipitation Normal Deviation Percent of Normal Northwest North Central Northeast West Central Central East Central Southwest South Central Southeast State
11 Autumn so far (same as September) Temperature Region Temperature Normal Deviation Northwest North Central Northeast West Central Central East Central Southwest South Central Southeast State Precipitation Region Precipitation Normal Deviation Percent of Normal Northwest North Central Northeast West Central Central East Central Southwest South Central Southeast State
12 2016 Annual so far (Jan - Sep) Temperature Region Temperature Normal Deviation Northwest North Central Northeast West Central Central East Central Southwest South Central Southeast State Precipitation Region Precipitation Normal Deviation Percent of Normal Northwest North Central Northeast West Central Central East Central Southwest South Central Southeast State
13
14
15

16 Drought Summary from the U.S. Drought Monitor Below is a drought summary for the state of Indiana from the U.S. Drought Monitor. Areas in white are not experiencing any drought. Yellow areas are abnormally dry, but not considered a drought. Drought begins when the moisture levels become more severe, with beige, orange, red, and brown indicating increasing levels of drought (moderate, severe, extreme, and exceptional, respectively). The table below indicates what percentage of the state is drought free, and how much of the state is in drought by degree of severity (D1 - D4 category).
17 Sep 6 th Drought Summary
18 Sep 13 th Drought Summary
19 Sep 20 th Drought Summary
20 Sep 27 th Drought Summary
October 2011 Climate Summary
 Ken Scheeringa and Kayla Hudson Nov 4, 2011 http://www.iclimate.org October 2011 Climate Summary Month Summary October weather evolved as a two part story. Weather conditions the first half of the month
August 2017 Climate Summary
 Ken Scheeringa And Andy Eggert Sep 7, 2017 (765) 494-8105 http://www.iclimate.org August 2017 Climate Summary Month Summary The coolest August in 13 years featured long cool and warm spells, below normal
August 2013 Climate Summary
 Ken Scheeringa and Matt Price Sep 6, 2013 (765) 494-8105 http://www.iclimate.org August 2013 Climate Summary Month Summary August weather began cool and wet but became progressively warmer and drier through
July 2007 Climate Summary
 Dan Bowman (765) 494-6574 Sep 3, 2007 http://www.iclimate.org Summary July 2007 Climate Summary The month of July ended as a very unusual month. Many events occurred during the month of July that is not
November 2012 Climate Summary
 Ken Scheeringa and Kayla Hudson Dec 6, 2012 (765) 494-8105 http://www.iclimate.org November 2012 Climate Summary Month Summary November was one of those rare weather months in Indiana when not much happened:
October 2016 Climate Summary
 Ken Scheeringa And Andy Eggert Nov 9, 2016 (765) 494-8105 http://www.iclimate.org October 2016 Climate Summary Month Summary October was the 9 th month so far this year to average above normal in temperature.
October 2017 Climate Summary
 Ken Scheeringa and Andy Eggert Nov 6, 2017 (765) 494-8105 http://www.iclimate.org October 2017 Climate Summary Month Summary After more than three weeks of warm temperatures October turned suddenly cold
August 2006 Summary. August 1-5
 Ashley Brooks (765) 494-6574 Sep 8, 2006 http://www.iclimate.org August 1-5 August 2006 Summary The heat wave that started during the end of July continued into the beginning parts of August with temperatures
August 2015 Climate Summary
 Ken Scheeringa And Mary Rose Mangan Sep 4, 2015 (765) 494-8105 http://www.iclimate.org August 2015 Climate Summary Month Summary A very active wet summer weather pattern turned much calmer and drier in
May 2016 Climate Summary
 Ken Scheeringa And Andy Eggert Jun 6, 2016 (765) 494-8105 http://www.iclimate.org May 2016 Climate Summary Month Summary Cold weather dominated in May until the last week of the month. May began wet but
January 2017 Climate Summary
 Ken Scheeringa And Andy Eggert Feb 8, 2017 (765) 494-8105 http://www.iclimate.org January 2017 Climate Summary Month Summary The warmest January in 11 years was nearly 4 F warmer than December 2016. An
October 2014 Climate Summary
 Ken Scheeringa And Matt Price Nov 10, 2014 (765) 494-8105 http://www.iclimate.org October 2014 Climate Summary Month Summary October featured a mix of weather. A very wet first half of the month evolved
September 2011 Climate Summary
 Ken Scheeringa and Kayla Hudson Oct 5, 2011 (765) 494-8105 http://www.iclimate.org September 2011 Climate Summary Month Summary The final blast of summer heat arrived at the start of September. It lasted
October 2012 Climate Summary
 Ken Scheeringa and Kayla Hudson Nov 8, 2012 (765) 494-8105 http://www.iclimate.org October 2012 Climate Summary Month Summary In a reversal from the hot and dry summer, cooler and wetter than normal conditions
May 2018 Climate Summary
 Ken Scheeringa and Andy Eggert Jun 7, 2018 (765) 494-8105 http://www.iclimate.org May 2018 Climate Summary Month Summary As the calendar turned from April to May temperatures flipped dramatically away
February 2017 Climate Summary
 Ken Scheeringa And Andy Eggert Mar 9, 2017 (765) 494-8105 http://www.iclimate.org February 2017 Climate Summary Month Summary February 2017 was the warmest February in Indiana since state climate records
March 2014 Climate Summary
 Ken Scheeringa And Matt Price Apr 8, 2014 (765) 494-8105 http://www.iclimate.org March 2014 Climate Summary Month Summary Winter had officially ended by the calendar but snow and cold persisted in Indiana
January 2008 Climate Summary
 Joseph Mays (765) 494-6574 Feb 5, 2008 http://www.iclimate.org Summary January 2008 Climate Summary January was a mix bag of conditions, with an oscillatory pattern developing. We experienced phases of
December 2011 Climate Summary
 Ken Scheeringa and Kayla Hudson Jan 17, 2012 (765) 494-8105 http://www.iclimate.org December 2011 Climate Summary Month Summary What a difference a year makes! A year ago the misery of a harsh, cold, and
January 2006 Climate Summary
 Ashley Brooks (765) 494-6574 Feb 9, 2006 http://www.iclimate.org January 1-3 January 2006 Climate Summary Unseasonably warm conditions welcomed in the New Year with highs in the 40s across the northern
November 2015 Climate Summary
 Ken Scheeringa And Mary Rose Mangan Dec 8, 2015 (765) 494-8105 http://www.iclimate.org November 2015 Climate Summary Month Summary November was much warmer than normal while precipitation was very near
June 2016 Climate Summary
 Ken Scheeringa And Andy Eggert Jul 8, 2016 (765) 494-8105 http://www.iclimate.org June 2016 Climate Summary Month Summary June was a warm month with below normal temperature on just 6 days. Rainfall was
April 2015 Climate Summary
 Ken Scheeringa And Mary Rose Mangan May 8, 2015 http://www iclimate org April 2015 Climate Summary Month Summary April was a month of extremes. Severe weather erupted on 4 days of the first week with multiple
March 2016 Climate Summary
 Ken Scheeringa And Andy Eggert Apr 8, 2016 (765) 494-8105 http://www.iclimate.org March 2016 Climate Summary Month Summary Count March as the 7 th month in a row that the state average temperature has
April 2016 Climate Summary
 Ken Scheeringa And Andy Eggert May 9, 2016 (765) 494-8105 http://www.iclimate.org April 2016 Climate Summary Month Summary One month but two seasons. The first half of April was cold with snow. Wind damage
September 2005 Climate Summary
 Ashley Brooks (765) 494-6574 Oct 5, 2005 http://iclimate.org September 2005 Climate Summary September 1-7 A cold front came through on the 1 st of the month, however little moisture was associated with
January 2018 Climate Summary
 Ken Scheeringa and Andy Eggert Feb 8, 2018 (765) 494-8105 http://www.iclimate.org January 2018 Climate Summary Month Summary January temperature swings were amazing. In the first few days arctic cold pushed
November 2016 Climate Summary
 Ken Scheeringa And Andy Eggert Dec 15, 2016 (765) 494-8105 http://www.iclimate.org November 2016 Climate Summary Month Summary Unseasonably warm, pleasant, and sunny weather the first half of the month
2011 Year in Review TORNADOES
 2011 Year in Review The year 2011 had weather events that will be remembered for a long time. Two significant tornado outbreaks in April, widespread damage and power outages from Hurricane Irene in August
April 2013 Climate Summary
 Ken Scheeringa and Kayla Hudson May 6, 2013 (765) 494-8105 http://www.iclimate.org April 2013 Climate Summary Month Summary Temperatures bounced high and low this month, keeping Hoosiers guessing which
April 2017 Climate Summary
 Ken Scheeringa And Andy Eggert May 8, 2017 (765) 494-8105 http://www.iclimate.org April 2017 Climate Summary Month Summary April was a very warm and wet month in Indiana, nearly setting a new monthly temperature
Monthly Long Range Weather Commentary Issued: SEPTEMBER 19, 2016 Steven A. Root, CCM, Chief Analytics Officer, Sr. VP,
 Monthly Long Range Weather Commentary Issued: SEPTEMBER 19, 2016 Steven A. Root, CCM, Chief Analytics Officer, Sr. VP, sroot@weatherbank.com SEPTEMBER 2016 Climate Highlights The Month in Review The contiguous
September 2012 Climate Summary
 Ken Scheeringa and Kayla Hudson Oct 5, 2012 (765) 494-8105 http://www.iclimate.org September 2012 Climate Summary Month Summary Summer slipped away and it felt a lot more like autumn in Indiana this month
November 2014 Climate Summary
 Ken Scheeringa And Matt Price Dec 10, 2014 (765) 494-8105 http://www.iclimate.org November 2014 Climate Summary Month Summary Unseasonable cold headlined the Indiana and national news in November. The
March 2018 Climate Summary
 Ken Scheeringa and Andy Eggert Apr 5, 2018 (765) 494-8105 http://www.iclimate.org March 2018 Climate Summary Month Summary March turned cold with below normal temperatures on two-thirds of its days. Along
2012 Growing Season Weather Summary for North Dakota. Adnan Akyüz and Barbara A. Mullins Department of Soil Science October 30, 2012
 2012 Growing Season Weather Summary for North Dakota Adnan Akyüz and Barbara A. Mullins Department of Soil Science October 30, 2012 Introduction The 2012 growing season (the period from April through September)
May 2005 Climate Summary
 Ashley Brooks (765) 494-6574 Jun 7, 2005 http://iclimate.org May 2005 Climate Summary May 1-5 Early May was characterized by an upper-level trough that was in place over Indiana that brought in very cool
November 2017 Climate Summary
 Ken Scheeringa and Andy Eggert Dec 8, 2017 (765) 494-8105 http://www.iclimate.org November 2017 Climate Summary Month Summary November temperatures alternated spells of warm and cool while precipitation
May 2015 Climate Summary
 Ken Scheeringa And Mary Rose Mangan Jun 8, 2015 (765) 494-8105 http://www.iclimate.org May 2015 Climate Summary Month Summary May was a very warm month. Rainfall averaged near normal but was distributed
The hydrologic service area (HSA) for this office covers Central Kentucky and South Central Indiana.
 for this office covers Central Kentucky and South Central Indiana.") January 2012 February 13, 2012 An X inside this box indicates that no flooding occurred within this hydrologic service area. January 2012 continued the string of wet months this winter. Rainfall was generally
January 2012 February 13, 2012 An X inside this box indicates that no flooding occurred within this hydrologic service area. January 2012 continued the string of wet months this winter. Rainfall was generally
CropCast Corn and Soybean Report Kyle Tapley Monday, March 20, 2017
 Accumulated Rainfall (inches) Accumulated GDDs Temperature ( F)/Wind Speed (mph) Precipitation (inches) CropCast Corn and Soybean Report Kyle Tapley Monday, March 20, 2017 Peoria, IL Regional Forecast
August 2016 Climate Summary
 Ken Scheeringa And Andy Eggert Sep 12, 2016 (765) 494-8105 http://www.iclimate.org August 2016 Climate Summary Month Summary Hot but tranquil weather the first half of August transitioned to a tormented
Crop / Weather Update
 Crop / Weather Update Corn Crop Condition Percent of Acreage Rated Good or Excellent 85 80 75 70 65 60 55 50 45 Corn condition this week is the same as the last two weeks in the good/excellent category,
Weather and Climate Summary and Forecast August 2018 Report
 Weather and Climate Summary and Forecast August 2018 Report Gregory V. Jones Linfield College August 5, 2018 Summary: July 2018 will likely go down as one of the top five warmest July s on record for many
Crop / Weather Update
 Crop / Weather Update Corn Crop Condition Percent of Acreage Rated Good or Excellent 85 80 75 70 65 60 55 50 45 As of September 9, USDA rates the crop at 68% good to excellent. The rating is up one point
Weather and Climate Summary and Forecast October 2017 Report
 Weather and Climate Summary and Forecast October 2017 Report Gregory V. Jones Linfield College October 4, 2017 Summary: Typical variability in September temperatures with the onset of fall conditions evident
Weather and Climate Summary and Forecast Summer 2017
 Weather and Climate Summary and Forecast Summer 2017 Gregory V. Jones Southern Oregon University August 4, 2017 July largely held true to forecast, although it ended with the start of one of the most extreme
CropCast Corn and Soybean Report Kenny Miller Tuesday, March 14, 2017
 Accumulated Rainfall (inches) Accumulated GDDs Temperature ( F)/Wind Speed (mph) Precipitation (inches) CropCast Corn and Soybean Report Kenny Miller Tuesday, March 14, 2017 Peoria, IL Regional Forecast
Champaign-Urbana 1999 Annual Weather Summary
 Champaign-Urbana 1999 Annual Weather Summary ILLINOIS STATE WATER SURVEY 2204 Griffith Dr. Champaign, IL 61820 wxobsrvr@sws.uiuc.edu Maria Peters, Weather Observer A major snowstorm kicked off the new
UNITED STATES AND SOUTH AMERICA OUTLOOK (FULL REPORT) Thursday, December 28, 2017
 Thursday, December 28, 2017") T-storm Weather Summary Despite scattered t-storms Sat.-Sun. in central and northern areas in Argentina, more will likely be needed especially in sunflower areas of the southwest. Some t-storms likely
T-storm Weather Summary Despite scattered t-storms Sat.-Sun. in central and northern areas in Argentina, more will likely be needed especially in sunflower areas of the southwest. Some t-storms likely
Crop / Weather Update
 Crop / Weather Update The next will be published November 13, 2018, due to the Veteran s Day holiday on Monday. Corn Harvesting Progress 100% 90% 80% 70% 60% 50% 40% 30% 20% 10% 0% 9/9 9/16 9/23 9/30 10/7
Crop / Weather Update
 Crop / Weather Update Corn Crop Condition Percent of Acreage Rated Good or Excellent 85 80 75 70 65 60 55 50 45 The U.S. corn crop was rated 69% good-to-excellent on September 23, up 1% from week-ago,
National Wildland Significant Fire Potential Outlook
 National Wildland Significant Fire Potential Outlook National Interagency Fire Center Predictive Services Issued: September, 2007 Wildland Fire Outlook September through December 2007 Significant fire
Monthly Long Range Weather Commentary Issued: July 18, 2014 Steven A. Root, CCM, President/CEO
 Monthly Long Range Weather Commentary Issued: July 18, 2014 Steven A. Root, CCM, President/CEO sroot@weatherbank.com JUNE 2014 REVIEW Climate Highlights The Month in Review The average temperature for
November 2010 Climate Summary
 Ken Scheeringa (765) 494-8105 Dec 6, 2010 http://www.iclimate.org November 2010 Climate Summary Summary A four month drought in Indiana is collapsing as significant rain fell the final week of November.
Table 1. August average temperatures and departures from normal ( F) for selected cities.
 for selected cities.") Climate Summary for Florida August 2016 Prepared by Lydia Stefanova and David Zierden Florida Climate Center, The Florida State University, Tallahassee, Florida Online at: http://climatecenter.fsu.edu/products-services/summaries
Climate Summary for Florida August 2016 Prepared by Lydia Stefanova and David Zierden Florida Climate Center, The Florida State University, Tallahassee, Florida Online at: http://climatecenter.fsu.edu/products-services/summaries
Crop / Weather Update
 Crop / Weather Update Corn Crop Condition Percent of Acreage Rated Good or Excellent 85 80 75 70 65 60 55 50 45 In its weekly Crop Progress Report for September 16, the USDA stated the 18-state average
The Pennsylvania Observer
 The Pennsylvania Observer August 3, 2015 July 2015 - Pennsylvania Weather Recap By: Arthur Person Although this seventh month of 2015 was fairly normal across Pennsylvania as a whole, the details reveal
CropCast Corn and Soybean Report Kenny Miller Monday, March 13, 2017
 Accumulated Rainfall (inches) Accumulated GDDs Temperature ( F)/Wind Speed (mph) Precipitation (inches) CropCast Corn and Soybean Report Kenny Miller Monday, March 13, 2017 Peoria, IL Regional Forecast
WeatherManager Weekly
 Issue 288 July 14, 2016 WeatherManager Weekly Industries We Serve Agriculture Energy/Utilities Construction Transportation Retail Our Weather Protection Products Standard Temperature Products Lowest Daily
NWS FORM E-5 U.S. DEPARTMENT OF COMMERCE I HYDRO SERVICE AREA NOAA, NATIONAL WEATHER SERVICE I Indianapolis, IN MONTHLY REPORT
 NWS FORM E-5 U.S. DEPARTMENT OF COMMERCE I HYDRO SERVICE AREA NOAA, NATIONAL WEATHER SERVICE I Indianapolis, IN. 1-------------------- MONTHLY REPORT OF RIVER AND FLOOD CONDITIONSI REPORT FOR I November
Monthly Long Range Weather Commentary Issued: APRIL 18, 2017 Steven A. Root, CCM, Chief Analytics Officer, Sr. VP,
 Monthly Long Range Weather Commentary Issued: APRIL 18, 2017 Steven A. Root, CCM, Chief Analytics Officer, Sr. VP, sroot@weatherbank.com MARCH 2017 Climate Highlights The Month in Review The average contiguous
SEPTEMBER 2013 REVIEW
 Monthly Long Range Weather Commentary Issued: October 21, 2013 Steven A. Root, CCM, President/CEO sroot@weatherbank.com SEPTEMBER 2013 REVIEW Climate Highlights The Month in Review The average temperature
Crop / Weather Update
 Crop / Weather Update This is our last for the 2018 planting, growing and harvesting seasons. USDA will publish their Crop Progress Report again in April 2019, and we will continue our coverage sometime
The Pennsylvania Observer
 The Pennsylvania Observer October 1, 2015 September 2015 - Pennsylvania Weather Recap By: Quinn Lease The month of September will be remembered for its above normal temperatures and dry conditions that
Champaign-Urbana 2001 Annual Weather Summary
 Champaign-Urbana 2001 Annual Weather Summary ILLINOIS STATE WATER SURVEY 2204 Griffith Dr. Champaign, IL 61820 wxobsrvr@sws.uiuc.edu Maria Peters, Weather Observer January: After a cold and snowy December,
The Pennsylvania Observer
 The Pennsylvania Observer September 3, 2008 Summer 2008 Weather Summary Written by: Brian Thompson The opening days of June started dry, but a warm front brought a widespread rain a couple of days into
NATIONAL WEATHER SERVICE
 January 2016 February 9, 2016 This was a dry month across the HSA despite one large and several smaller snowfalls. Most locations ended up 1-2 inches below normal for the month. The driest locations at
CropCast Corn and Soybean Report Kenny Miller Friday, March 17, 2017
 Accumulated Rainfall (inches) Accumulated GDDs Temperature ( F)/Wind Speed (mph) Precipitation (inches) CropCast Corn and Soybean Report Kenny Miller Friday, March 17, 2017 Peoria, IL Regional Forecast
but 2012 was dry Most farmers pulled in a crop
 After a winter that wasn t, conditions late in the year pointed to a return to normal snow and cold conditions Most farmers pulled in a crop but 2012 was dry b y M i k e Wr o b l e w s k i, w e a t h e
UNITED STATES AND SOUTH AMERICA OUTLOOK (FULL REPORT) Wednesday, April 18, 2018
 Wednesday, April 18, 2018") T-storm Weather Summary Coolness continues over the next week in much of the central U.S., most likely producing the coldest April since 1907 in the Corn Belt, but followed by seasonable to mild weather
T-storm Weather Summary Coolness continues over the next week in much of the central U.S., most likely producing the coldest April since 1907 in the Corn Belt, but followed by seasonable to mild weather
January 2012 Climate Summary
 Ken Scheeringa and Kayla Hudson Feb 6, 2012 (765) 494-8105 http://www.iclimate.org January 2012 Climate Summary Month Summary Where is winter? This question found its way into many conversations throughout
June 2010 Climate Summary
 Ken Scheeringa (765) 494-8105 Jul 6, 2010 http://www.iclimate.org June 2010 Climate Summary Summary Summer like heat and humidity arrived in Indiana on May 22 nd and dominated our weather scene nearly
2018 Year in Review for Central and Southeast Illinois By: Chris Geelhart, Meteorologist National Weather Service, Lincoln IL
 By: Chris Geelhart, Meteorologist National Weather Service, Lincoln IL While 2018 featured some significant out-of-season weather, including below zero temperatures in April and 90-degree highs in early
Champaign-Urbana 1998 Annual Weather Summary
 Champaign-Urbana 1998 Annual Weather Summary ILLINOIS STATE WATER SURVEY Audrey Bryan, Weather Observer 2204 Griffith Dr. Champaign, IL 61820 wxobsrvr@sparc.sws.uiuc.edu The development of the El Nìno
The hydrologic service area (HSA) for this office covers Central Kentucky and South Central Indiana.
 for this office covers Central Kentucky and South Central Indiana.") MONTH YEAR January 2011 February 15, 2011 X An X inside this box indicates that no flooding occurred within this hydrologic service area. January 2011 was drier than normal in all locations in the area.
MONTH YEAR January 2011 February 15, 2011 X An X inside this box indicates that no flooding occurred within this hydrologic service area. January 2011 was drier than normal in all locations in the area.
National Drought Summary August 14, 2018
 National Drought Summary August 14, 2018 The discussion in the Looking Ahead section is a description of what the official national guidance from the National Weather Service (NWS) National Centers for
January 2013 Climate Summary
 Ken Scheeringa and Kayla Hudson Feb 7, 2013 (765) 494-8105 http://www.iclimate.org January 2013 Climate Summary Month Summary Winter or spring? January featured several dramatic swings in temperature and
Weather and Climate Summary and Forecast October 2018 Report
 Weather and Climate Summary and Forecast October 2018 Report Gregory V. Jones Linfield College October 4, 2018 Summary: Much of Washington, Oregon, coastal California and the Bay Area and delta region
Monthly Long Range Weather Commentary Issued: May 15, 2014 Steven A. Root, CCM, President/CEO
 Monthly Long Range Weather Commentary Issued: May 15, 2014 Steven A. Root, CCM, President/CEO sroot@weatherbank.com APRIL 2014 REVIEW Climate Highlights The Month in Review The average temperature for
L.O Students will learn about factors that influences the environment
 Name L.O Students will learn about factors that influences the environment Date 1. At the present time, glaciers occur mostly in areas of A) high latitude or high altitude B) low latitude or low altitude
Monthly Long Range Weather Commentary Issued: NOVEMBER 16, 2015 Steven A. Root, CCM, Chief Analytics Officer, Sr. VP, sales
 Monthly Long Range Weather Commentary Issued: NOVEMBER 16, 2015 Steven A. Root, CCM, Chief Analytics Officer, Sr. VP, sales sroot@weatherbank.com OCTOBER 2015 Climate Highlights The Month in Review The
KANSAS CLIMATE SUMMARY August 2015
 KANSAS CLIMATE SUMMARY August 2015 Cool and Dry August was drier than normal in most of the state. State-wide average precipitation was 2.80 inches or 85 percent of normal. The Northeast division of the
Summary of November Central U.S. Winter Storm By Christopher Hedge
 Summary of November 12-13 2010 Central U.S. Winter Storm By Christopher Hedge Event Overview The first significant snowfall of the 2010-2011 season affected portions of the plains and upper Mississippi
The Weather Wire. Contents: Summer 2018 Outlook. Summer 2018 Outlook Drought Monitor May Summary/Statistics June Preview Rainfall Totals
 The Weather Wire June 2018 Volume 25 Number 6 Contents: Summer 2018 Outlook Drought Monitor May Summary/Statistics June Preview Rainfall Totals Summer 2018 Outlook June 1 st marked the first day of meteorological
July 2010 Climate Summary
 Ken Scheeringa (765) 494-8105 Aug 4, 2010 http://www.iclimate.org July 2010 Climate Summary Summary The warm summer of 2010 continues. Daily state average temperatures were above normal on all but seven
July 2014 Climate Summary
 Ken Scheeringa And Matt Price Aug 8, 2014 (765) 494-8105 http://www.iclimate.org July 2014 Climate Summary Month Summary July was unseasonably cool and drier than normal. Rainfall was light in parts of
Weather and Climate Risks and Effects on Agriculture
 Weather and Climate Risks and Effects on Agriculture Dr. Eric Snodgrass Official Journal of the Fluid Fertilizer Foundation Vol. 26, No. 2, Issue #100 DOWNLOAD Summary: So, what do we need to watch for?
Weather and Climate Summary and Forecast March 2018 Report
 Weather and Climate Summary and Forecast March 2018 Report Gregory V. Jones Linfield College March 7, 2018 Summary: The ridge pattern that brought drier and warmer conditions from December through most
Custom Weather Forecast
 1 of 23 Custom Weather Forecast 2018 Chicago Yacht Club s Race To Mackinac- Cruising Division Disclaimer: The user assumes all risk related to the use of this Custom Weather Forecast. The crew of the participating
1. Which weather map symbol is associated with extremely low air pressure? A) B) C) D) 2. The diagram below represents a weather instrument.
 B) C) D) 2. The diagram below represents a weather instrument.") 1. Which weather map symbol is associated with extremely low air pressure? 2. The diagram below represents a weather instrument. Which weather variable was this instrument designed to measure? A) air pressure
1. Which weather map symbol is associated with extremely low air pressure? 2. The diagram below represents a weather instrument. Which weather variable was this instrument designed to measure? A) air pressure
March 2009 Climate Summary
 Joseph Mays (765) 494-6574 Apr 1, 2009 http://www.iclimate.org Summary March 2009 Climate Summary March is in the books and it continued the trend of extreme weather we have experienced during the first
Weather and Climate Summary and Forecast November 2017 Report
 Weather and Climate Summary and Forecast November 2017 Report Gregory V. Jones Linfield College November 7, 2017 Summary: October was relatively cool and wet north, while warm and very dry south. Dry conditions
The Pennsylvania Observer
 The Pennsylvania Observer January 5, 2009 December 2008 Pennsylvania Weather Recap The final month of 2008 was much wetter than average and a bit colder than normal. In spite of this combination, most
February 2016 Climate Summary
 Ken Scheeringa And Andy Eggert Mar 9, 2016 (765) 494-8105 http://www.iclimate.org February 2016 Climate Summary Month Summary February was the 6 th consecutive month with an above normal state average
Guided Notes Weather. Part 2: Meteorology Air Masses Fronts Weather Maps Storms Storm Preparation
 Guided Notes Weather Part 2: Meteorology Air Masses Fronts Weather Maps Storms Storm Preparation The map below shows North America and its surrounding bodies of water. Country borders are shown. On the
Monthly Long Range Weather Commentary Issued: APRIL 1, 2015 Steven A. Root, CCM, President/CEO
 Monthly Long Range Weather Commentary Issued: APRIL 1, 2015 Steven A. Root, CCM, President/CEO sroot@weatherbank.com FEBRUARY 2015 Climate Highlights The Month in Review The February contiguous U.S. temperature
Weather and Climate Summary and Forecast February 2018 Report
 Weather and Climate Summary and Forecast February 2018 Report Gregory V. Jones Linfield College February 5, 2018 Summary: For the majority of the month of January the persistent ridge of high pressure
Weather and Climate Summary and Forecast April 2018 Report
 Weather and Climate Summary and Forecast April 2018 Report Gregory V. Jones Linfield College April 4, 2018 Summary: A near Miracle March played out bringing cooler and wetter conditions to the majority
KANSAS CLIMATE SUMMARY January 2018
 KANSAS CLIMATE SUMMARY January 2018 Some welcome moisture After an extended period with little to no moisture, parts of Kansas recorded some significant precipitation. At Tribune, a small snow event on