October 2012 Climate Summary
|
|
|
- Janis Dalton
- 5 years ago
- Views:
Transcription

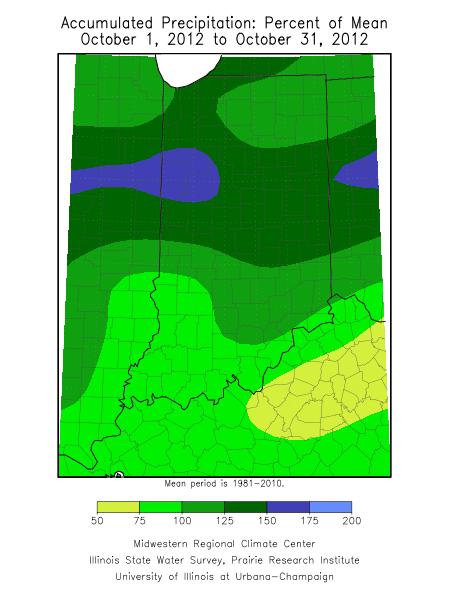
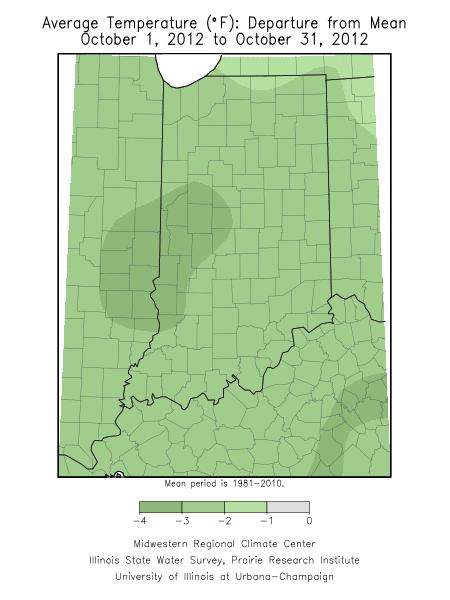
1 Ken Scheeringa and Kayla Hudson Nov 8, 2012 (765) October 2012 Climate Summary Month Summary In a reversal from the hot and dry summer, cooler and wetter than normal conditions are the new trend for a third month in Indiana. The 2012 drought continues to fade across the state. By the end of October less than 10% of Indiana area remains in at least moderate drought status according to the US Drought Monitor. More than half the state has recovered to normal soil moisture levels for this time of year. A hard and sudden freeze on October 8 th ended the 2012 growing season in the northern half of the state with most southern counties following later. The remnants of two tropical systems visited Indiana this month, one to start the month and the second at the very end. The leftovers of Tropical Storm Norman made its way from the Baja of Mexico to Indiana, causing temperature swings and pesky showers on October 2 nd, 3 rd, and 4 th, but left no other real impacts. Later on October 30 th and 31 st, Superstorm Sandy wandered westward toward Indiana after making landfall in New Jersey. Northerly wind gusts piled water to near record wave heights on southern Lake Michigan. Onshore winds caused damage in Porter county. A few snow showers mixed in with the rainfall over eastern Indiana. The state average October temperature was 51.7 F, a departure of 2.2 F below normal and the 25 th coldest October since The most recent cooler October was 50.3 F in 2009, ranking in 10 th place. In 2006 the state average temperature was 51.0 F, good for 17 th place. The October in drought year 1988 averaged 47.2 F, the 4 th coolest on record. The day split results for October 2012 are 19 days of below normal temperature, 1 day at normal, and 11 days with above normal temperature. On 3 days the state average temperature was at least 10 F above normal in contrast to 6 days at least 10 F below normal. The highest official temperature in the state was 84 F on October 22 nd at Boonville. The coolest daily official October temperature was 21 F recorded on October 8 th at Wanatah. This date marked the earliest first autumn freeze in 11 years for many Indiana communities. Temperatures this day fell below 28 F in much of the northern half of the state, a killing freeze that ended the 2012 growing season. The state precipitation total was 3.97 inches, or 1.07 inches above normal. This total ties 1985 as the 26 th wettest October on record. There have been several wetter Octobers since The most recent was in 2009 with 6.79 inches that ranks in 4 th place. Then there was the 5.09 inches of 2006, placing at 10 th, and the 4.26 inches of 2004 in 21 st place. The wettest October in recent times was the 7.72 inch total in 2001, coming in at 2 nd place since state records began in Regionally rainfall this month was about 140% of normal in northern Indiana, 160% of normal in central, and 120% of normal in southern counties. The highest daily cooperative station rainfall report this month was 2.21 inches, measured at Tipton on October 24 th. In the CoCoRaHS network the
2 heaviest single day rainfall amount was 2.15 inches at Eaton on October 6 th. Precipitation generally fell on about 17 days in Indiana this month. The first snow showers of the season were few and scattered as Superstorm Sandy tracked westward. Fort Wayne, Leesburg, and Winchester all reported their first measurable snowfall total of 0.1 inch this month. Superstorm Sandy caused severe weather damage near the end of the month. On October 30 th high onshore winds up to 70 mph caused building and vehicle damage at the Indiana Dunes park. Wave heights in southern Lake Michigan reached nearly 22 feet, the second highest on record. These waves were a remarkable 11 feet higher than at the north end of the lake. October 1 st 7 th It was a rainy first week of the month with a fast 22 F swing in state average temperature. The remnants of Tropical Storm Norman impacted Indiana weather to start October, similar to Isaac last month, but unlike Isaac in its history and intensity. Norman originated in the east Pacific Ocean. It made landfall in the Baja region of Mexico on September 29 th, traveled east to Texas as a tropical depression, then turned northward from Mississippi to reach Indiana on October 2 nd. Though Norman arrived as a weakened storm, its tropical warmth and humidity were evidenced by an upward spike in Indiana temperatures and circular rain shower pattern. To begin the Norman remnants displaced a cold high pressure center over Indiana on October 2 nd. The next day the storm retreated westward to Illinois, placing Indiana squarely into a warm air flow from the Gulf of Mexico. Indiana temperatures were on the rise these first 4 days of the month. Temperatures climbed steadily from 6 F below normal to peak at near 8 F above normal. The warm flow expanded in coverage on October 4 th but in the upper atmosphere Norman was collapsing and its energy being exported to other low pressure systems. The next day a sweeping cold front marched across the Midwest and Indiana, lowering temperatures by 8 F. A strong cold air flow continued into October 6 th and average temperatures crashed to 14 F below normal. Pressure waves intensified in the upper atmosphere, opening the gateway to more Alaskan cold. A second cold front moved through Indiana on October 7 th, reinforcing the cold as the week ended. For the week state temperatures averaged about 4 F below normal. Typically for this first week of October daily maximum temperatures should vary between 67 F and 74 F north to south across the state. Daily minimums normally range between 46 F in far northern Indiana to 49 F in southwestern counties. Tropical storms can have a circular rainfall pattern with showers north of the low center moving east to west while those south of the center move west to east. This was seen on Indiana radar at least some of the time. The Norman remnants were weak and precipitation persisted as small rain showers and drizzle for much of its duration. The bulk of Indiana rainfall came later this week with the passage of the first cold front. Overall for the week rainfall totaled about 0.8 inch across northern Indiana and 1.7 inch in central and southern regions. These amounts equate to about 90% of normal in the north, 210% of normal in central, and 230% of normal in southern Indiana. The heaviest single daily rainfall this week was reported on the morning of October 6 th by CoCoRaHS observers in east central and south central Indiana. On this day the Eaton volunteer measured 2.15 inches, while Fortville noted 2.10 inches. The rain gage at Bedford collected 1.84 inch, Cloverdale had 1.80 inch, while 1.77 inch fell in Bloomington. For the week total Eaton led the way with 3.21
3 inches. At Bedford the sum was 2.71 inches; Hazleton recorded 2.70 inches, Spencer 2.61 inches, and Bloomington 2.50 inches. An Indiana map of the week s precipitation totals follows below. The two month trend to improved soil moisture continued. By the end of this week none of Indiana was classified by the US Drought Monitor in the severe, extreme, or exceptional categories. The October 9 th edition rates 40% of Indiana in moderate drought status (D1 category), and 54% in the abnormally dry (D0) category. The remaining 6% is considered free of dryness, that is, having adequate soil moisture. In effect most of the moderate drought area from the prior week has been moved to abnormally dry status. The adequate areas are now located primarily in southwest and south central Indiana. Weekly maps of the Indiana Drought Monitor are found at the end of this monthly summary. The October 7 th edition of the USDA Indiana Weekly Weather and Crop bulletin states that some areas of Indiana were too wet to continue harvest this week. Corn harvest has advanced to 49% complete with 96% of all corn having matured and safe from frost. Soybean harvest is 30% finished with 94% of the crop now shedding leaves. Wheat planting is underway with 18% of the task completed and 2% of the new crop emerged. Pastures are rated 28% in good to excellent condition which has helped grazing of livestock. Newly cut hay has been slow to dry this week. The topsoil moisture survey rates 22% of the state as short or very short of moisture. Subsoils are at 52% in these same categories, a slow improvement from a week ago. Crawford county lifted its mandatory burn ban on October 5 th. Burn bans only remain in Martin and Clark counties. October 8 th 14 th Unlike the temperature roller coaster of last week, a warming trend was underway in Indiana this second week of October. But first a strong surface high pressure ridge settled over the eastern part of the country. Clear skies and no wind allowed Indiana temperatures to plummet to or well below freezing the early morning of October 8 th. Except for far southern counties, most of Indiana now experienced their first autumn freeze this season, for many the earliest since Several counties saw temperatures dip below 28 F, killing crops and vegetation, and so marking the end of the 2012
4 growing season. At Wanatah in northwest Indiana the overnight temperature plunged to 21 F. State average temperatures this day chilled to about 11 F below normal. A fast jet stream in the upper atmosphere now moved closer to our state causing storm systems to speed up across the Midwest. Warmer air in advance of a Minnesota storm system nudged Indiana temperatures to 9 F below normal the next day. The cold front part of this storm followed quickly on October 10 th but temperatures had little time to react. Rather temperatures rose to 6 F below normal as high pressure behind this front passed overhead then raced east of Indiana the next day. On October 12 th a second cold front moved through the state but again state average temperatures held steady. High pressure the next day hurried over Indiana eastbound to the Atlantic coast. This time state temperatures bounced from 6 F below normal to 2 F above normal. The week closed as a warm front traveled through Indiana, opening the way to warm air that peaked at 5 F above normal, resulting in the warmest day of the week. The warmth was carried into the state by gusty 50 mph to 60 mph winds, especially in northern Indiana. Overall this week state temperatures averaged 6 F below normal. Typically for this time of year daily maximum temperatures should range between 64 F and 72 F north to south across Indiana. Daily minimums should vary from about 44 F in far northern Indiana to 47 F in the extreme south. The rapid pace of fronts across the state this week allowed for only one dry day. Yet amounts were very light statewide the first half of the week when cooler temperatures prevailed. Only when temperatures climbed to above normal levels near the end of the week were rainfall amounts significant. For the week total rainfall was about 0.7 inch in northern Indiana, near 0.2 inch in central, and under 0.1 inch in the south. These amounts equate to 130% of normal in northern, just 30% of normal in central, and less than 10% of normal rainfall in southern counties. Obviously the heaviest daily rainfall this week was in northern Indiana. CoCoRaHS volunteers in two Demotte locations measured 1.42 and 1.34 inches on the morning of October 14 th. Two North Judson observers had 1.41 inch and 1.35 inch that morning. Total rainfall for the week was only slightly higher at these sites. The Demotte gages had 1.51 inch and 1.47 inch for the week. One of the North Judson reporters had 1.51 inch while 1.48 inch fell for the week at New Carlisle. The weekly rainfall map following this report shows well the concentration of rain in northern Indiana while the southern half of the state had little. The drought continues to improve week by week in Indiana. The October 9 th edition of the US Drought Monitor states that only 25% of Indiana remains in moderate drought status (D1 category). There is no drought or dryness in 7% of the state (None category). The remaining two thirds of Indiana are rated as abnormally dry but not in drought (D0 category). As the October 16 th edition of the Indiana drought map visualizes at the end of this monthly summary, drought conditions yet persist in northeast Indiana and in small parts of west central and extreme southwest Indiana. According to the soil moisture survey printed in the October 14 th edition of the Indiana Weekly Weather and Crop report, 22% of topsoil is still rated as short or very short of moisture. Subsoil moisture is surveyed at 53% in these same categories. The report also states the Indiana harvest proceeded well except in northern areas interrupted by rain later in the week. High winds on October 14 th caused some lodging of corn in northern counties. Corn harvest stands at 61% complete with 11% of corn remaining in fields in good to excellent condition. For soybeans harvest is 51% finished with 34% of remaining soybeans in the field in good to excellent condition. Wheat planting is now moving along at 47% complete now that soil moisture is returning. Pastures are in
5 26% good to excellent condition. Livestock continue in good condition now that some pastures are available for grazing after drought recovery. There was no change in county burn ban status this week. Martin and Clark counties continue as the only counties in Indiana where a mandatory burn ban remains in force. October 15 th 21 st Weather changes slowed this week with the passage of just one warm and cold front through Indiana. Average state temperatures wandered little, staying within 3 F of normal on all 7 days. The rainy October continued with just two dry days this week. A storm was departing Indiana as the week began, pulling in cool air which dropped temperatures a bit to 3 F below normal. A three day warm up followed as high pressure slid east across Indiana the next day. On October 17 th a warm front passed through. Southerly winds behind this front tapped into warmer air, allowing temperatures to peak at near 3 F above normal. The center of this storm held back over Wisconsin, intensifying greatly in the upper atmosphere. A long sweeping cold front wrapped around this center and outpaced the storm through Indiana. Temperatures slipped only a few degrees to 1 F below normal by October 19 th. The storm center to the west now collapsed and transferred most of its energy to another storm center over Maryland. The lapse of the western storm allowed Indiana weather to settle towards the weekend. A new high pressure ridge moved to the state. Indiana temperatures bounced a few degrees to close out at near 3 F above normal. Overall for the week state temperatures averaged at right about normal. Typically for this week in October daily maximum temperatures should range from about 61 F in far northern Indiana to 69 F in the extreme southwest. Daily minimums normally vary between 42 F and 45 F north to south. Light rain fell often this week, typically producing about a quarter inch per day. The warm and cold front events combined to generate about a half to one inch in most locations. The heaviest amounts were reported by CoCoRaHS observers on the morning of October 18 th. On that day the Eaton volunteer measured 1.79 inch. In Poseyville 1.28 inch fell while the Kingsbury gage collected 1.21 inch. In Huntertown 1.18 inch was observed. Regionally for the entire week about 1.4 inch was

6 noted in northern Indiana, 1.3 inch in central areas, and 1.0 inch across the south. These totals represent nearly twice the weekly normal in northern and central Indiana while the southern region averaged right about normal. There were locally heavier weekly totals in north central Indiana. The CoCoRaHS reporter in Granger had 2.58 inches for the week while South Bend measured 2.56 inches. At New Carlisle 2.53 inches was noted. Two volunteers in Mishawaka had 2.37 and 2.32 inches for the week. The Indiana drought seems to be approaching its end. The October 23 rd edition of the US Drought Monitor places just 7% of Indiana in moderate drought status (D1 category), nearly all of that in parts of 6 counties in the northeast corner of the state. Two-thirds of the state is now rated as abnormally dry (D0 category) but not in drought. The remaining one quarter of the state is considered to have adequate soil moisture. Much of the improvement this week came with the movement of areas from moderate drought status to having adequate soil moisture. The adequate regions form two west to east bands across central and southern Indiana. Weekly maps of Indiana drought status are found at the end of this monthly summary. Another rendition of the drought status is given in the Indiana Weekly Weather and Crop bulletin. The soil moisture survey in the October 21 st edition of this report rates only 13% of Indiana topsoils as short or very short of moisture. Subsoils are rated at 47% in these same categories. The bulletin also notes that corn harvest is running 14 days ahead of schedule. About 72% of the Indiana corn crop is harvested with some delays due to the cool and rainy week. The soybean harvest is about 3 days ahead of schedule with 69% of that crop harvested. Winter wheat planting is well underway at 71% complete with 25% of that crop emerged. Pastures have improved greatly at 32% in good to excellent condition, helping to stretch the tight winter hay supply. Livestock continue in good condition as a result of the improved pastures. Clark county ended its mandatory burn ban on October 17 th. In Indiana only Martin county remains with an open burn ban due to the impacts of this summer s drought.
7 October 22 nd 31 st The final ten days of October featured two significant storm events. The first was a strong cold front from the Great Plains that arrived in Indiana on October 26 th, which is not unusual. The second event was the landfall of Hurricane Sandy in New Jersey. From ground level upwards through the troposphere, the remnants of Sandy merged with the same cold front and pressure system that had passed through Indiana days earlier. The miles tall and up to 1000 mile wide enhanced storm would be tagged as Superstorm Sandy. The monster storm drifted westward and influenced Indiana weather on October 30 th. It is interesting that a cold front that had passed through and well east of Indiana would morph into another storm, then return to impact Indiana again 4 days later! The ten days had started calmly enough with a warming trend underway with a high pressure system located just east of Indiana. Over the next 3 days a wedge of warmth formed over the state ahead of a slow moving low pressure system in the Iowa region. The warming continued, peaking at 16 F above normal in Indiana on October 24 th. Winds became strong the next day ahead of the cold front attached to the same system. On October 26 th the cold front surged eastward through Indiana, opening the gate to much colder Canadian air. Temperatures dropped by 20 F the next day, settling at 5 F below normal. Cool air would now pour into Indiana to the end of the month as thermometers lost a few more degrees each day. By October 28 th the state average temperature had fallen to 8 F below normal. Now the long reach of Superstorm Sandy entered the Indiana weather picture. Wind speeds increased statewide on October 29 th with gusts up to 70 mph near Lake Michigan the next day. Rain and snow showers from Sandy spread to the eastern half of Indiana. Cold north winds across Lake Michigan suppressed Indiana daily temperatures, falling to 11 F below normal. Sandy was now on a northward track towards Lake Erie, weakening along the way. Sandy s grip on Indiana loosened on October 31 st as winds began to die down. State temperatures fell to their lowest point of the week at 12 F below normal as the month of October and Superstorm Sandy faded away from Indiana. Overall for the ten day interval state temperatures averaged right at normal, masking the wild swing from 16 F above normal early in the interval to 12 F below normal at the end. Typically for this time period in October daily maximum temperatures should vary from about 58 F in far northern Indiana to 66 F in the southwest corner of the state. Daily minimums normally range between 40 F and 43 F north to south across the state. Precipitation was frequent, occurring on about 7 of these last 10 days somewhere in our state. Common daily amounts were about a quarter to third of an inch. Locally heavier amounts came early in the interval during the warm spell. On October 23 rd the CoCoRaHS volunteer at Fowler measured 1.80 inch while in Kentland 1.52 inch fell. The next day the Atlanta gage recorded 2.21 inches while 1.48 inch was collected in Eaton and 1.46 inch in Rensselaer. Total precipitation for the 10 days ranged from about 1.1 inch in northern Indiana to 1.2 inch in central sections and 0.7 inch in southern Indiana. These totals equate to about 140% of normal in the north, 170% in central, and right about normal in southern counties. The highest CoCoRaHS totals over the 10 days included 2.96 inches in Atlanta, 2.40 inches at Flora, 2.35 inches in Rensselaer, 2.30 inches at Kentland, and 2.13 inches in Tipton.
8 A touch of snow fell in extreme eastern Indiana as cold northerly winds brought on by Sandy picked up lake effect moisture. But snowfall amounts were tiny, just 0.1 inch measured at a very few locations. Indiana wind gusts on October 30 th during Superstorm Sandy ranged between 40 mph and 70 mph. In Porter county the roof was blown off a vehicle storage building and a wall collapsed at the Indiana Dunes park. Fallen trees blocked a few roads across the county as well. The effect of these northerly gusts on Lake Michigan were dramatic. On October 30 th wave heights were measured near 11 feet at the north end of the lake. But at the southern end of the lake wave heights reached almost 22 feet, the second highest wave heights on record since Northerly winds from Superstorm Sandy pushed and piled water from the north end to the south end of the lake to create the massive difference. The observations also indicate waves were at least 18 feet or higher during 10 consecutive hours, a new record for duration. However the record acknowledges no wave records are kept during winter seasons. Indiana soil water continues to recharge as the drought fades away. The US Drought Monitor of October 30 th indicates a shift of about 30% of Indiana area from abnormally dry (D0 category) to normal status. The map now shows nearly 60% of Indiana in normal soil moisture status, 35% as abnormally dry, and only 7% in moderate drought (D1 category). Only about four counties in extreme northeast Indiana and the southern tips of two extreme southwest counties make up this moderate drought area. The abnormally dry regions form three west to east bands across the state. A drought map showing where these bands are located is found near the end of this monthly report. An independent view of the current soil moisture status is found in the October 28 th edition of the Indiana Weekly Weather and Crop report. The soil moisture survey shows only about 10% of Indiana topsoil is still rated as short or very short of moisture. About 38% of subsoil remains in these same categories. The report notes that harvest has slowed this past week due to rain and muddy fields with some local harvesting stopped by the wet conditions. Yet the corn harvest remains 12 days ahead of last year s pace and soybeans are still 2 days ahead. Harvest of both crops is estimated to be 81% complete. Winter wheat seeding is nearing its end and two-thirds of the new crop has emerged. Pastures are rated at 38% in good to excellent condition. Regrowth is a pleasant surprise to livestock managers after the crippling summer drought. Livestock continue in good condition with the availability of the new pasture grasses. There were no changes in county burn ban status in the past 10 days.
9
10 October 2012 Temperature Region Temperature Normal Deviation Northwest North Central Northeast West Central Central East Central Southwest South Central Southeast State Precipitation Region Precipitation Normal Deviation Percent of Normal Northwest North Central Northeast West Central Central East Central Southwest South Central Southeast State
11 Autumn so far (September - October) Temperature Region Temperature Normal Deviation Northwest North Central Northeast West Central Central East Central Southwest South Central Southeast State Precipitation Region Precipitation Normal Deviation Percent of Normal Northwest North Central Northeast West Central Central East Central Southwest South Central Southeast State
12 2012 Annual (through October) Temperature Region Temperature Normal Deviation Northwest North Central Northeast West Central Central East Central Southwest South Central Southeast State Precipitation Region Precipitation Normal Deviation Percent of Normal Northwest North Central Northeast West Central Central East Central Southwest South Central Southeast State
13
14
15

16 Drought Summary from the U.S. Drought Monitor Below is a drought summary for the state of Indiana from the U.S. drought monitor. Areas in white are not experiencing any drought. Yellow areas are abnormally dry, but not considered a drought. Drought begins when the moisture levels become more severe, with beige, orange, red, and brown indicating increasing levels of drought (moderate, severe, extreme, and exceptional, respectively). The table below indicates how much of the state is not under drought conditions, and also how much of the state is under drought conditions from its respective column upwards. For example, October 2 nd has 14.7% of Indiana under at least D2- D4 drought status, 77.2% under at least D1-D4 status, and 100.0% under D0-D4. Subtracting the D2-D4 category (14.7%) from the D1-D4 category (77.2%), tells us that 62.5% of Indiana is in the D1 category alone (moderate drought). Please note, however, that these areas are not exact, and much of this drought map has been created from reports throughout the state and in estimation, so use this information as a general view rather than for specifics.
17 October 2 nd Drought Summary
18 October 9 th Drought Summary
19 October 16 th Drought Summary

20 October 23 rd Drought Summary
21 October 30 th Drought Summary
November 2012 Climate Summary
 Ken Scheeringa and Kayla Hudson Dec 6, 2012 (765) 494-8105 http://www.iclimate.org November 2012 Climate Summary Month Summary November was one of those rare weather months in Indiana when not much happened:
October 2011 Climate Summary
 Ken Scheeringa and Kayla Hudson Nov 4, 2011 http://www.iclimate.org October 2011 Climate Summary Month Summary October weather evolved as a two part story. Weather conditions the first half of the month
August 2013 Climate Summary
 Ken Scheeringa and Matt Price Sep 6, 2013 (765) 494-8105 http://www.iclimate.org August 2013 Climate Summary Month Summary August weather began cool and wet but became progressively warmer and drier through
December 2011 Climate Summary
 Ken Scheeringa and Kayla Hudson Jan 17, 2012 (765) 494-8105 http://www.iclimate.org December 2011 Climate Summary Month Summary What a difference a year makes! A year ago the misery of a harsh, cold, and
January 2008 Climate Summary
 Joseph Mays (765) 494-6574 Feb 5, 2008 http://www.iclimate.org Summary January 2008 Climate Summary January was a mix bag of conditions, with an oscillatory pattern developing. We experienced phases of
July 2007 Climate Summary
 Dan Bowman (765) 494-6574 Sep 3, 2007 http://www.iclimate.org Summary July 2007 Climate Summary The month of July ended as a very unusual month. Many events occurred during the month of July that is not
January 2006 Climate Summary
 Ashley Brooks (765) 494-6574 Feb 9, 2006 http://www.iclimate.org January 1-3 January 2006 Climate Summary Unseasonably warm conditions welcomed in the New Year with highs in the 40s across the northern
October 2014 Climate Summary
 Ken Scheeringa And Matt Price Nov 10, 2014 (765) 494-8105 http://www.iclimate.org October 2014 Climate Summary Month Summary October featured a mix of weather. A very wet first half of the month evolved
September 2012 Climate Summary
 Ken Scheeringa and Kayla Hudson Oct 5, 2012 (765) 494-8105 http://www.iclimate.org September 2012 Climate Summary Month Summary Summer slipped away and it felt a lot more like autumn in Indiana this month
September 2011 Climate Summary
 Ken Scheeringa and Kayla Hudson Oct 5, 2011 (765) 494-8105 http://www.iclimate.org September 2011 Climate Summary Month Summary The final blast of summer heat arrived at the start of September. It lasted
2011 Year in Review TORNADOES
 2011 Year in Review The year 2011 had weather events that will be remembered for a long time. Two significant tornado outbreaks in April, widespread damage and power outages from Hurricane Irene in August
August 2017 Climate Summary
 Ken Scheeringa And Andy Eggert Sep 7, 2017 (765) 494-8105 http://www.iclimate.org August 2017 Climate Summary Month Summary The coolest August in 13 years featured long cool and warm spells, below normal
November 2015 Climate Summary
 Ken Scheeringa And Mary Rose Mangan Dec 8, 2015 (765) 494-8105 http://www.iclimate.org November 2015 Climate Summary Month Summary November was much warmer than normal while precipitation was very near
September 2016 Climate Summary
 Ken Scheeringa And Andy Eggert Oct 6, 2016 (765) 494-8105 http://www.iclimate.org September 2016 Climate Summary Month Summary The warmest September in 77 years brought alternating weeks of dry and wet
The hydrologic service area (HSA) for this office covers Central Kentucky and South Central Indiana.
 for this office covers Central Kentucky and South Central Indiana.") January 2012 February 13, 2012 An X inside this box indicates that no flooding occurred within this hydrologic service area. January 2012 continued the string of wet months this winter. Rainfall was generally
January 2012 February 13, 2012 An X inside this box indicates that no flooding occurred within this hydrologic service area. January 2012 continued the string of wet months this winter. Rainfall was generally
Champaign-Urbana 2001 Annual Weather Summary
 Champaign-Urbana 2001 Annual Weather Summary ILLINOIS STATE WATER SURVEY 2204 Griffith Dr. Champaign, IL 61820 wxobsrvr@sws.uiuc.edu Maria Peters, Weather Observer January: After a cold and snowy December,
August 2006 Summary. August 1-5
 Ashley Brooks (765) 494-6574 Sep 8, 2006 http://www.iclimate.org August 1-5 August 2006 Summary The heat wave that started during the end of July continued into the beginning parts of August with temperatures
2012 Growing Season Weather Summary for North Dakota. Adnan Akyüz and Barbara A. Mullins Department of Soil Science October 30, 2012
 2012 Growing Season Weather Summary for North Dakota Adnan Akyüz and Barbara A. Mullins Department of Soil Science October 30, 2012 Introduction The 2012 growing season (the period from April through September)
March 2014 Climate Summary
 Ken Scheeringa And Matt Price Apr 8, 2014 (765) 494-8105 http://www.iclimate.org March 2014 Climate Summary Month Summary Winter had officially ended by the calendar but snow and cold persisted in Indiana
November 2014 Climate Summary
 Ken Scheeringa And Matt Price Dec 10, 2014 (765) 494-8105 http://www.iclimate.org November 2014 Climate Summary Month Summary Unseasonable cold headlined the Indiana and national news in November. The
UNITED STATES AND SOUTH AMERICA OUTLOOK (FULL REPORT) Thursday, December 28, 2017
 Thursday, December 28, 2017") T-storm Weather Summary Despite scattered t-storms Sat.-Sun. in central and northern areas in Argentina, more will likely be needed especially in sunflower areas of the southwest. Some t-storms likely
T-storm Weather Summary Despite scattered t-storms Sat.-Sun. in central and northern areas in Argentina, more will likely be needed especially in sunflower areas of the southwest. Some t-storms likely
UNITED STATES AND SOUTH AMERICA WEATHER ROUNDUP Sunday, December 17, 2017
 T-storm Weather Summary Extreme heat was followed by heavy rain in some key areas of Argentina yesterday. T-storms affect much of the driest Argentina, southern Brazil, and Paraguay through 7 to 10 days,
UNITED STATES AND SOUTH AMERICA OUTLOOK (FULL REPORT) Wednesday, April 18, 2018
 Wednesday, April 18, 2018") T-storm Weather Summary Coolness continues over the next week in much of the central U.S., most likely producing the coldest April since 1907 in the Corn Belt, but followed by seasonable to mild weather
T-storm Weather Summary Coolness continues over the next week in much of the central U.S., most likely producing the coldest April since 1907 in the Corn Belt, but followed by seasonable to mild weather
The Pennsylvania Observer
 The Pennsylvania Observer January 5, 2016 December 2015 - Pennsylvania Weather Recap By: Arthur Person December is the first of the three coldest months of the year. Sometimes it can be naughty, and sometimes
November 2010 Climate Summary
 Ken Scheeringa (765) 494-8105 Dec 6, 2010 http://www.iclimate.org November 2010 Climate Summary Summary A four month drought in Indiana is collapsing as significant rain fell the final week of November.
September 2005 Climate Summary
 Ashley Brooks (765) 494-6574 Oct 5, 2005 http://iclimate.org September 2005 Climate Summary September 1-7 A cold front came through on the 1 st of the month, however little moisture was associated with
2012 Growing Season. Niagara Report. Wayne Heinen
 2012 Growing Season Niagara Report Wayne Heinen Overview The 2012 growing season was a phenomenal one for grapes. Vines entered bud break in good shape following a mild winter. The spring of 2012 was similar
Monthly Long Range Weather Commentary Issued: SEPTEMBER 19, 2016 Steven A. Root, CCM, Chief Analytics Officer, Sr. VP,
 Monthly Long Range Weather Commentary Issued: SEPTEMBER 19, 2016 Steven A. Root, CCM, Chief Analytics Officer, Sr. VP, sroot@weatherbank.com SEPTEMBER 2016 Climate Highlights The Month in Review The contiguous
Weather and Climate Summary and Forecast Summer 2017
 Weather and Climate Summary and Forecast Summer 2017 Gregory V. Jones Southern Oregon University August 4, 2017 July largely held true to forecast, although it ended with the start of one of the most extreme
August 2015 Climate Summary
 Ken Scheeringa And Mary Rose Mangan Sep 4, 2015 (765) 494-8105 http://www.iclimate.org August 2015 Climate Summary Month Summary A very active wet summer weather pattern turned much calmer and drier in
CropCast Corn and Soybean Report Kyle Tapley Monday, March 20, 2017
 Accumulated Rainfall (inches) Accumulated GDDs Temperature ( F)/Wind Speed (mph) Precipitation (inches) CropCast Corn and Soybean Report Kyle Tapley Monday, March 20, 2017 Peoria, IL Regional Forecast
The Pennsylvania Observer
 The Pennsylvania Observer April 2, 2009 March 2009 Pennsylvania Weather Recap Prepared by Curt Harpster For the month of March the saying, In like a lion and out like a lamb really fit the pattern quite
Champaign-Urbana 1999 Annual Weather Summary
 Champaign-Urbana 1999 Annual Weather Summary ILLINOIS STATE WATER SURVEY 2204 Griffith Dr. Champaign, IL 61820 wxobsrvr@sws.uiuc.edu Maria Peters, Weather Observer A major snowstorm kicked off the new
Monthly Long Range Weather Commentary Issued: July 18, 2014 Steven A. Root, CCM, President/CEO
 Monthly Long Range Weather Commentary Issued: July 18, 2014 Steven A. Root, CCM, President/CEO sroot@weatherbank.com JUNE 2014 REVIEW Climate Highlights The Month in Review The average temperature for
Weather and Climate Summary and Forecast October 2017 Report
 Weather and Climate Summary and Forecast October 2017 Report Gregory V. Jones Linfield College October 4, 2017 Summary: Typical variability in September temperatures with the onset of fall conditions evident
Monthly Long Range Weather Commentary Issued: APRIL 18, 2017 Steven A. Root, CCM, Chief Analytics Officer, Sr. VP,
 Monthly Long Range Weather Commentary Issued: APRIL 18, 2017 Steven A. Root, CCM, Chief Analytics Officer, Sr. VP, sroot@weatherbank.com MARCH 2017 Climate Highlights The Month in Review The average contiguous
Champaign-Urbana 1998 Annual Weather Summary
 Champaign-Urbana 1998 Annual Weather Summary ILLINOIS STATE WATER SURVEY Audrey Bryan, Weather Observer 2204 Griffith Dr. Champaign, IL 61820 wxobsrvr@sparc.sws.uiuc.edu The development of the El Nìno
October 2017 Climate Summary
 Ken Scheeringa and Andy Eggert Nov 6, 2017 (765) 494-8105 http://www.iclimate.org October 2017 Climate Summary Month Summary After more than three weeks of warm temperatures October turned suddenly cold
May 2016 Climate Summary
 Ken Scheeringa And Andy Eggert Jun 6, 2016 (765) 494-8105 http://www.iclimate.org May 2016 Climate Summary Month Summary Cold weather dominated in May until the last week of the month. May began wet but
Weather and Climate Summary and Forecast August 2018 Report
 Weather and Climate Summary and Forecast August 2018 Report Gregory V. Jones Linfield College August 5, 2018 Summary: July 2018 will likely go down as one of the top five warmest July s on record for many
January 25, Summary
 January 25, 2013 Summary Precipitation since the December 17, 2012, Drought Update has been slightly below average in parts of central and northern Illinois and above average in southern Illinois. Soil
Foundations of Earth Science, 6e Lutgens, Tarbuck, & Tasa
 Foundations of Earth Science, 6e Lutgens, Tarbuck, & Tasa Weather Patterns and Severe Weather Foundations, 6e - Chapter 14 Stan Hatfield Southwestern Illinois College Air masses Characteristics Large body
Weather and Climate Risks and Effects on Agriculture
 Weather and Climate Risks and Effects on Agriculture Dr. Eric Snodgrass Official Journal of the Fluid Fertilizer Foundation Vol. 26, No. 2, Issue #100 DOWNLOAD Summary: So, what do we need to watch for?
Illinois Drought Update, December 1, 2005 DROUGHT RESPONSE TASK FORCE Illinois State Water Survey, Department of Natural Resources
 Illinois Drought Update, December 1, 2005 DROUGHT RESPONSE TASK FORCE Illinois State Water Survey, Department of Natural Resources For more drought information please go to http://www.sws.uiuc.edu/. SUMMARY.
CropCast Corn and Soybean Report Kenny Miller Tuesday, March 14, 2017
 Accumulated Rainfall (inches) Accumulated GDDs Temperature ( F)/Wind Speed (mph) Precipitation (inches) CropCast Corn and Soybean Report Kenny Miller Tuesday, March 14, 2017 Peoria, IL Regional Forecast
October 2016 Climate Summary
 Ken Scheeringa And Andy Eggert Nov 9, 2016 (765) 494-8105 http://www.iclimate.org October 2016 Climate Summary Month Summary October was the 9 th month so far this year to average above normal in temperature.
UNITED STATES AND SOUTH AMERICA SNAPSHOT REPORT Thursday, December 21, 2017
 T-storm Weather Summary A small but key corn and soybean area in western Argentina was wetter than expected overnight. T-storms affect varying areas of South America at varying times into January, but
The Pennsylvania Observer
 The Pennsylvania Observer August 3, 2015 July 2015 - Pennsylvania Weather Recap By: Arthur Person Although this seventh month of 2015 was fairly normal across Pennsylvania as a whole, the details reveal
What a Hurricane Needs to Develop
 Weather Weather is the current atmospheric conditions, such as air temperature, wind speed, wind direction, cloud cover, precipitation, relative humidity, air pressure, etc. 8.10B: global patterns of atmospheric
CropCast Corn and Soybean Report Kenny Miller Monday, March 13, 2017
 Accumulated Rainfall (inches) Accumulated GDDs Temperature ( F)/Wind Speed (mph) Precipitation (inches) CropCast Corn and Soybean Report Kenny Miller Monday, March 13, 2017 Peoria, IL Regional Forecast
The Pennsylvania Observer
 The Pennsylvania Observer October 1, 2015 September 2015 - Pennsylvania Weather Recap By: Quinn Lease The month of September will be remembered for its above normal temperatures and dry conditions that
NWS FORM E-5 U.S. DEPARTMENT OF COMMERCE I HYDRO SERVICE AREA NOAA, NATIONAL WEATHER SERVICE I Indianapolis, IN MONTHLY REPORT
 NWS FORM E-5 U.S. DEPARTMENT OF COMMERCE I HYDRO SERVICE AREA NOAA, NATIONAL WEATHER SERVICE I Indianapolis, IN. 1-------------------- MONTHLY REPORT OF RIVER AND FLOOD CONDITIONSI REPORT FOR I November
Ch. 3: Weather Patterns
 Ch. 3: Weather Patterns Sect. 1: Air Mass & Fronts Sect. 2: Storms Sect. 3: Predicting the Weather Sect. 4: Weather forecasters use advanced technologies Ch. 3 Weather Fronts and Storms Objective(s) 7.E.1.3
CropCast Corn and Soybean Report Kenny Miller Friday, March 17, 2017
 Accumulated Rainfall (inches) Accumulated GDDs Temperature ( F)/Wind Speed (mph) Precipitation (inches) CropCast Corn and Soybean Report Kenny Miller Friday, March 17, 2017 Peoria, IL Regional Forecast
The Pennsylvania Observer
 The Pennsylvania Observer January 5, 2009 December 2008 Pennsylvania Weather Recap The final month of 2008 was much wetter than average and a bit colder than normal. In spite of this combination, most
Crop / Weather Update
 Crop / Weather Update Corn Crop Condition Percent of Acreage Rated Good or Excellent 85 80 75 70 65 60 55 50 45 Corn condition this week is the same as the last two weeks in the good/excellent category,
March 2016 Climate Summary
 Ken Scheeringa And Andy Eggert Apr 8, 2016 (765) 494-8105 http://www.iclimate.org March 2016 Climate Summary Month Summary Count March as the 7 th month in a row that the state average temperature has
Weather and Climate Summary and Forecast March 2019 Report
 Weather and Climate Summary and Forecast March 2019 Report Gregory V. Jones Linfield College March 2, 2019 Summary: Dramatic flip from a mild winter to a top five coldest February on record in many locations
May 2005 Climate Summary
 Ashley Brooks (765) 494-6574 Jun 7, 2005 http://iclimate.org May 2005 Climate Summary May 1-5 Early May was characterized by an upper-level trough that was in place over Indiana that brought in very cool
National Wildland Significant Fire Potential Outlook
 National Wildland Significant Fire Potential Outlook National Interagency Fire Center Predictive Services Issued: September, 2007 Wildland Fire Outlook September through December 2007 Significant fire
2018 Year in Review for Central and Southeast Illinois By: Chris Geelhart, Meteorologist National Weather Service, Lincoln IL
 By: Chris Geelhart, Meteorologist National Weather Service, Lincoln IL While 2018 featured some significant out-of-season weather, including below zero temperatures in April and 90-degree highs in early
UNITED STATES AND SOUTH AMERICA SNAPSHOT REPORT Wednesday, December 20, 2017
 T-storm Weather Summary T-storms affect all growing areas of South America at one time or another over the next two weeks, but abovenormal rainfall is only likely for corn and soybeans in southern Brazil
The Pennsylvania Observer
 The Pennsylvania Observer The Pennsylvania Observer September 16, 2004 Recap of Pennsylvania's weather from August 6 - September 12, 2004. http://pasc.met.psu.edu/pa_climatologist/nl/archive/20040916/sec1.php
Weather and Climate Summary and Forecast April 2018 Report
 Weather and Climate Summary and Forecast April 2018 Report Gregory V. Jones Linfield College April 4, 2018 Summary: A near Miracle March played out bringing cooler and wetter conditions to the majority
Weather and Climate 1. Elements of the weather
 Weather and Climate 1 affect = to have an effect on, influence, change altitude = the height of a place above the sea axis = the line around which an object rotates certain = special consist of = to be
L.O Students will learn about factors that influences the environment
 Name L.O Students will learn about factors that influences the environment Date 1. At the present time, glaciers occur mostly in areas of A) high latitude or high altitude B) low latitude or low altitude
January 2012 Climate Summary
 Ken Scheeringa and Kayla Hudson Feb 6, 2012 (765) 494-8105 http://www.iclimate.org January 2012 Climate Summary Month Summary Where is winter? This question found its way into many conversations throughout
Arizona Climate Summary May 2012
 Arizona Climate Summary May 2012 Summary of conditions for April 2012 April 2012 Temperature and Precipitation Summary April 1 st 16 th : Although April began with another low pressure system sweeping
The Pennsylvania Observer
 The Pennsylvania Observer May 31, 2012 May 2012 - Pennsylvania Weather Recap By: Paul Knight The majority of the fifth month had temperatures averaging well above seasonal levels with two distinct hot
The Weather Wire. Contents: Summer 2018 Outlook. Summer 2018 Outlook Drought Monitor May Summary/Statistics June Preview Rainfall Totals
 The Weather Wire June 2018 Volume 25 Number 6 Contents: Summer 2018 Outlook Drought Monitor May Summary/Statistics June Preview Rainfall Totals Summer 2018 Outlook June 1 st marked the first day of meteorological
January 2013 Climate Summary
 Ken Scheeringa and Kayla Hudson Feb 7, 2013 (765) 494-8105 http://www.iclimate.org January 2013 Climate Summary Month Summary Winter or spring? January featured several dramatic swings in temperature and
JEFF JOHNSON S Winter Weather Outlook
 JEFF JOHNSON S 2017-2018 Winter Weather Outlook TABLE OF CONTENTS ABOUT THE AUTHOR Components of the seasonal outlook... 2 ENSO state/ocean temperatures... 3 Sub-seasonal outlooks... 4 Forecast models...
Ch. 3: Weather Patterns. Sect. 1: Air Mass & Fronts Sect. 2: Storms Sect. 3: Predicting the Weather
 Ch. 3: Weather Patterns Sect. 1: Air Mass & Fronts Sect. 2: Storms Sect. 3: Predicting the Weather Sect. 1: Air Masses & Fronts An air mass is a huge body of air that has similar temperature, humidity,
May 2018 Climate Summary
 Ken Scheeringa and Andy Eggert Jun 7, 2018 (765) 494-8105 http://www.iclimate.org May 2018 Climate Summary Month Summary As the calendar turned from April to May temperatures flipped dramatically away
National Drought Summary August 14, 2018
 National Drought Summary August 14, 2018 The discussion in the Looking Ahead section is a description of what the official national guidance from the National Weather Service (NWS) National Centers for
KANSAS CLIMATE SUMMARY January 2018
 KANSAS CLIMATE SUMMARY January 2018 Some welcome moisture After an extended period with little to no moisture, parts of Kansas recorded some significant precipitation. At Tribune, a small snow event on
Weather and Climate Summary and Forecast March 2018 Report
 Weather and Climate Summary and Forecast March 2018 Report Gregory V. Jones Linfield College March 7, 2018 Summary: The ridge pattern that brought drier and warmer conditions from December through most
Weather and Climate Summary and Forecast Winter
 Weather and Climate Summary and Forecast Winter 2016-17 Gregory V. Jones Southern Oregon University February 7, 2017 What a difference from last year at this time. Temperatures in January and February
Winter. Here s what a weak La Nina usually brings to the nation with tempseraures:
 2017-2018 Winter Time again for my annual Winter Weather Outlook. Here's just a small part of the items I considered this year and how I think they will play out with our winter of 2017-2018. El Nino /
Climate. Annual Temperature (Last 30 Years) January Temperature. July Temperature. Average Precipitation (Last 30 Years)
 January Temperature. July Temperature. Average Precipitation (Last 30 Years)") Climate Annual Temperature (Last 30 Years) Average Annual High Temp. (F)70, (C)21 Average Annual Low Temp. (F)43, (C)6 January Temperature Average January High Temp. (F)48, (C)9 Average January Low Temp.
Climate Annual Temperature (Last 30 Years) Average Annual High Temp. (F)70, (C)21 Average Annual Low Temp. (F)43, (C)6 January Temperature Average January High Temp. (F)48, (C)9 Average January Low Temp.
NWS FORM E-5 U.S. DEPARTMENT OF COMMERCE HSA OFFICE:
 NWS FORM E-5 U.S. DEPARTMENT OF COMMERCE HSA OFFICE: NOAA, NATIONAL WEATHER SERVICE MONTHLY REPORT OF RIVER AND FLOOD CONDITIONS DATE: TO: North Webster, IN REPORT FOR (MONTH &YEAR): July 1998 August 5,
Monthly Long Range Weather Commentary Issued: APRIL 1, 2015 Steven A. Root, CCM, President/CEO
 Monthly Long Range Weather Commentary Issued: APRIL 1, 2015 Steven A. Root, CCM, President/CEO sroot@weatherbank.com FEBRUARY 2015 Climate Highlights The Month in Review The February contiguous U.S. temperature
Weather and Climate Summary and Forecast December 2017 Report
 Weather and Climate Summary and Forecast December 2017 Report Gregory V. Jones Linfield College December 5, 2017 Summary: November was relatively cool and wet from central California throughout most of
January 2017 Climate Summary
 Ken Scheeringa And Andy Eggert Feb 8, 2017 (765) 494-8105 http://www.iclimate.org January 2017 Climate Summary Month Summary The warmest January in 11 years was nearly 4 F warmer than December 2016. An
Crop / Weather Update
 Crop / Weather Update This is our last for the 2018 planting, growing and harvesting seasons. USDA will publish their Crop Progress Report again in April 2019, and we will continue our coverage sometime
By: J Malherbe, R Kuschke
 2015-10-27 By: J Malherbe, R Kuschke Contents Summary...2 Overview of expected conditions over South Africa during the next few days...3 Significant weather events (27 October 2 November)...3 Conditions
Weather and Climate Summary and Forecast October 2018 Report
 Weather and Climate Summary and Forecast October 2018 Report Gregory V. Jones Linfield College October 4, 2018 Summary: Much of Washington, Oregon, coastal California and the Bay Area and delta region
The New Normal or Was It?
 The New Normal or Was It? by Chuck Coffey The recent drought has caused many to reflect upon the past and wonder what is in store for the future. Just a couple of years ago, few agricultural producers
October 2015 Volume 22 Number 10
 The Weather Wire October 2015 Volume 22 Number 10 Contents: Local Frost/Freeze Information Drought Monitor September Summary/Statistics October Preview Rainfall Totals Local Frost Freeze Information Many
The Pennsylvania Observer
 The Pennsylvania Observer April 2, 2010 March 2010 Pennsylvania Weather Recap Prepared by: Katelyn Johnson March did come in as a lion cub this year. The 1 st proved to be a calm day; however most of Pennsylvania
July 2010 Climate Summary
 Ken Scheeringa (765) 494-8105 Aug 4, 2010 http://www.iclimate.org July 2010 Climate Summary Summary The warm summer of 2010 continues. Daily state average temperatures were above normal on all but seven
SEPTEMBER 2013 REVIEW
 Monthly Long Range Weather Commentary Issued: October 21, 2013 Steven A. Root, CCM, President/CEO sroot@weatherbank.com SEPTEMBER 2013 REVIEW Climate Highlights The Month in Review The average temperature
Arizona Climate Summary
 May 2015 Temperature and Precipitation Summary Arizona Climate Summary June 2015 Summary of conditions for May 2015 May 1 st 14 th : May began with high pressure in the west, and May 1 st was dry statewide,
Arizona Climate Summary
 August 2015 Temperature and Precipitation Summary Arizona Climate Summary September 2015 Summary of conditions for August 2015 August 1 st 16 th : August was a wet month across the state with only 3 days
May 2015 Climate Summary
 Ken Scheeringa And Mary Rose Mangan Jun 8, 2015 (765) 494-8105 http://www.iclimate.org May 2015 Climate Summary Month Summary May was a very warm month. Rainfall averaged near normal but was distributed
but 2012 was dry Most farmers pulled in a crop
 After a winter that wasn t, conditions late in the year pointed to a return to normal snow and cold conditions Most farmers pulled in a crop but 2012 was dry b y M i k e Wr o b l e w s k i, w e a t h e
Weather and Climate Summary and Forecast November 2017 Report
 Weather and Climate Summary and Forecast November 2017 Report Gregory V. Jones Linfield College November 7, 2017 Summary: October was relatively cool and wet north, while warm and very dry south. Dry conditions
Weather and Climate Summary and Forecast January 2018 Report
 Weather and Climate Summary and Forecast January 2018 Report Gregory V. Jones Linfield College January 5, 2018 Summary: A persistent ridge of high pressure over the west in December produced strong inversions
4) At the end of this presentation we have an operator that will organize the Q & A s.
 At the end of this presentation we have an operator that will organize the Q & A s.") Hello and welcome to the next in a series of Missouri Basin specific climate outlook Webinars 2011-2012. My name is Dennis Todey and I am the State Climatologist for the State of South Dakota. We are taking
Hello and welcome to the next in a series of Missouri Basin specific climate outlook Webinars 2011-2012. My name is Dennis Todey and I am the State Climatologist for the State of South Dakota. We are taking
NATIONAL WEATHER SERVICE
 January 2016 February 9, 2016 This was a dry month across the HSA despite one large and several smaller snowfalls. Most locations ended up 1-2 inches below normal for the month. The driest locations at