November 2012 Climate Summary
|
|
|
- Melvin Armstrong
- 5 years ago
- Views:
Transcription

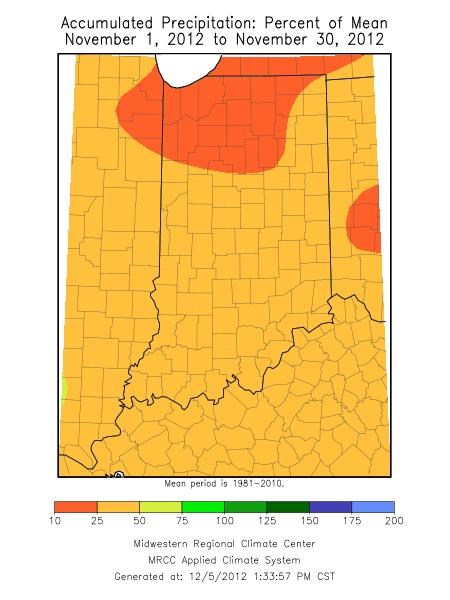
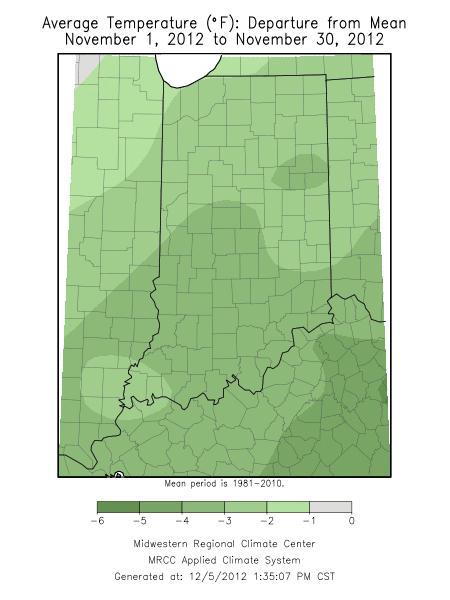
1 Ken Scheeringa and Kayla Hudson Dec 6, 2012 (765) November 2012 Climate Summary Month Summary November was one of those rare weather months in Indiana when not much happened: no tornadoes, no reports of hail or wind damage, no remnants of tropical storms, no significant snows, and well, not much rainfall either. It was a cold and very dry month. For the fourth consecutive month Indiana temperatures averaged below normal, but a three month wet cycle was broken. November was the first drier than normal month in the state since July. Snow fell on about three days this month, mostly along a Crawfordsville to Hartford City line. The drought of 2012 was nearly over in October but the lack of rainfall this month has allowed the drought to crawl back especially in far northern counties. Near the end of November about 16% of Indiana area was listed in moderate drought status, an uptick from the 10% coverage a month ago. The growing season has ended and this will ease the demand on the soil moisture supply over the coming winter months. This month was the 33 rd coldest November on record since The state average temperature was 40.2 F, below normal by 2.2 F. Only one other November since 2000 has been colder: the 40.0 F average temperature recorded in 2002 ties 1895 as the 31 st coldest November on record. There was a string of three cool Novembers in the mid 1990s: 36.4 F in 1995 tied for 5 th place, 35.9 F in 1996 in the 3 rd spot, and 38.7 F in 1997 which comes in at 22 nd coolest. The coldest November on record was the 34.4 F average in 1976 which marked the start of the infamous three bitter cold consecutive winters of the 1970s. The day split in November 2012 was 19 days of below normal temperature, 1 day at normal, and 10 days with above normal temperature. On one day the state average temperature was at least 10 F above normal. At the opposite extreme there were 5 days at least 10 F below normal. Evansville topped the state with the highest official temperature at 76 F on November 10 th. The coldest temperature was 14 F recorded on November 15 th at Lexington. The state precipitation total was just 1.02 inch, which is 28% of normal or a deficit of 2.57 inches below normal. The lack of precipitation this month ranks November 2012 as the 3 rd driest on record. Only November 1917 with 0.54 inch and November 1904 with 0.38 inch have been drier. In more recent times the 1.07 inch in November 1999 and 1.51 inch in November 2009 had slightly higher precipitation than November Regionally precipitation this month was about 20% of normal in northern Indiana and near 30% of normal in central and southern counties. The highest daily cooperative station precipitation total this month was 1.55 inch, measured near Hovey Lake on November 12 th. In the CoCoRaHS network the heaviest single day precipitation amount was 1.41
2 inch at Poseyville that same morning. Precipitation generally fell on a minimal 8 days in Indiana this month. Snow totals were light this month as the snow season is just getting started. The highest snowfall total for the month at a CoCoRaHS station was 1.4 inch at Hartford City. Snow fell on about 3 days this month. A snowfall totals map is found later in this monthly report Dense fog on November 21 st, the day before Thanksgiving, caused vehicle accidents in northwest Indiana where the visibility was least. November 1 st 10 th Weather in the new month began quietly following the exit of October and Superstorm Sandy. State average temperatures started cold at 11 F below normal, then recovered just a degree or two over the next few days. A dirty high pressure center southwest of Indiana brought clouds and sleet, not sunshine, on November 3 rd, as trapped moisture near ground level kept temperatures low. Temperatures hit bottom at 19 F below normal on November 4 th, the coldest day of the 10 day interval. Northwest winds spilled cold Canadian air into Indiana through the next day. A slow warming trend began on November 6th and took hold through the remaining days. Finally the cold air pipeline was shut down. A warm front swung toward Illinois, well southeast of its low pressure center the next day. Indiana temperatures responded by rising to 5 F below normal. But the warm front weakened and pulled stationary, finally dissolving on November 8 th as high pressure in Texas spread to Indiana. Yet warm winds behind this high pressure kept the warming trend going. Indiana temperatures finally found normal by November 9 th. A new storm system was approaching from the west, forming an unseasonably warm pocket of air over the state. Temperatures jumped to 9 F above normal to close out the 10 day interval. Normally in these first 10 days of November daily maximum temperatures would be expected to range from 53 F in far northern Indiana to 62 F in the extreme southwest. Typical daily minimums would vary between 37 F and 40 F north to south across the state. Persistent northwest winds from Canada carry little moisture since they originate over cold massive land areas. This was certainly reflected in the small precipitation amounts in Indiana during the 10 days. For the week regional precipitation averaged about 0.2 inch across the state. These totals are about 10% of normal in northern Indiana and less than 20% of normal in central and southern areas, quite a contrast to the wet weeks of October. Places with the greatest 10 day totals are barely worth mentioning, with all CoCoRaHS station sums under a half inch. There was almost no change in Indiana drought status from a week ago according to the November 6 th edition of the US Drought Monitor. Less than 10% of Indiana area, primarily 4 counties in the northeast corner of Indiana, is rated in moderate drought status (D1 category). Three east to west bands, one across the northern two tiers of counties, another mostly in central Indiana, and the last in far southwest Indiana, fall into the non-drought abnormally dry classification (D0 category). Just over half the remaining Indiana land area is labeled in normal autumn soil moisture condition. Weekly drought maps can be found near the end of this monthly summary. The survey in the November 13 th edition of the Indiana Weekly Weather and Crop report rates 12% of topsoils as short or very short of soil moisture. The survey places 36% of subsoils in these same
3 categories. The report also notes that corn and soybean harvest is about 95% complete. Wheat planting is essentially finished with 86% of this crop emerged. Pastures have rebounded into good condition as has the grazing livestock. There has been good growth of hay and cover crops with the improved soil moisture conditions around the state. Cover crops are being planted heavily this year to preserve the unused nutrients left over from the summer drought. November 11 th 17 th Warm air surged into Indiana and covered much of the eastern half of the country as this week began. A warm front to our north had reached the Canadian border while a strong cold front neared the Mississippi River. Indiana daily state temperatures soared to 18 F above normal with windy conditions. The cold front marched eastward and passed through our state on November 12 th. The thermometer tumbled back to normal, then fell some more over the next two days to 9 F below normal, the lowest of the week. The cold front raced to the Atlantic coast on November 13 th and high pressure moved overhead Indiana. The next day the high center drifted east of our state, marking the start of a steady but slow warm up to the end of the week. Temperatures gained a few degrees each day to end the week at 1 F below normal. Overall for the week state temperatures averaged about 1 F below normal. Typical daily maximum temperatures range from 49 F in far northern Indiana to 57 F in the extreme southwest. Normal daily minimums vary between 34 F and 37 F north to south across the state. No other fronts crossed our state this week after the first one. High pressure held control over Indiana to the end of the week. An Alberta clipper front traveled to Michigan by November 16 th but dissolved before it could find Indiana. As the first cold front forced the temperature to fall by 18 F, more than a half inch of precipitation was squeezed from Indiana clouds over two days. There was even a little snow mostly in parts of northeast and east central Indiana. But after the front was gone so was the precipitation for the remainder of the week. Regional precipitation totaled about 0.5 inch in northern Indiana, 0.7 inch in central sections, and 0.9 inch across southern counties. These amounts translate to about 80% of normal in the north, and about 95% of normal in central and southern areas. The highest local daily precipitation was measured as 1.41 inch in Poseyville on the morning of November 12 th by a CoCoRaHS observer there. Some other larger amounts that day included 1.28 inch at Melody Hill and 1.26 inch in Hazleton. The greatest totals for the week were nearly the same as these daily readings and from this same southwest area.

4 The cold front moved east of the state late on November 12 th. Some light snow fell in eastern Indiana after its departure. While a few spots received up to a half inch, of the 25 CoCoRaHS volunteers reporting snow, most measured around a quarter inch of snow the next morning. Precipitation and snowfall maps for this week can be found at the end of this weekly narrative. There has been little week to week change in Indiana drought status this month according to the US Drought Monitor. Parts of 5 counties in far northeast Indiana continue in moderate drought status (D1 category), accounting for 6% of total land area. Three east to west bands across the state together account for 37% of land area designated as abnormally dry (D0 category). The remaining 57% of land largely in central Indiana has returned to normal soil moisture status according to the drought report. Weekly Indiana maps of this product are found at the end of this monthly report. The final Indiana Weekly Weather and Crop bulletin for 2012 ends its survey of topsoil moisture at 13% short or very short of moisture. The subsoil moisture survey number is at 39% in these same categories. The report notes that corn and soybean harvest are each more than 90% finished. All of the winter wheat has been planted with 93% of this crop emerged and 90% rated in good or excellent condition going into winter. Livestock continue in mostly good condition. Pastures have recovered to mostly adequate condition after the summer drought. Hay supplies have improved to mostly adequate just in time for winter feeding. November 18 th 24 th The near absence of fronts passing through Indiana this month has kept our weather pattern quiet with little precipitation. Again this week just one front managed to transit our state, a strong cold front late on Thanksgiving Day. State average temperatures started the week at 1 F above normal, rose to about 4 F above normal two days later, then bounced to almost 9 F above normal by Thanksgiving Day, the warmest on this holiday in 39 years for several Indiana communities. Then it was back to autumn reality. The next day Indiana thermometers generally fell to 1 F below normal before ending the week at nearly 9 F below normal. Overall this week state temperatures averaged 2 F above normal. Typical daily maximum temperatures this time of year range from 45 F in our far northern counties to 54 F in the
5 extreme southwest. Daily minimums normally vary from 31 F to 34 F north to south across the state. The week was mostly dry with light precipitation measured on three days. A sprawling ridge of high pressure across the east half of the country slid east of Indiana on November 19 th. This shift allowed a cold front to advance eastward into Wisconsin and Iowa the next day, sprinkling very light rain into Indiana. But the eastern ridge held. In the upper atmosphere a surge of warm air from the west into Indiana dismantled the surface front. The air masses mixed and the cold front lost its identity, dissolving before it could reach our state. The warm flow into Indiana intensified on Thanksgiving Day, forming a unseasonably warm sector of air. Meanwhile the cold air out west reorganized into a new cold front, much stronger than the last. This cold front swept easily through Indiana the next day. Up to a half inch of rain fell across the state. Cold air tapped from central Canada filtered into Indiana to the end of the week. Regional rainfall totals this week were light, averaging about 0.1 inch statewide. These amounts equate to about 10% of normal in northern and southern parts of Indiana and about 25% of normal in central sections. The greatest daily rainfall in the CoCoRaHS network was measured on November 23 rd. On that morning 0.80 inch was recorded at Cloverdale, while three Spencer volunteers noted 0.45 inch, 0.42 inch, and 0.41 inch. The Gosport observer had 0.43 inch. Rainfall the rest of the week was minor so maximum weekly totals were nearly identical to these single day measurements. A weekly Indiana rainfall map appears immediately following below. When the initial cold front dissolved dense fog formed across northern and central Indiana that morning. The fog was heaviest northwest of Indianapolis, resulting in vehicle accidents caused by poor visibility. Later in the week gusty winds near 50 mph announced the arrival of the strong cold front that succeeded in its trip across Indiana. No damage reports due to the high winds were received. Of interest was the local 22 F to 29 F drop in 24 hour temperatures as this front traveled across the state. The pause in week to week changes in Indiana drought status according to the US Drought Monitor persists. Again there was no real movement in the drought intensity or areas affected since a week ago. The weekly drought depiction map is found near the end of this monthly report.
6 November 25 th 30 th Air temperatures swung widely this week. Yet despite these roller coaster changes in the thermometer there was little precipitation to go along with it. The dominant zonal jet stream flow pattern in the upper atmosphere this week did not support storm and precipitation development at ground level. Indiana was positioned on the warm west side of a high pressure ridge as the week began. State temperatures started about 3 F below normal. On November 26 th a strong cold front passed through Indiana and temperatures started to tumble. Over the next day cold air from Canada funneled directly into our state. As the cold dome of air settled over Indiana, state averaged temperatures bottomed to 16 F below normal by November 28 th. Now this cold high pressure center pushed quickly east of our state and a fast warm up was underway. Temperatures rebounded 17 F in one day to reach 1 F above normal. By the end of the week the temperature had jumped to nearly 6 F above normal, that is, a 22 F recovery in just 48 hours. Mix the warm and cold numbers together and for the week overall state temperatures averaged 2 F below normal. Usually in this last week of November daily maximum temperatures would range from 42 F to 51 F north to south across Indiana. Normal daily minimums vary between 29 F in far northern Indiana to 32 F in the extreme southwest. A dramatic temperature change inside a couple days might provide an opportunity for heavy precipitation with possible severe weather. But this week s cold front was quiet and mostly dry, yielding just 0.05 to 0.16 inch of precipitation in the southern tier of counties along the Ohio River and less than 0.05 inch elsewhere across the state. Precipitation was recorded on the mornings of just two days this week, November 26 th and 27 th, as the cold front moved through. There were no heavy single day precipitation amounts worthy of mention. Regional precipitation totals were near zero in northern and central Indiana and less than 0.05 inch across the south, equating to just 3% of normal weekly precipitation. Light snow fell late on November 26 th immediately after the cold front moved through. Up to a half inch of snow fell mostly along a line from Crawfordsville to Hartford City, but most amounts were less than this. Maps showing total precipitation and snowfall for this week are found below. Dryness has persisted now throughout most of November. The US Drought Monitor edition of November 27 th shows a regression in drought status in far northern counties. Areas of Indiana generally north of a Lake Village to Fort Wayne line have now slipped back into moderate drought status (D1 category). This category has increased from 6% last week to 16% of total Indiana land area. The map indicates 3 west to east bands of abnormally dry soils (D0 category), one of these a narrow band south and adjacent to the expanded moderate drought region. Most of Indiana south of a Covington to Liberty line is also rated abnormally dry with exception of parts of about 9 counties in southwest Indiana which have no drought and are at normal soil moisture status. One half of all Indiana area is now rated in normal soil moisture status and 35% as abnormally dry. A series of weekly Indiana Drought Monitor maps can be seen near the end of this monthly summary.
7
8 November 2012 Temperature Region Temperature Normal Deviation Northwest North Central Northeast West Central Central East Central Southwest South Central Southeast State Precipitation Region Precipitation Normal Deviation Percent of Normal Northwest North Central Northeast West Central Central East Central Southwest South Central Southeast State
9 Autumn (September - November) Temperature Region Temperature Normal Deviation Northwest North Central Northeast West Central Central East Central Southwest South Central Southeast State Precipitation Region Precipitation Normal Deviation Percent of Normal Northwest North Central Northeast West Central Central East Central Southwest South Central Southeast State
10 2012 Annual (through November) Temperature Region Temperature Normal Deviation Northwest North Central Northeast West Central Central East Central Southwest South Central Southeast State Precipitation Region Precipitation Normal Deviation Percent of Normal Northwest North Central Northeast West Central Central East Central Southwest South Central Southeast State
11
12
13
14

15 Drought Summary from the U.S. Drought Monitor Below is a drought summary for the state of Indiana from the U.S. drought monitor. Areas in white are not experiencing any drought. Yellow areas are abnormally dry, but not considered a drought. Drought begins when the moisture levels become more severe, with beige, orange, red, and brown indicating increasing levels of drought (moderate, severe, extreme, and exceptional, respectively). The table below indicates how much of the state is not under drought conditions, and also how much of the state is under drought conditions from its respective column upwards. For example, November 6 th has 7.2% of Indiana under at least D1- D4 drought status and 43.6% under at least D0-D4 status. Subtracting the D1-D4 category (7.2%) from the D0-D4 category (43.6%), tells us that 36.4% of Indiana is in the D0 category alone (abnormally dry). Please note, however, that these areas are not exact, and much of this drought map has been created from reports throughout the state and in estimation, so use this information as a general view rather than for specifics.
16 November 6 th Drought Summary
17 November 13 th Drought Summary

18 November 20 th Drought Summary
19 November 27 th Drought Summary
October 2011 Climate Summary
 Ken Scheeringa and Kayla Hudson Nov 4, 2011 http://www.iclimate.org October 2011 Climate Summary Month Summary October weather evolved as a two part story. Weather conditions the first half of the month
December 2011 Climate Summary
 Ken Scheeringa and Kayla Hudson Jan 17, 2012 (765) 494-8105 http://www.iclimate.org December 2011 Climate Summary Month Summary What a difference a year makes! A year ago the misery of a harsh, cold, and
August 2013 Climate Summary
 Ken Scheeringa and Matt Price Sep 6, 2013 (765) 494-8105 http://www.iclimate.org August 2013 Climate Summary Month Summary August weather began cool and wet but became progressively warmer and drier through
October 2012 Climate Summary
 Ken Scheeringa and Kayla Hudson Nov 8, 2012 (765) 494-8105 http://www.iclimate.org October 2012 Climate Summary Month Summary In a reversal from the hot and dry summer, cooler and wetter than normal conditions
May 2005 Climate Summary
 Ashley Brooks (765) 494-6574 Jun 7, 2005 http://iclimate.org May 2005 Climate Summary May 1-5 Early May was characterized by an upper-level trough that was in place over Indiana that brought in very cool
January 2006 Climate Summary
 Ashley Brooks (765) 494-6574 Feb 9, 2006 http://www.iclimate.org January 1-3 January 2006 Climate Summary Unseasonably warm conditions welcomed in the New Year with highs in the 40s across the northern
July 2007 Climate Summary
 Dan Bowman (765) 494-6574 Sep 3, 2007 http://www.iclimate.org Summary July 2007 Climate Summary The month of July ended as a very unusual month. Many events occurred during the month of July that is not
January 2008 Climate Summary
 Joseph Mays (765) 494-6574 Feb 5, 2008 http://www.iclimate.org Summary January 2008 Climate Summary January was a mix bag of conditions, with an oscillatory pattern developing. We experienced phases of
2012 Growing Season Weather Summary for North Dakota. Adnan Akyüz and Barbara A. Mullins Department of Soil Science October 30, 2012
 2012 Growing Season Weather Summary for North Dakota Adnan Akyüz and Barbara A. Mullins Department of Soil Science October 30, 2012 Introduction The 2012 growing season (the period from April through September)
March 2014 Climate Summary
 Ken Scheeringa And Matt Price Apr 8, 2014 (765) 494-8105 http://www.iclimate.org March 2014 Climate Summary Month Summary Winter had officially ended by the calendar but snow and cold persisted in Indiana
August 2017 Climate Summary
 Ken Scheeringa And Andy Eggert Sep 7, 2017 (765) 494-8105 http://www.iclimate.org August 2017 Climate Summary Month Summary The coolest August in 13 years featured long cool and warm spells, below normal
NWS FORM E-5 U.S. DEPARTMENT OF COMMERCE I HYDRO SERVICE AREA NOAA, NATIONAL WEATHER SERVICE I Indianapolis, IN MONTHLY REPORT
 NWS FORM E-5 U.S. DEPARTMENT OF COMMERCE I HYDRO SERVICE AREA NOAA, NATIONAL WEATHER SERVICE I Indianapolis, IN. 1-------------------- MONTHLY REPORT OF RIVER AND FLOOD CONDITIONSI REPORT FOR I November
November 2014 Climate Summary
 Ken Scheeringa And Matt Price Dec 10, 2014 (765) 494-8105 http://www.iclimate.org November 2014 Climate Summary Month Summary Unseasonable cold headlined the Indiana and national news in November. The
2011 Year in Review TORNADOES
 2011 Year in Review The year 2011 had weather events that will be remembered for a long time. Two significant tornado outbreaks in April, widespread damage and power outages from Hurricane Irene in August
The hydrologic service area (HSA) for this office covers Central Kentucky and South Central Indiana.
 for this office covers Central Kentucky and South Central Indiana.") January 2012 February 13, 2012 An X inside this box indicates that no flooding occurred within this hydrologic service area. January 2012 continued the string of wet months this winter. Rainfall was generally
January 2012 February 13, 2012 An X inside this box indicates that no flooding occurred within this hydrologic service area. January 2012 continued the string of wet months this winter. Rainfall was generally
Illinois Drought Update, December 1, 2005 DROUGHT RESPONSE TASK FORCE Illinois State Water Survey, Department of Natural Resources
 Illinois Drought Update, December 1, 2005 DROUGHT RESPONSE TASK FORCE Illinois State Water Survey, Department of Natural Resources For more drought information please go to http://www.sws.uiuc.edu/. SUMMARY.
Champaign-Urbana 1998 Annual Weather Summary
 Champaign-Urbana 1998 Annual Weather Summary ILLINOIS STATE WATER SURVEY Audrey Bryan, Weather Observer 2204 Griffith Dr. Champaign, IL 61820 wxobsrvr@sparc.sws.uiuc.edu The development of the El Nìno
September 2012 Climate Summary
 Ken Scheeringa and Kayla Hudson Oct 5, 2012 (765) 494-8105 http://www.iclimate.org September 2012 Climate Summary Month Summary Summer slipped away and it felt a lot more like autumn in Indiana this month
Monthly Long Range Weather Commentary Issued: February 15, 2015 Steven A. Root, CCM, President/CEO
 Monthly Long Range Weather Commentary Issued: February 15, 2015 Steven A. Root, CCM, President/CEO sroot@weatherbank.com JANUARY 2015 Climate Highlights The Month in Review During January, the average
UNITED STATES AND SOUTH AMERICA OUTLOOK (FULL REPORT) Wednesday, April 18, 2018
 Wednesday, April 18, 2018") T-storm Weather Summary Coolness continues over the next week in much of the central U.S., most likely producing the coldest April since 1907 in the Corn Belt, but followed by seasonable to mild weather
T-storm Weather Summary Coolness continues over the next week in much of the central U.S., most likely producing the coldest April since 1907 in the Corn Belt, but followed by seasonable to mild weather
Monthly Long Range Weather Commentary Issued: SEPTEMBER 19, 2016 Steven A. Root, CCM, Chief Analytics Officer, Sr. VP,
 Monthly Long Range Weather Commentary Issued: SEPTEMBER 19, 2016 Steven A. Root, CCM, Chief Analytics Officer, Sr. VP, sroot@weatherbank.com SEPTEMBER 2016 Climate Highlights The Month in Review The contiguous
Nebraska experienced a wide
 Issue 1 August 2016 CLIMATE UPDATE A MONTHLY SUMMARY FROM THE neclimate.unl.edu August saw reprieve from dryness, cooler temps Overview Nebraska experienced a wide range of conditions across the state
August 2006 Summary. August 1-5
 Ashley Brooks (765) 494-6574 Sep 8, 2006 http://www.iclimate.org August 1-5 August 2006 Summary The heat wave that started during the end of July continued into the beginning parts of August with temperatures
Monthly Long Range Weather Commentary Issued: APRIL 1, 2015 Steven A. Root, CCM, President/CEO
 Monthly Long Range Weather Commentary Issued: APRIL 1, 2015 Steven A. Root, CCM, President/CEO sroot@weatherbank.com FEBRUARY 2015 Climate Highlights The Month in Review The February contiguous U.S. temperature
Monthly Long Range Weather Commentary Issued: May 15, 2014 Steven A. Root, CCM, President/CEO
 Monthly Long Range Weather Commentary Issued: May 15, 2014 Steven A. Root, CCM, President/CEO sroot@weatherbank.com APRIL 2014 REVIEW Climate Highlights The Month in Review The average temperature for
September 2011 Climate Summary
 Ken Scheeringa and Kayla Hudson Oct 5, 2011 (765) 494-8105 http://www.iclimate.org September 2011 Climate Summary Month Summary The final blast of summer heat arrived at the start of September. It lasted
National Wildland Significant Fire Potential Outlook
 National Wildland Significant Fire Potential Outlook National Interagency Fire Center Predictive Services Issued: September, 2007 Wildland Fire Outlook September through December 2007 Significant fire
September 2016 Climate Summary
 Ken Scheeringa And Andy Eggert Oct 6, 2016 (765) 494-8105 http://www.iclimate.org September 2016 Climate Summary Month Summary The warmest September in 77 years brought alternating weeks of dry and wet
August 2015 Climate Summary
 Ken Scheeringa And Mary Rose Mangan Sep 4, 2015 (765) 494-8105 http://www.iclimate.org August 2015 Climate Summary Month Summary A very active wet summer weather pattern turned much calmer and drier in
Monthly Long Range Weather Commentary Issued: July 18, 2014 Steven A. Root, CCM, President/CEO
 Monthly Long Range Weather Commentary Issued: July 18, 2014 Steven A. Root, CCM, President/CEO sroot@weatherbank.com JUNE 2014 REVIEW Climate Highlights The Month in Review The average temperature for
UNITED STATES AND SOUTH AMERICA OUTLOOK (FULL REPORT) Thursday, December 28, 2017
 Thursday, December 28, 2017") T-storm Weather Summary Despite scattered t-storms Sat.-Sun. in central and northern areas in Argentina, more will likely be needed especially in sunflower areas of the southwest. Some t-storms likely
T-storm Weather Summary Despite scattered t-storms Sat.-Sun. in central and northern areas in Argentina, more will likely be needed especially in sunflower areas of the southwest. Some t-storms likely
Champaign-Urbana 1999 Annual Weather Summary
 Champaign-Urbana 1999 Annual Weather Summary ILLINOIS STATE WATER SURVEY 2204 Griffith Dr. Champaign, IL 61820 wxobsrvr@sws.uiuc.edu Maria Peters, Weather Observer A major snowstorm kicked off the new
WeatherManager Weekly
 Issue 288 July 14, 2016 WeatherManager Weekly Industries We Serve Agriculture Energy/Utilities Construction Transportation Retail Our Weather Protection Products Standard Temperature Products Lowest Daily
November 2015 Climate Summary
 Ken Scheeringa And Mary Rose Mangan Dec 8, 2015 (765) 494-8105 http://www.iclimate.org November 2015 Climate Summary Month Summary November was much warmer than normal while precipitation was very near
The Pennsylvania Observer
 The Pennsylvania Observer October 1, 2015 September 2015 - Pennsylvania Weather Recap By: Quinn Lease The month of September will be remembered for its above normal temperatures and dry conditions that
The Pennsylvania Observer
 The Pennsylvania Observer January 5, 2009 December 2008 Pennsylvania Weather Recap The final month of 2008 was much wetter than average and a bit colder than normal. In spite of this combination, most
January 25, Summary
 January 25, 2013 Summary Precipitation since the December 17, 2012, Drought Update has been slightly below average in parts of central and northern Illinois and above average in southern Illinois. Soil
Monthly Long Range Weather Commentary Issued: APRIL 18, 2017 Steven A. Root, CCM, Chief Analytics Officer, Sr. VP,
 Monthly Long Range Weather Commentary Issued: APRIL 18, 2017 Steven A. Root, CCM, Chief Analytics Officer, Sr. VP, sroot@weatherbank.com MARCH 2017 Climate Highlights The Month in Review The average contiguous
The Weather Wire. Contents: Summer 2018 Outlook. Summer 2018 Outlook Drought Monitor May Summary/Statistics June Preview Rainfall Totals
 The Weather Wire June 2018 Volume 25 Number 6 Contents: Summer 2018 Outlook Drought Monitor May Summary/Statistics June Preview Rainfall Totals Summer 2018 Outlook June 1 st marked the first day of meteorological
2018 Year in Review for Central and Southeast Illinois By: Chris Geelhart, Meteorologist National Weather Service, Lincoln IL
 By: Chris Geelhart, Meteorologist National Weather Service, Lincoln IL While 2018 featured some significant out-of-season weather, including below zero temperatures in April and 90-degree highs in early
September 2005 Climate Summary
 Ashley Brooks (765) 494-6574 Oct 5, 2005 http://iclimate.org September 2005 Climate Summary September 1-7 A cold front came through on the 1 st of the month, however little moisture was associated with
NATIONAL WEATHER SERVICE
 January 2016 February 9, 2016 This was a dry month across the HSA despite one large and several smaller snowfalls. Most locations ended up 1-2 inches below normal for the month. The driest locations at
Precipitation. Standardized Precipitation Index. NIDIS Intermountain West Drought Early Warning System September 5, 2017
 9/6/2017 NIDIS Drought and Water Assessment NIDIS Intermountain West Drought Early Warning System September 5, 2017 Precipitation The images above use daily precipitation statistics from NWS COOP, CoCoRaHS,
Champaign-Urbana 2001 Annual Weather Summary
 Champaign-Urbana 2001 Annual Weather Summary ILLINOIS STATE WATER SURVEY 2204 Griffith Dr. Champaign, IL 61820 wxobsrvr@sws.uiuc.edu Maria Peters, Weather Observer January: After a cold and snowy December,
UNITED STATES AND SOUTH AMERICA SNAPSHOT REPORT Thursday, December 21, 2017
 T-storm Weather Summary A small but key corn and soybean area in western Argentina was wetter than expected overnight. T-storms affect varying areas of South America at varying times into January, but
NIDIS Intermountain West Drought Early Warning System November 21, 2017
 NIDIS Drought and Water Assessment NIDIS Intermountain West Drought Early Warning System November 21, 2017 Precipitation The images above use daily precipitation statistics from NWS COOP, CoCoRaHS, and
May 2016 Climate Summary
 Ken Scheeringa And Andy Eggert Jun 6, 2016 (765) 494-8105 http://www.iclimate.org May 2016 Climate Summary Month Summary Cold weather dominated in May until the last week of the month. May began wet but
UNITED STATES AND SOUTH AMERICA WEATHER ROUNDUP Sunday, December 17, 2017
 T-storm Weather Summary Extreme heat was followed by heavy rain in some key areas of Argentina yesterday. T-storms affect much of the driest Argentina, southern Brazil, and Paraguay through 7 to 10 days,
January 2017 Climate Summary
 Ken Scheeringa And Andy Eggert Feb 8, 2017 (765) 494-8105 http://www.iclimate.org January 2017 Climate Summary Month Summary The warmest January in 11 years was nearly 4 F warmer than December 2016. An
Arizona Climate Summary February 2012
 Arizona Climate Summary February 2012 Summary of conditions for January 2012 January 2012 Temperature and Precipitation Summary January 1 st 20 th : The New Year has started on a very dry note. The La
Weather and Climate Summary and Forecast October 2017 Report
 Weather and Climate Summary and Forecast October 2017 Report Gregory V. Jones Linfield College October 4, 2017 Summary: Typical variability in September temperatures with the onset of fall conditions evident
UNITED STATES AND SOUTH AMERICA SNAPSHOT REPORT Wednesday, December 20, 2017
 T-storm Weather Summary T-storms affect all growing areas of South America at one time or another over the next two weeks, but abovenormal rainfall is only likely for corn and soybeans in southern Brazil
November 2010 Climate Summary
 Ken Scheeringa (765) 494-8105 Dec 6, 2010 http://www.iclimate.org November 2010 Climate Summary Summary A four month drought in Indiana is collapsing as significant rain fell the final week of November.
The Pennsylvania Observer
 The Pennsylvania Observer September 3, 2008 Summer 2008 Weather Summary Written by: Brian Thompson The opening days of June started dry, but a warm front brought a widespread rain a couple of days into
The Pennsylvania Observer
 The Pennsylvania Observer April 2, 2009 March 2009 Pennsylvania Weather Recap Prepared by Curt Harpster For the month of March the saying, In like a lion and out like a lamb really fit the pattern quite
Weather and Climate Summary and Forecast Summer 2017
 Weather and Climate Summary and Forecast Summer 2017 Gregory V. Jones Southern Oregon University August 4, 2017 July largely held true to forecast, although it ended with the start of one of the most extreme
Monthly Long Range Weather Commentary Issued: NOVEMBER 16, 2015 Steven A. Root, CCM, Chief Analytics Officer, Sr. VP, sales
 Monthly Long Range Weather Commentary Issued: NOVEMBER 16, 2015 Steven A. Root, CCM, Chief Analytics Officer, Sr. VP, sales sroot@weatherbank.com OCTOBER 2015 Climate Highlights The Month in Review The
October 2015 Volume 22 Number 10
 The Weather Wire October 2015 Volume 22 Number 10 Contents: Local Frost/Freeze Information Drought Monitor September Summary/Statistics October Preview Rainfall Totals Local Frost Freeze Information Many
Weather and Climate Summary and Forecast December 2017 Report
 Weather and Climate Summary and Forecast December 2017 Report Gregory V. Jones Linfield College December 5, 2017 Summary: November was relatively cool and wet from central California throughout most of
Arizona Climate Summary May 2012
 Arizona Climate Summary May 2012 Summary of conditions for April 2012 April 2012 Temperature and Precipitation Summary April 1 st 16 th : Although April began with another low pressure system sweeping
October 2014 Climate Summary
 Ken Scheeringa And Matt Price Nov 10, 2014 (765) 494-8105 http://www.iclimate.org October 2014 Climate Summary Month Summary October featured a mix of weather. A very wet first half of the month evolved
Weather and Climate Summary and Forecast Fall/Winter 2016
 Weather and Climate Summary and Forecast Fall/Winter 2016 Gregory V. Jones Southern Oregon University November 5, 2016 After a year where we were seemingly off by a month in terms of temperatures (March
October 2016 Climate Summary
 Ken Scheeringa And Andy Eggert Nov 9, 2016 (765) 494-8105 http://www.iclimate.org October 2016 Climate Summary Month Summary October was the 9 th month so far this year to average above normal in temperature.
Weather and Climate Summary and Forecast March 2018 Report
 Weather and Climate Summary and Forecast March 2018 Report Gregory V. Jones Linfield College March 7, 2018 Summary: The ridge pattern that brought drier and warmer conditions from December through most
Weather and Climate Summary and Forecast March 2019 Report
 Weather and Climate Summary and Forecast March 2019 Report Gregory V. Jones Linfield College March 2, 2019 Summary: Dramatic flip from a mild winter to a top five coldest February on record in many locations
Weather and Climate Summary and Forecast November 2017 Report
 Weather and Climate Summary and Forecast November 2017 Report Gregory V. Jones Linfield College November 7, 2017 Summary: October was relatively cool and wet north, while warm and very dry south. Dry conditions
Weather and Climate Summary and Forecast April 2018 Report
 Weather and Climate Summary and Forecast April 2018 Report Gregory V. Jones Linfield College April 4, 2018 Summary: A near Miracle March played out bringing cooler and wetter conditions to the majority
Weather and Climate Summary and Forecast October 2018 Report
 Weather and Climate Summary and Forecast October 2018 Report Gregory V. Jones Linfield College October 4, 2018 Summary: Much of Washington, Oregon, coastal California and the Bay Area and delta region
Fronts. Direction of Front
 Fronts Direction of Front Direction of Front Warm Front A cold air mass meets and displaces a warm air mass. Because the moving cold air is more dense, it moves under the less-dense warm air, pushing it
The Pennsylvania Observer
 The Pennsylvania Observer August 3, 2015 July 2015 - Pennsylvania Weather Recap By: Arthur Person Although this seventh month of 2015 was fairly normal across Pennsylvania as a whole, the details reveal
The Pennsylvania Observer
 The Pennsylvania Observer May 31, 2012 May 2012 - Pennsylvania Weather Recap By: Paul Knight The majority of the fifth month had temperatures averaging well above seasonal levels with two distinct hot
SEPTEMBER 2013 REVIEW
 Monthly Long Range Weather Commentary Issued: October 21, 2013 Steven A. Root, CCM, President/CEO sroot@weatherbank.com SEPTEMBER 2013 REVIEW Climate Highlights The Month in Review The average temperature
Arizona Climate Summary
 Arizona Climate Summary March 2014 Summary of conditions for February 2014 February 2014 Temperature and Precipitation Summary February 1 st 16 th : We started off the month of February with some moisture
KANSAS CLIMATE SUMMARY August 2015
 KANSAS CLIMATE SUMMARY August 2015 Cool and Dry August was drier than normal in most of the state. State-wide average precipitation was 2.80 inches or 85 percent of normal. The Northeast division of the
Colorado State University, Fort Collins, CO Weather Station Monthly Summary Report
 Colorado State University, Fort Collins, CO Weather Station Monthly Summary Report Month: December Year: 2016 Temperature: Mean T max was 39.7 F which is 3.1 below the 1981-2010 normal for the month. This
Weather and Climate Summary and Forecast February 2018 Report
 Weather and Climate Summary and Forecast February 2018 Report Gregory V. Jones Linfield College February 5, 2018 Summary: For the majority of the month of January the persistent ridge of high pressure
KANSAS CLIMATE SUMMARY January 2018
 KANSAS CLIMATE SUMMARY January 2018 Some welcome moisture After an extended period with little to no moisture, parts of Kansas recorded some significant precipitation. At Tribune, a small snow event on
May 2016 Volume 23 Number 5
 The Weather Wire May 2016 Volume 23 Number 5 Contents: Winter Summary Current Colorado and West-wide Snow Pack Drought Monitor April Summary/Statistics May Preview Snowfall Totals Winter Summary The Front
Weather and Climate Summary and Forecast August 2018 Report
 Weather and Climate Summary and Forecast August 2018 Report Gregory V. Jones Linfield College August 5, 2018 Summary: July 2018 will likely go down as one of the top five warmest July s on record for many
Climate versus Weather
 Climate versus Weather What is climate? Climate is the average weather usually taken over a 30-year time period for a particular region and time period. Climate is not the same as weather, but rather,
Champaign-Urbana 2000 Annual Weather Summary
 Champaign-Urbana 2000 Annual Weather Summary ILLINOIS STATE WATER SURVEY 2204 Griffith Dr. Champaign, IL 61820 wxobsrvr@sws.uiuc.edu Maria Peters, Weather Observer January: January started on a mild note,
NIDIS Intermountain West Drought Early Warning System October 17, 2017
 NIDIS Drought and Water Assessment NIDIS Intermountain West Drought Early Warning System October 17, 2017 Precipitation The images above use daily precipitation statistics from NWS COOP, CoCoRaHS, and
PRECIPITATION. Last Week Precipitation:
 12/3/2014 NIDIS Drought and Water Assessment PRECIPITATION The images above use daily precipitation statistics from NWS COOP, CoCoRaHS, and CoAgMet stations. From top to bottom, and left to right: most
Colorado State University, Fort Collins, CO Weather Station Monthly Summary Report
 Colorado State University, Fort Collins, CO Weather Station Monthly Summary Report Month: December Year: 2017 Temperature: Mean T max was 47.2 F which is 4.4 above the 1981-2010 normal for the month. This
January 2013 Climate Summary
 Ken Scheeringa and Kayla Hudson Feb 7, 2013 (765) 494-8105 http://www.iclimate.org January 2013 Climate Summary Month Summary Winter or spring? January featured several dramatic swings in temperature and
November 2016 Climate Summary
 Ken Scheeringa And Andy Eggert Dec 15, 2016 (765) 494-8105 http://www.iclimate.org November 2016 Climate Summary Month Summary Unseasonably warm, pleasant, and sunny weather the first half of the month
Climate. Annual Temperature (Last 30 Years) January Temperature. July Temperature. Average Precipitation (Last 30 Years)
 January Temperature. July Temperature. Average Precipitation (Last 30 Years)") Climate Annual Temperature (Last 30 Years) Average Annual High Temp. (F)70, (C)21 Average Annual Low Temp. (F)43, (C)6 January Temperature Average January High Temp. (F)48, (C)9 Average January Low Temp.
Climate Annual Temperature (Last 30 Years) Average Annual High Temp. (F)70, (C)21 Average Annual Low Temp. (F)43, (C)6 January Temperature Average January High Temp. (F)48, (C)9 Average January Low Temp.
KANSAS CLIMATE SUMMARY April 2017
 KANSAS CLIMATE SUMMARY April 2017 Epic Blizzard While much of the month was warmer than normal, the last week brought a return to cold, wintery weather in the western third of the state, and cold rainy
Weather and Climate Summary and Forecast Winter
 Weather and Climate Summary and Forecast Winter 2016-17 Gregory V. Jones Southern Oregon University February 7, 2017 What a difference from last year at this time. Temperatures in January and February
Weather and Climate Summary and Forecast January 2018 Report
 Weather and Climate Summary and Forecast January 2018 Report Gregory V. Jones Linfield College January 5, 2018 Summary: A persistent ridge of high pressure over the west in December produced strong inversions
KANSAS CLIMATE SUMMARY November 2017
 KANSAS CLIMATE SUMMARY November 2017 Dry The major climate feature for November was the dryness. Statewide average precipitation was just 0.10 inches, which is a 3-way tie for the sixth driest November
NIDIS Intermountain West Drought Early Warning System February 12, 2019
 NIDIS Intermountain West Drought Early Warning System February 12, 2019 Precipitation The images above use daily precipitation statistics from NWS COOP, CoCoRaHS, and CoAgMet stations. From top to bottom,
KANSAS CLIMATE SUMMARY October 2016
 KANSAS CLIMATE SUMMARY October 2016 Record warmth Temperatures continued the warmer than normal pattern through much of October. The state-wide average temperature was 60.9 of, or 5.6 degrees warmer than
KANSAS CLIMATE SUMMARY February 2015
 KANSAS CLIMATE SUMMARY February 2015 Extended Cold Despite some record warm readings at a few locations, February was characterized by colder than normal conditions. This was particularly true during the
L.O Students will learn about factors that influences the environment
 Name L.O Students will learn about factors that influences the environment Date 1. At the present time, glaciers occur mostly in areas of A) high latitude or high altitude B) low latitude or low altitude
Colorado CoCoRaHS. Colorado CoCoRaHS. Because Every Drop Counts! November 2014 Volume 2, Issue 11
 U.S. PRECIPITATION (% OF AVERAGE) LOOKING BACK AT OCTOBER 2014 October was a fairly dry month for much of the nation with the exception of the Pacific Northwest, portions of New England and the Tennessee
NIDIS Intermountain West Drought Early Warning System January 16, 2018
 NIDIS Drought and Water Assessment NIDIS Intermountain West Drought Early Warning System January 16, 2018 Precipitation The images above use daily precipitation statistics from NWS COOP, CoCoRaHS, and
but 2012 was dry Most farmers pulled in a crop
 After a winter that wasn t, conditions late in the year pointed to a return to normal snow and cold conditions Most farmers pulled in a crop but 2012 was dry b y M i k e Wr o b l e w s k i, w e a t h e
KANSAS CLIMATE SUMMARY June 2016
 KANSAS CLIMATE SUMMARY June 2016 Summer arrives early June made a quick turn-around with both temperature and precipitation in most of the state. Only the Southwest Division averaged above normal precipitation
Weather and Climate Summary and Forecast January 2019 Report
 Weather and Climate Summary and Forecast January 2019 Report Gregory V. Jones Linfield College January 4, 2019 Summary: December was mild and dry over much of the west, while the east was much warmer than