Arizona Climate Summary May 2012
|
|
|
- Kathleen Morton
- 6 years ago
- Views:
Transcription


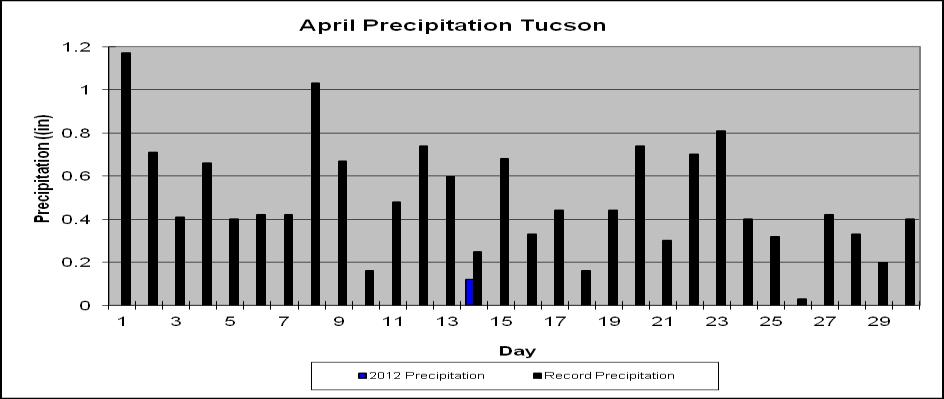
1 Arizona Climate Summary May 2012 Summary of conditions for April 2012 April 2012 Temperature and Precipitation Summary April 1 st 16 th : Although April began with another low pressure system sweeping eastward from California, there was no moisture associated with the system, so no precipitation was reported in Arizona. On the 2 nd, low became cut-off over Utah, and by the 3 rd it was over New Mexico, but Arizona remained dry. High pressure returned on the 4 th and 5 th, and temperatures climbed back up into the 90s in the southwest deserts, peaking at 97 o F on the 9 th at Gila Bend. By the 11 th, the high pressure ridge broke down as a strong low pressure system moved east through California. This system had some moisture associated with it, but by the time it reached Arizona much of the moisture had already fallen over California. The first wave of precipitation fell on the 11 th in northern and central Arizona, with 0.15 or less reported in Flagstaff, Bullhead City and Prescott. The storm stalled off the California coast, and the 12 th and 13 th were dry in Arizona. The system finally moved through Arizona from the 14 th through the morning of the 16 th, leaving behind significant snowfall of 7.9 at Bellemont, 12 at the north rim of the Grand Canyon, 6 at Flagstaff (Fort Valley), 1.8 at Payson, and 3 each at Seligman and Show Low. Temperatures with this storm dropped into the mid 70s for the highs at the warmer locations, and down to 18 o F at night at the north rim of the Grand Canyon. April 17 th 30 th : High pressure returned on the 17 th and remained in place until the 26 th. During this 9-day period, temperatures climbed well above normal statewide, peaking at 107 o F at Buckskin Mountain on the 22nd. On that same day, the lowest maximum temperature reported was 71 o F at the north rim of the Grand Canyon. On the 21 st, Phoenix reached 100 o F for the first time this year, tying the old record which was first set in The next day it was 105 o F, breaking the old record of 101 o F first set in Tucson reached 100 on the 22 nd and 23rd, with 101 on the 22 nd and 100 on the 23 rd. Flagstaff reached 78 o F on the 22 nd and 23 rd, breaking the previous records of 76 and 77 o F respectively, both set in On Thursday the 26 th, a very strong low pressure system moved eastward from California once again bringing rainfall to Arizona. Although there was copious moisture associated with the storm, it dumped most of the rainfall on California. The rainfall covered the northern and central portions of the state with the highest total of 0.58 in Flagstaff. Tucson remained dry and Phoenix received 0.03, although many locations in the north valley had between 0.10 and After the system passed, temperatures rose again to bear normal values, with some areas slightly warmer than normal. The southwest deserts reached the lower 90s. The hot spots were Yuma at 97 o F on the 28 th and Bullhead City at 98 o F on the 30 th. In This Issue: Overview of April, graphs of the April daily maximum and minimum temperatures, precipitation, mean daily dew points for Flagstaff, Phoenix, and Tucson; April climate statistics, maps of mean monthly maximum and minimum temperatures, precipitation, dew points, wind speeds for April; and graphs of the mean April temperature and precipitation for the period of record for Tucson, Phoenix, and Flagstaff, graphs of the cumulative precipitation for the calendar year for Flagstaff, Phoenix, and Tucson. Climate calendars for Flagstaff, Phoenix, Tucson, Prescott, Winslow and Yuma, including daily and monthly normals and extremes, for each month of the year, can be downloaded directly from the State Climate website. See p. 18 of this report for calendar abbreviations. Data are preliminary and are from the National Weather Service Forecast Offices in Flagstaff, Phoenix and Tucson. **Note: The discrepancy between the Statewide Temperature and Precipitation values for Phoenix, Flagstaff and Tucson and the daily values in their graphs are due to the reporting times. Statewide Temperature and Precipitation values are taken at 5pm, while official daily records at the airports are taken from Midnight to Midnight. State Climate Office School of Geographical Sciences & Urban Planning Dr. Nancy J. Selover, State Climatologist Arizona State University Tel: Tempe, AZ Arizona State Climate Office Edited by Nancy J. Selover & Matt Salerno 1


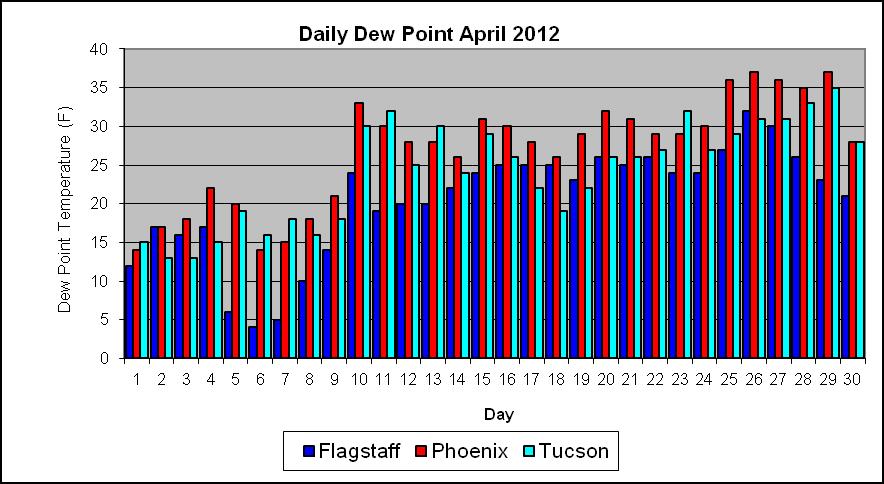
2 April 2012 Daily Temperature, Precipitation, & Dew Point for Flagstaff, Phoenix, and Tucson 2
3 3
4 FLAGSTAFF CLIMATE STATISTICS April 2012 April was the 23 rd warmest and had no significant ranking for precipitation. Avg Max Temp (F) 62.2 Normal 58.2 Avg Min Temp (F) 29.3 Normal 28.5 Avg Mean Temp (F) 45.7 Normal 43.3 Departure from Normal (F) +2.4 Highest Monthly Avg Temp (F) 50.4 in 1989 Lowest Monthly Avg Temp (F) 36.2 in 1975 Highest Temp this month (F): 78 on 22 nd, 23 rd Lowest Temp this month (F): 20 on 7 th Record High (F): 80 on 4/07/1992 4/07/1989 Record Low (F): -2 on 4/02/1975 Temperature or precipitation records this month: 22 nd HiMax 78 set, previous record 76 in rd HiMax 78 set, previous record 77 in 1949 Flagstaff Number of Days of: Minimum Temp 20 o or lower 1 Minimum Temp 30 o or higher 14 Maximum Temp 50 o or lower 5 Maximum Temp 70 o or higher 7 Heating Degree Days 572 Normal 649 Cooling Degree Days 0 Normal 0 Degree base 65 o F Total April Precipitation 1.24 Normal April Precipitation 1.15 Departure from normal Greatest 24-Hr Precipitation 0.60 on 4/14 Total Precipitation Year-to-Date 4.46 Departure from Normal Number of Days: Clear 25 Partly Cloudy 4 Cloudy 1 Greatest April Precipitation 5.62 in 1965 Least April Precipitation 0.00 in 1991 Average Wind Speed Highest Peak Gust 7.6 mph 55 mph from 210 o on 11 th PHOENIX CLIMATE STATISTICS April 2012 April had no significant ranking for temperature and was the 14 th driest on record Avg Max Temp(F) 87.6 Normal 85.2 Avg Min Temp(F) 62.6 Normal 60.2 Avg Mean Temp (F) 75.1 Normal 72.1 Departure from Normal (F) +2.4 Highest Monthly Avg Temp (F) 80.0 in 1989 Lowest Monthly Avg Temp (F) 62.4 in 1967 Highest Temp this month (F): 105 on 22 nd Lowest Temp this month (F): 50 on 14 th Record High (F): 105 on 4/22/2012 4/29/ /20/1989 Record Low (F): 35 on 4/10/1922 Temperature or precipitation records set this month: 21 st HiMax 103 tied, first set in nd HiMax 105 set, previous record 101 in nd HiMin 73 set, previous record 72 in rd HiMin 74 set, previous record 71 in 1997 Phoenix Number of Days of: Minimum Temp 60 o or lower 12 Minimum Temp 70 o or higher 5 Maximum Temp 80 o or lower 8 Maximum Temp 100 o or higher 3 Heating Degree Days 8 Normal 20
5 Cooling Degree Days 319 Normal 251 Degree base 65 o F Total April Precipitation 0.08 Normal April Precipitation 0.28 Departure from normal Greatest 24-Hr Precipitation 0.05 on 4/14 Total Precipitation Year-to-Date 0.33 Departure from Normal Partly Cloudy 16 Cloudy 0 Greatest April Precipitation 3.36 in 1926 Least April Precipitation 0.00 in 1896, 2008, and 27 other years. Average Wind Speed 6.7 mph Highest Peak Gust 41 mph from 280 o on 26 th Number of Days: Clear 14 TUCSON CLIMATE STATISTICS April 2012 April was the 10 th warmest and had no significant ranking for precipitation Avg Max Temp(F) 85.5 Normal 82.1 Avg Min Temp(F) 54.0 Normal 52.0 Avg Mean Temp(F) 69.8 Normal 67.0 Departure from Normal (F) +2.8 Highest Monthly Avg Temp (F) 73.8 in 1989 Lowest Monthly Avg Temp (F) 57.8 in 1975 Highest Temp this month (F): 101 on 22 nd Lowest Temp this month (F): 40 on 15 th Record High (F): 104 on 4/21/1989 4/20/1989 Record Low (F): 27 on 4/04/1945 Temperature or precipitation records set this month: 22 nd HiMax 101 set, previous record 98 in rd HiMax 100 set, previous record 96 in rd HiMin 67 tied, first set in 1967 Tucson Number of Days of: Minimum Temp 50 o or lower 10 Minimum Temp 60 o or higher 8 Maximum Temp 70 o or lower 3 Maximum Temp 100 o or higher 2 Heating Degree Days 49 Normal 60 Cooling Degree Days 198 Normal 121 Degree base 65 o F Total April Precipitation 0.12 Normal April Precipitation 0.31 Departure from normal Greatest 24-Hr Precipitation 0.12 on 4/13-14 Total Precipitation Year-to-Date 0.68 Departure from Normal Greatest April Precipitation 3.53 in 1905 Least April Precipitation 0.00 in 1895, 2006, and 24 other years. Number of Days: Clear 29 Partly Cloudy 1 Cloudy 0 Average Wind Speed Highest Peak Gust 6.9 mph 43 mph from 230 o on 26 th Data are from the National Weather Service and the National Climatic Data Center and are preliminary. 5
6 Winds for April: Day Phoenix Flagstaff Tucson (mph) Avg Max Avg Max Avg Max Dew Points for April: Daily Average Dew Point ( o F): Day Phx Tuc Flg
 network operated by the Bureau of Land Management and Forest Service and the")
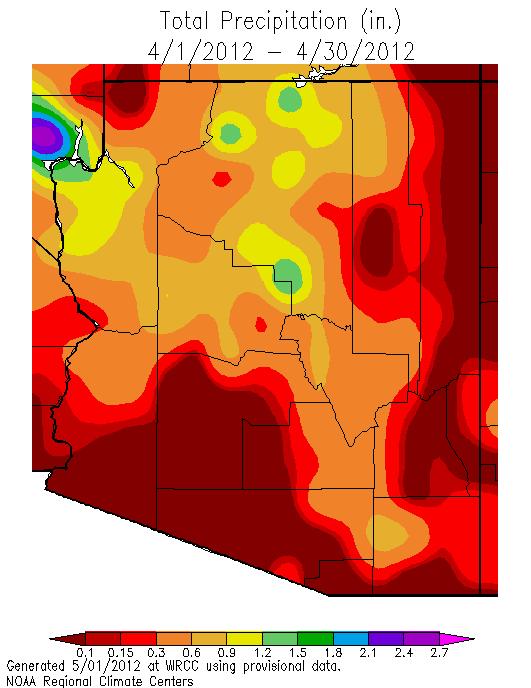
7 April 2012 Temperature, Dew Point, Wind Speed, and Precipitation Maps are based on preliminary data from the National Weather Service, the Arizona Meteorological Network (AZMet), operated by the University of Arizona College of Agriculture Cooperative Extension and the RAWS (Remote Automated Weather Station) network operated by the Bureau of Land Management and Forest Service and the CoCoRaHS (Community Collaborative Rain, Hail and Snow) Network. Average nighttime temperatures ranged from 23 o F at Alpine to 64 o F at Oatman in west central Arizona. Average daytime temperatures ranged from 55 o F at Dry Park in northern Arizona to 93 o F at Lake Havasu City. Precipitation values ranged from 0 in many places in the southwest deserts to 3.20 at Mormon Lake. 7
8 Average monthly dew points ranged from 14 o F at Rucker in southeastern Arizona to 43 o F at Yuma Valley. Average winds were light, with 13 mph as the highest average at Guthrie. The highest peak wind gust was 68 mph at Tweed s Point in northwestern Arizona. This month we have wind barbs to represent the peak winds. The barbs are like arrows with feathers at the end to show the wind speed. The end with the feathers is pointing in the direction the winds blow from, as they blow into the station. One half barb is 5 mph, a full barb is 10 mph, and a pennant is 50 mph. So Four Springs will have one pennant and two full and one half barbs. 8
9 9


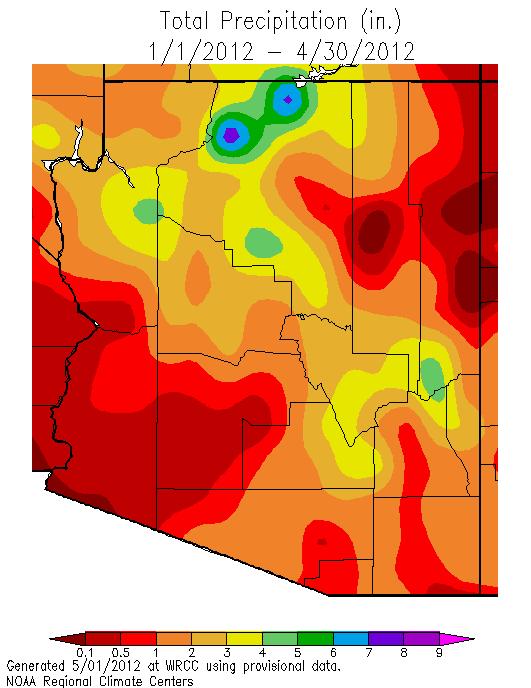
10 April minimum temperatures were generally 0-5 o F warmer than average across most of the state, with some colder pockets in southern Gila and northeastern Pinal County. Daytime temperatures were 0-6 o F warmer than normal statewide. Only two storm systems moved through the state this month. While humidities were high enough for significant cloud cover, the moisture associated with the storms was relatively low. Precipitation was well below normal in the southern and eastern counties, while La Paz and Mohave County received over 200% of normal. April is generally our last wet month until the monsoon, so the May map is not likely to show much improvement. 10
11 11
12 Calendar Year 2012 Since January, nighttime temperatures have ranged from 3 degrees colder than normal to 3 degrees warmer than normal. Maricopa, Pinal and Gila counties were the warmest and Yavapai, Apache and central Navajo counties were the coolest. The pattern is quite localized. Daytime temperatures have generally been 1 to 5 o F warmer than normal across most of the state with the warmest spots in central Navajo, western Coconino and northeastern Apache counties. The warm conditions across the north are a bit unusual as the northern counties have had more frequent cold fronts passing through, though not much precipitation has resulted from those storms. Precipitation since the first of the year has been virtually non-existent. Only the southern White Mountains have had near average precipitation. Most of the state has had less than 70% of normal and the southwest deserts have received less than 25% of normal precipitation. 12
13 13


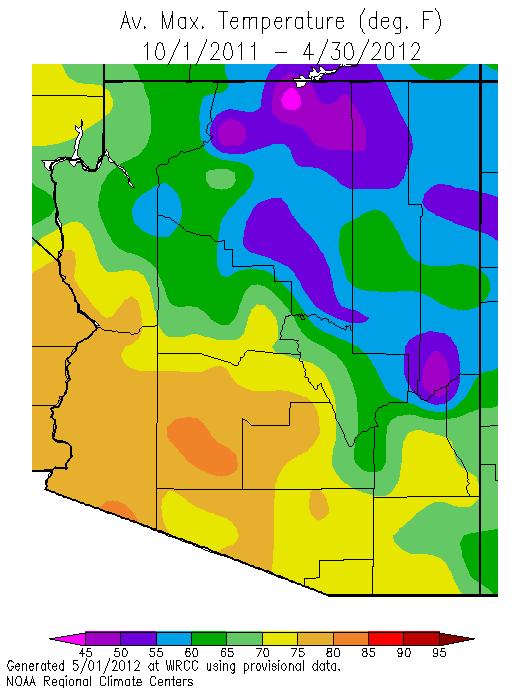
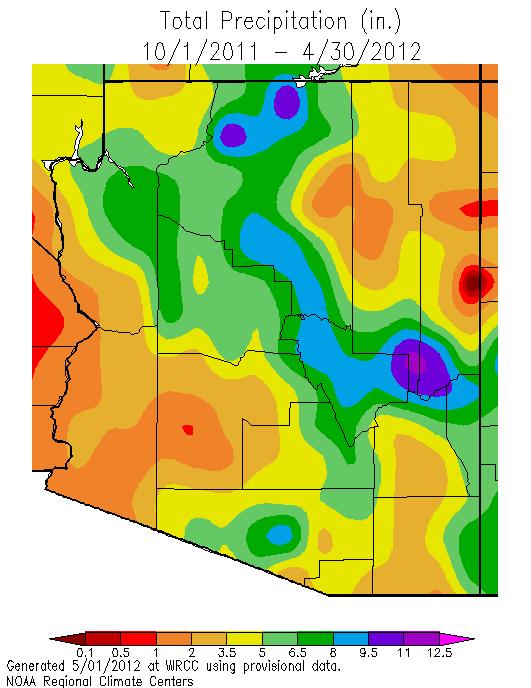
14 Water Year 2012 (Oct Sep ) While the early part of the water year was cold and wet, conditions since January have continued to be warm and dry, resulting in patches of colder than average temperatures as well as warmer than average temperatures. Both nighttime lows and daytime highs have been quite variable around the state, 0 to 3 degrees colder than normal or 0 to 3 degrees warmer than normal. Precipitation has been scarce for the water year, with most of the state at less than 70% of average. Maricopa, southern Mohave, Cochise, and northern Apache counties have received less than 50% of average precipitation since October. These dry conditions could result in an active wildfire season as we enter the normal dry spring season from May through June. 14


15 April Mean Temperature Graphs Flagstaff, Phoenix, and Tucson : 15
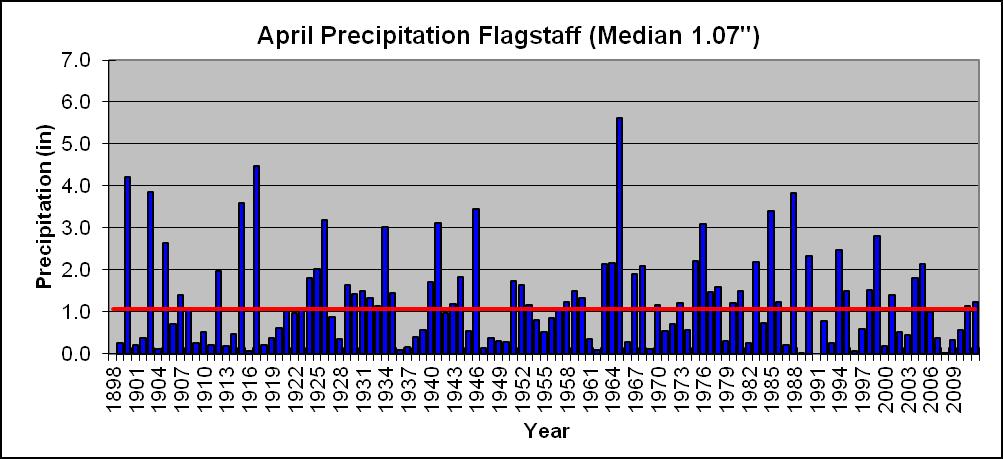
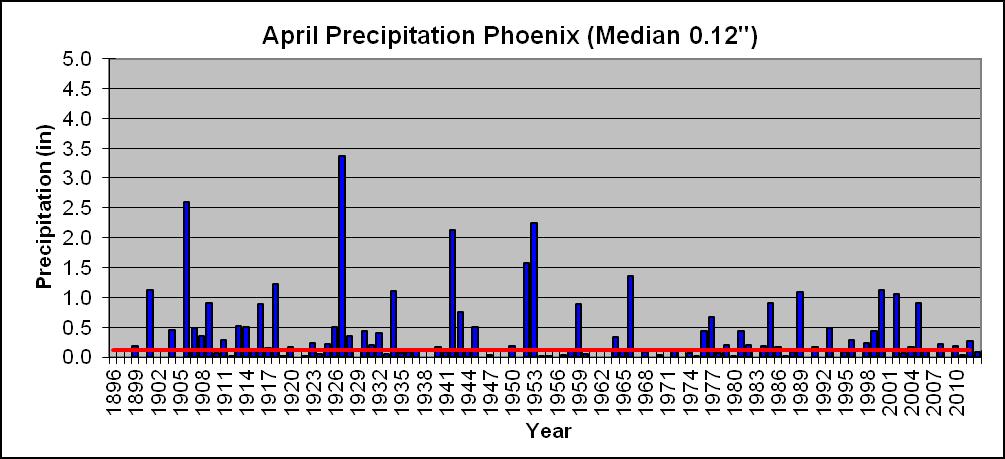
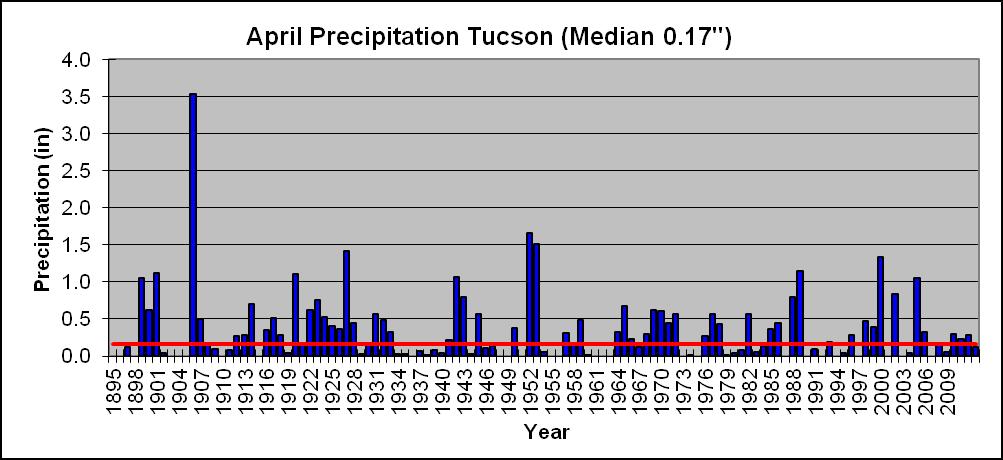
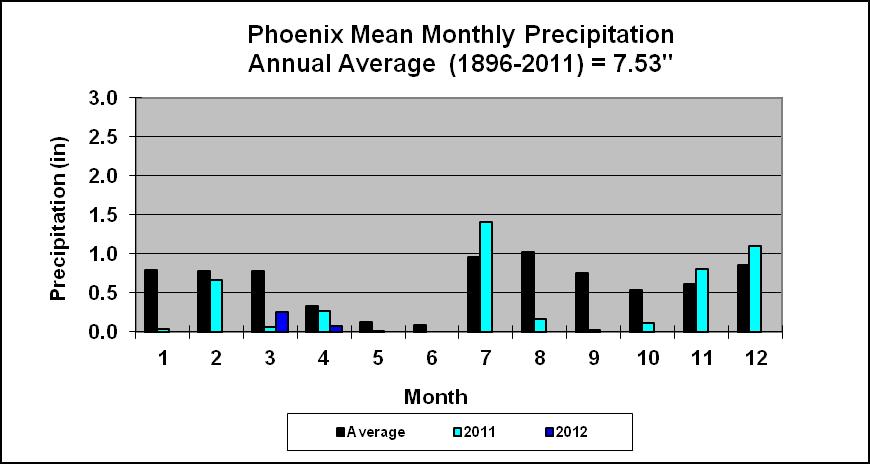
16 April Mean Precipitation Graphs Flagstaff, Phoenix, and Tucson : 16


17 2012 Cumulative Precipitation Graphs Flagstaff, Phoenix and Tucson: Flagstaff and Tucson have similar cumulative precipitation to last year, while Phoenix is much drier than
18 The downloadable normals and extremes calendars use the following abbreviations: NORM = 30 year ( ) average value (degrees Fahrenheit (F)) OBS = The temperature observation for that day this year AVG = Average daily temperature HI MAX = Highest maximum temperature for that day (F) LO MAX = Lowest maximum temperature for that day (F) LO MIN = Lowest minimum temperature for that day (F) HI MIN = Highest minimum temperature for that day (F) Mx PCP = Maximum precipitation for that day (inches) Mx SNO = Maximum snowfall for that day (inches) 18
Arizona Climate Summary February 2012
 Arizona Climate Summary February 2012 Summary of conditions for January 2012 January 2012 Temperature and Precipitation Summary January 1 st 20 th : The New Year has started on a very dry note. The La
Arizona Climate Summary
 Arizona Climate Summary June 2012 Summary of conditions for May 2012 May 2012 Temperature and Precipitation Summary May 1 st 16 th : May began with a surface cold front sweeping across the western states
Arizona Climate Summary April 2013
 Arizona Climate Summary April 2013 Summary of conditions for March 2013 March 2013 Temperature and Precipitation Summary March 1 st 16 th : March began as a ridge of high pressure progressed across the
Arizona Climate Summary May 2013
 Arizona Climate Summary May 2013 Summary of conditions for April 2013 April 2013 Temperature and Precipitation Summary April 1 st 16 th : The first week of April featured a ridge of high pressure over
Arizona Climate Summary March 2013
 Arizona Climate Summary March 2013 Summary of conditions for February 2013 February 2013 Temperature and Precipitation Summary February 1 st 16 th : February began with a ridge of high pressure over the
Arizona Climate Summary November 2015 Summary of conditions for October 2015
 October 2015 Temperature and Precipitation Summary Arizona Climate Summary November 2015 Summary of conditions for October 2015 October 1 st 14 th : October began with high pressure over the southwest,
Arizona Climate Summary June 2013
 Arizona Climate Summary June 2013 Summary of conditions for May 2013 May 2013 Temperature and Precipitation Summary May 1 st 16 th : May began with above normal daily temperatures and breezy conditions
Arizona Climate Summary
 August 2015 Temperature and Precipitation Summary Arizona Climate Summary September 2015 Summary of conditions for August 2015 August 1 st 16 th : August was a wet month across the state with only 3 days
Arizona Climate Summary August 2013
 Arizona Climate Summary August 2013 Summary of conditions for July 2013 July 2013 Temperature and Precipitation Summary July 1 st 16 th : To start off the month of July, a high pressure system came in
Arizona Climate Summary November 2017 Summary of conditions for October 2017
 Arizona Climate Summary November 2017 Summary of conditions for October 2017 October 2017 Temperature and Precipitation Summary October 1 st 18 th : A low pressure system from the northwestern U.S. moved
Arizona Climate Summary October 2013
 Arizona Climate Summary October 2013 Summary of conditions for September 2013 September 2013 Temperature and Precipitation Summary September 1 st 16 th : With moist conditions still present throughout
Arizona Climate Summary November 2016 Summary of conditions for October 2016
 Arizona Climate Summary November 2016 Summary of conditions for October 2016 October 2016 Temperature and Precipitation Summary October 1 st 16 th : October began with high pressure over Mexico, bringing
Arizona Climate Summary December 2017 Summary of conditions for November 2017
 November 2017 Temperature and Precipitation Summary Arizona Climate Summary December 2017 Summary of conditions for November 2017 November 1 st 17 th : October ended with a little bit of precipitation
Arizona Climate Summary June 2017 Summary of conditions for May 2017
 Arizona Climate Summary June 2017 Summary of conditions for May 2017 May 2017 Temperature and Precipitation Summary May 1 st 16 th : A strong ridge of high pressure developed over the southwest during
Arizona Climate Summary December 2016 Summary of conditions for November 2016
 Arizona Climate Summary December 2016 Summary of conditions for November 2016 November 2016 Temperature and Precipitation Summary November 1 st 16 th : November began with a dry low pressure system moving
Arizona Climate Summary
 Arizona Climate Summary April 2014 Summary of conditions for March 2014 March 2014 Temperature and Precipitation Summary March 1 st 16 th : We started off the month of March with a significant precipitation
Arizona Climate Summary May 2018 Summary of conditions for April 2018
 April 2018 Temperature and Precipitation Summary Arizona Climate Summary May 2018 Summary of conditions for April 2018 April 1 st 16 th : April was a very dry month across Arizona. Several low pressure
Arizona Climate Summary January 2017 Summary of conditions for December 2016
 Arizona Climate Summary January 2017 Summary of conditions for December 2016 December 2016 Temperature and Precipitation Summary December 1 st 15 th : Similar to November, December began with a dry trough
Arizona Climate Summary
 May 2015 Temperature and Precipitation Summary Arizona Climate Summary June 2015 Summary of conditions for May 2015 May 1 st 14 th : May began with high pressure in the west, and May 1 st was dry statewide,
Arizona Climate Summary May 2015 Summary of conditions for April 2015
 Arizona Climate Summary May 2015 Summary of conditions for April 2015 April 2015 Temperature and Precipitation Summary April 1 st 16 th : April began with very light showers in Nogales and Coronado National
Arizona Climate Summary February 2016 Summary of conditions for January 2016
 January 2016 Temperature and Precipitation Summary Arizona Climate Summary February 2016 Summary of conditions for January 2016 January 1 st 14 th : The new year began with high pressure over the southwest
Arizona Climate Summary September 2017 Summary of conditions for August 2017
 August 2017 Temperature and Precipitation Summary Arizona Climate Summary September 2017 Summary of conditions for August 2017 August 1 st 15 th : The monsoon activity that ended July continued into the
Arizona Climate Summary
 Arizona Climate Summary March 2014 Summary of conditions for February 2014 February 2014 Temperature and Precipitation Summary February 1 st 16 th : We started off the month of February with some moisture
Arizona Climate Summary February 2018 Summary of conditions for January 2018
 Arizona Climate Summary February 2018 Summary of conditions for January 2018 January 2018 Temperature and Precipitation Summary January 1 st 19 th : The new year began with a ridge of high pressure over
Arizona Climate Summary October 2016 Summary of conditions for September 2016
 September 2016 Temperature and Precipitation Summary Arizona Climate Summary October 2016 Summary of conditions for September 2016 September 1 st 14 th : High pressure over the Four Corners brought rainfall
Arizona Climate Summary September 2018 Summary of conditions for August 2018
 August 2018 Temperature and Precipitation Summary Arizona Climate Summary September 2018 Summary of conditions for August 2018 August 1 st 15 th : August began with high pressure centered over the state
Arizona Climate Summary July 2015 Summary of conditions for June 2015
 June 2015 Temperature and Precipitation Summary Arizona Climate Summary July 2015 Summary of conditions for June 2015 June 1 st 14 th : Similar to May, June began with high pressure in the west, and conditions
Arizona Climate Summary
 April 2016 Temperature and Precipitation Summary Arizona Climate Summary May 2016 Summary of conditions for April 2016 April 1 st 15 th : April 1 st saw the tail end of a low pressure system move out of
Arizona Climate Summary April 2018 Summary of conditions for March 2018
 Arizona Climate Summary April 2018 Summary of conditions for March 2018 March 2018 Temperature and Precipitation Summary March 1 st 16 th : March began with rainfall in southeastern Arizona as the tail
Arizona Climate Summary
 Arizona Climate Summary August 2016 Summary of conditions for July 2016 July 2016 Temperature and Precipitation Summary July 1 st 15 th : As June ended and July began, a shortwave moved through the southwest
Arizona Climate Summary October 2018 Summary of conditions for September 2018
 Arizona Climate Summary October 2018 Summary of conditions for September 2018 September 2018 Temperature and Precipitation Summary September 1 st 17 th : The wet pattern from August continued into September
Arizona Climate Summary October 2012
 Arizona Climate Summary October 2012 Summary of conditions for September 2012 September 2012 Temperature and Precipitation Summary September 1 st 14 th : September began with an upper level low pressure
Arizona Climate Summary October 2015 Summary of conditions for September 2015
 September 2015 Temperature and Precipitation Summary Arizona Climate Summary October 2015 Summary of conditions for September 2015 September 1 st 18 th : September began with high pressure over southern
Arizona Climate Summary November 2013
 Arizona Climate Summary November 2013 Summary of conditions for October 2013 October 2013 Temperature and Precipitation Summary October 1 st 16 th : The month of October started off with fair weather conditions
Arizona Climate Summary November 2018 Summary of conditions for October 2018
 Arizona Climate Summary November 2018 Summary of conditions for October 2018 October 2018 Temperature and Precipitation Summary October 1 st 15 th : The 2018 water year ending September 30 th was exceptionally
Arizona Climate Summary September 2014 Summary of conditions for August 2014
 Arizona Climate Summary September 2014 Summary of conditions for August 2014 August 2014 Temperature and Precipitation Summary August 1 st 16 th : The first 5 days of August were quite wet with high pressure
Colorado State University, Fort Collins, CO Weather Station Monthly Summary Report
 Colorado State University, Fort Collins, CO Weather Station Monthly Summary Report Month: January Year: 2019 Temperature: Mean T max was 47.2 F which is 3.0 above the 1981-2010 normal for the month. This
Champaign-Urbana 1999 Annual Weather Summary
 Champaign-Urbana 1999 Annual Weather Summary ILLINOIS STATE WATER SURVEY 2204 Griffith Dr. Champaign, IL 61820 wxobsrvr@sws.uiuc.edu Maria Peters, Weather Observer A major snowstorm kicked off the new
Colorado State University, Fort Collins, CO Weather Station Monthly Summary Report
 Colorado State University, Fort Collins, CO Weather Station Monthly Summary Report Month: December Year: 2017 Temperature: Mean T max was 47.2 F which is 4.4 above the 1981-2010 normal for the month. This
2012 Growing Season Weather Summary for North Dakota. Adnan Akyüz and Barbara A. Mullins Department of Soil Science October 30, 2012
 2012 Growing Season Weather Summary for North Dakota Adnan Akyüz and Barbara A. Mullins Department of Soil Science October 30, 2012 Introduction The 2012 growing season (the period from April through September)
Champaign-Urbana 2001 Annual Weather Summary
 Champaign-Urbana 2001 Annual Weather Summary ILLINOIS STATE WATER SURVEY 2204 Griffith Dr. Champaign, IL 61820 wxobsrvr@sws.uiuc.edu Maria Peters, Weather Observer January: After a cold and snowy December,
Monthly Long Range Weather Commentary Issued: July 18, 2014 Steven A. Root, CCM, President/CEO
 Monthly Long Range Weather Commentary Issued: July 18, 2014 Steven A. Root, CCM, President/CEO sroot@weatherbank.com JUNE 2014 REVIEW Climate Highlights The Month in Review The average temperature for
The Pennsylvania Observer
 The Pennsylvania Observer April 2, 2009 March 2009 Pennsylvania Weather Recap Prepared by Curt Harpster For the month of March the saying, In like a lion and out like a lamb really fit the pattern quite
Champaign-Urbana 1998 Annual Weather Summary
 Champaign-Urbana 1998 Annual Weather Summary ILLINOIS STATE WATER SURVEY Audrey Bryan, Weather Observer 2204 Griffith Dr. Champaign, IL 61820 wxobsrvr@sparc.sws.uiuc.edu The development of the El Nìno
Monthly Long Range Weather Commentary Issued: APRIL 18, 2017 Steven A. Root, CCM, Chief Analytics Officer, Sr. VP,
 Monthly Long Range Weather Commentary Issued: APRIL 18, 2017 Steven A. Root, CCM, Chief Analytics Officer, Sr. VP, sroot@weatherbank.com MARCH 2017 Climate Highlights The Month in Review The average contiguous
Monthly Long Range Weather Commentary Issued: February 15, 2015 Steven A. Root, CCM, President/CEO
 Monthly Long Range Weather Commentary Issued: February 15, 2015 Steven A. Root, CCM, President/CEO sroot@weatherbank.com JANUARY 2015 Climate Highlights The Month in Review During January, the average
Colorado State University, Fort Collins, CO Weather Station Monthly Summary Report
 Colorado State University, Fort Collins, CO Weather Station Monthly Summary Report Month: December Year: 2016 Temperature: Mean T max was 39.7 F which is 3.1 below the 1981-2010 normal for the month. This
The Pennsylvania Observer
 The Pennsylvania Observer December 2, 2015 November 2015 - Pennsylvania Weather Recap By: Anthny Chiavaroli This November was dry with above average temperatures across the state. Western PA saw some very
The Pennsylvania Observer
 The Pennsylvania Observer August 3, 2015 July 2015 - Pennsylvania Weather Recap By: Arthur Person Although this seventh month of 2015 was fairly normal across Pennsylvania as a whole, the details reveal
January 2006 Climate Summary
 Ashley Brooks (765) 494-6574 Feb 9, 2006 http://www.iclimate.org January 1-3 January 2006 Climate Summary Unseasonably warm conditions welcomed in the New Year with highs in the 40s across the northern
Colorado State University, Fort Collins, CO Weather Station Monthly Summary Report
 Colorado State University, Fort Collins, CO Weather Station Monthly Summary Report Month: February Year: 2017 Webcam catching a hawk watching over the station. Temperature: Mean T max was 54.4 F which
Champaign-Urbana 2000 Annual Weather Summary
 Champaign-Urbana 2000 Annual Weather Summary ILLINOIS STATE WATER SURVEY 2204 Griffith Dr. Champaign, IL 61820 wxobsrvr@sws.uiuc.edu Maria Peters, Weather Observer January: January started on a mild note,
SEPTEMBER 2013 REVIEW
 Monthly Long Range Weather Commentary Issued: October 21, 2013 Steven A. Root, CCM, President/CEO sroot@weatherbank.com SEPTEMBER 2013 REVIEW Climate Highlights The Month in Review The average temperature
The Pennsylvania Observer
 The Pennsylvania Observer October 1, 2015 September 2015 - Pennsylvania Weather Recap By: Quinn Lease The month of September will be remembered for its above normal temperatures and dry conditions that
2011 Year in Review TORNADOES
 2011 Year in Review The year 2011 had weather events that will be remembered for a long time. Two significant tornado outbreaks in April, widespread damage and power outages from Hurricane Irene in August
Monthly Long Range Weather Commentary Issued: APRIL 25, 2016 Steven A. Root, CCM, Chief Analytics Officer, Sr. VP, sales
 Monthly Long Range Weather Commentary Issued: APRIL 25, 2016 Steven A. Root, CCM, Chief Analytics Officer, Sr. VP, sales sroot@weatherbank.com MARCH 2016 Climate Highlights The Month in Review The March
Monthly Long Range Weather Commentary Issued: APRIL 1, 2015 Steven A. Root, CCM, President/CEO
 Monthly Long Range Weather Commentary Issued: APRIL 1, 2015 Steven A. Root, CCM, President/CEO sroot@weatherbank.com FEBRUARY 2015 Climate Highlights The Month in Review The February contiguous U.S. temperature
The Weather Wire. Contents: Summer 2018 Outlook. Summer 2018 Outlook Drought Monitor May Summary/Statistics June Preview Rainfall Totals
 The Weather Wire June 2018 Volume 25 Number 6 Contents: Summer 2018 Outlook Drought Monitor May Summary/Statistics June Preview Rainfall Totals Summer 2018 Outlook June 1 st marked the first day of meteorological
Climate. Annual Temperature (Last 30 Years) January Temperature. July Temperature. Average Precipitation (Last 30 Years)
 January Temperature. July Temperature. Average Precipitation (Last 30 Years)") Climate Annual Temperature (Last 30 Years) Average Annual High Temp. (F)70, (C)21 Average Annual Low Temp. (F)43, (C)6 January Temperature Average January High Temp. (F)48, (C)9 Average January Low Temp.
Climate Annual Temperature (Last 30 Years) Average Annual High Temp. (F)70, (C)21 Average Annual Low Temp. (F)43, (C)6 January Temperature Average January High Temp. (F)48, (C)9 Average January Low Temp.
Weather and Climate Summary and Forecast October 2018 Report
 Weather and Climate Summary and Forecast October 2018 Report Gregory V. Jones Linfield College October 4, 2018 Summary: Much of Washington, Oregon, coastal California and the Bay Area and delta region
National Wildland Significant Fire Potential Outlook
 National Wildland Significant Fire Potential Outlook National Interagency Fire Center Predictive Services Issued: September, 2007 Wildland Fire Outlook September through December 2007 Significant fire
Monthly Long Range Weather Commentary Issued: May 15, 2014 Steven A. Root, CCM, President/CEO
 Monthly Long Range Weather Commentary Issued: May 15, 2014 Steven A. Root, CCM, President/CEO sroot@weatherbank.com APRIL 2014 REVIEW Climate Highlights The Month in Review The average temperature for
October 2015 Volume 22 Number 10
 The Weather Wire October 2015 Volume 22 Number 10 Contents: Local Frost/Freeze Information Drought Monitor September Summary/Statistics October Preview Rainfall Totals Local Frost Freeze Information Many
Weather History on the Bishop Paiute Reservation
 Weather History on the Bishop Paiute Reservation -211 For additional information contact Toni Richards, Air Quality Specialist 76 873 784 toni.richards@bishoppaiute.org Updated 2//214 3:14 PM Weather History
The Pennsylvania Observer
 The Pennsylvania Observer September 3, 2008 Summer 2008 Weather Summary Written by: Brian Thompson The opening days of June started dry, but a warm front brought a widespread rain a couple of days into
Weather and Climate of the Rogue Valley By Gregory V. Jones, Ph.D., Southern Oregon University
 Weather and Climate of the Rogue Valley By Gregory V. Jones, Ph.D., Southern Oregon University The Rogue Valley region is one of many intermountain valley areas along the west coast of the United States.
Monthly Long Range Weather Commentary Issued: SEPTEMBER 19, 2016 Steven A. Root, CCM, Chief Analytics Officer, Sr. VP,
 Monthly Long Range Weather Commentary Issued: SEPTEMBER 19, 2016 Steven A. Root, CCM, Chief Analytics Officer, Sr. VP, sroot@weatherbank.com SEPTEMBER 2016 Climate Highlights The Month in Review The contiguous
The Pennsylvania Observer
 The Pennsylvania Observer June 2, 2010 May 2010 Pennsylvania Weather Recap This month completed one of the warmest springs on record in Pennsylvania. With about 75% of the days averaging above normal,
KANSAS CLIMATE SUMMARY August 2015
 KANSAS CLIMATE SUMMARY August 2015 Cool and Dry August was drier than normal in most of the state. State-wide average precipitation was 2.80 inches or 85 percent of normal. The Northeast division of the
L.O Students will learn about factors that influences the environment
 Name L.O Students will learn about factors that influences the environment Date 1. At the present time, glaciers occur mostly in areas of A) high latitude or high altitude B) low latitude or low altitude
New Hampshire State Climate Office Dr. Mary D. Stampone, State Climatologist
 New Hampshire State Climate Office Dr. Mary D. Stampone, State Climatologist University of New Hampshire c/o Department of Geography 73 Main Street Durham, NH 03824 Phone: 603-862-3136 Fax: 603-862-4362
1. Which weather map symbol is associated with extremely low air pressure? A) B) C) D) 2. The diagram below represents a weather instrument.
 B) C) D) 2. The diagram below represents a weather instrument.") 1. Which weather map symbol is associated with extremely low air pressure? 2. The diagram below represents a weather instrument. Which weather variable was this instrument designed to measure? A) air pressure
1. Which weather map symbol is associated with extremely low air pressure? 2. The diagram below represents a weather instrument. Which weather variable was this instrument designed to measure? A) air pressure
The Pennsylvania Observer
 The Pennsylvania Observer May 31, 2012 May 2012 - Pennsylvania Weather Recap By: Paul Knight The majority of the fifth month had temperatures averaging well above seasonal levels with two distinct hot
The Weather Wire. Contents: Wildfires Burning Across Colorado
 The Weather Wire July 2018 Volume 25 Number 7 Contents: Wildfires Burning Across Colorado Drought Monitor June Summary/Statistics July Preview Rainfall Totals Wildfires Burning Across Colorado Following
Weather and Climate Summary and Forecast Summer 2017
 Weather and Climate Summary and Forecast Summer 2017 Gregory V. Jones Southern Oregon University August 4, 2017 July largely held true to forecast, although it ended with the start of one of the most extreme
The Pennsylvania Observer
 The Pennsylvania Observer January 5, 2009 December 2008 Pennsylvania Weather Recap The final month of 2008 was much wetter than average and a bit colder than normal. In spite of this combination, most
Weather and Climate Summary and Forecast February 2018 Report
 Weather and Climate Summary and Forecast February 2018 Report Gregory V. Jones Linfield College February 5, 2018 Summary: For the majority of the month of January the persistent ridge of high pressure
KANSAS CLIMATE SUMMARY February 2017
 KANSAS CLIMATE SUMMARY February 2017 Warm and dry February was much warmer and drier than normal. The state-wide average temperature was 41.9 o F, which is 7.9 degrees warmer than normal. This places it
Monthly Long Range Weather Commentary Issued: NOVEMBER 16, 2015 Steven A. Root, CCM, Chief Analytics Officer, Sr. VP, sales
 Monthly Long Range Weather Commentary Issued: NOVEMBER 16, 2015 Steven A. Root, CCM, Chief Analytics Officer, Sr. VP, sales sroot@weatherbank.com OCTOBER 2015 Climate Highlights The Month in Review The
KANSAS CLIMATE SUMMARY October 2016
 KANSAS CLIMATE SUMMARY October 2016 Record warmth Temperatures continued the warmer than normal pattern through much of October. The state-wide average temperature was 60.9 of, or 5.6 degrees warmer than
YOU MUST USE WHAT YOU KNOW ABOUT THE MOVEMENT OF AIR MASSES DUE TO THE CORIOLIS EFFECT TO FORECAST!
 For this project you will apply past and present data to predict and future weather patterns and events and justify the predictions in terms of energy transfer between various systems. You will use this
July 2007 Climate Summary
 Dan Bowman (765) 494-6574 Sep 3, 2007 http://www.iclimate.org Summary July 2007 Climate Summary The month of July ended as a very unusual month. Many events occurred during the month of July that is not
Weather and Climate Summary and Forecast August 2018 Report
 Weather and Climate Summary and Forecast August 2018 Report Gregory V. Jones Linfield College August 5, 2018 Summary: July 2018 will likely go down as one of the top five warmest July s on record for many
DEPARTMENT OF EARTH & CLIMATE SCIENCES Name SAN FRANCISCO STATE UNIVERSITY Nov 29, ERTH 360 Test #2 200 pts
 DEPARTMENT OF EARTH & CLIMATE SCIENCES Name SAN FRANCISCO STATE UNIVERSITY Nov 29, 2018 ERTH 360 Test #2 200 pts Each question is worth 4 points. Indicate your BEST CHOICE for each question on the Scantron
KANSAS CLIMATE SUMMARY January 2018
 KANSAS CLIMATE SUMMARY January 2018 Some welcome moisture After an extended period with little to no moisture, parts of Kansas recorded some significant precipitation. At Tribune, a small snow event on
The Climate of Murray County
 The Climate of Murray County Murray County is part of the Crosstimbers. This region is a transition between prairies and the mountains of southeastern Oklahoma. Average annual precipitation ranges from
Chill Hour Assessment for the Yuma Area
 Chill Hour Assessment for the Yuma Area Item Type text; Article Authors Brown, Paul W. Publisher College of Agriculture, University of Arizona (Tucson, AZ) Journal Deciduous Fruit and Nut: A College of
West Henrico Co. - Glen Allen Weather Center N W. - Koontz
 PAGE #1 Oct 2017 West Henrico Co. - Glen Allen Weather Center 37.6554 N. 77.5692 W. - Koontz 1 2 3 4 5 6 7 8 9 10 11 12 13 14 15 16 17 18 19 Oct Week TEMPERATURE F TEMPERATURE F SKY PRECIPITATION FROZ.
National Meteorological Library and Archive
 National Meteorological Library and Archive Fact sheet No. 4 Climate of the United Kingdom Causes of the weather in the United Kingdom The United Kingdom lies in the latitude of predominately westerly
The hydrologic service area (HSA) for this office covers Central Kentucky and South Central Indiana.
 for this office covers Central Kentucky and South Central Indiana.") January 2012 February 13, 2012 An X inside this box indicates that no flooding occurred within this hydrologic service area. January 2012 continued the string of wet months this winter. Rainfall was generally
January 2012 February 13, 2012 An X inside this box indicates that no flooding occurred within this hydrologic service area. January 2012 continued the string of wet months this winter. Rainfall was generally
Impacts of the April 2013 Mean trough over central North America
 Impacts of the April 2013 Mean trough over central North America By Richard H. Grumm National Weather Service State College, PA Abstract: The mean 500 hpa flow over North America featured a trough over
May 2016 Volume 23 Number 5
 The Weather Wire May 2016 Volume 23 Number 5 Contents: Winter Summary Current Colorado and West-wide Snow Pack Drought Monitor April Summary/Statistics May Preview Snowfall Totals Winter Summary The Front
KANSAS CLIMATE SUMMARY May 2018
 KANSAS CLIMATE SUMMARY May 2018 From Cold to Hot May came close to setting the record as the hottest since 1895. The state-wide average temperature for the month was 70.6 o F. This was 7.2 degrees warmer
Weather Conditions during the 1992 Growing Season
 Weather Conditions during the 1992 Growing Season Item Type text; Article Authors Brown, P.; Russell, B. Publisher College of Agriculture, University of Arizona (Tucson, AZ) Journal Cotton: A College of
The Climate of Kiowa County
 The Climate of Kiowa County Kiowa County is part of the Central Great Plains, encompassing some of the best agricultural land in Oklahoma. Average annual precipitation ranges from about 24 inches in northwestern
The Climate of Bryan County
 The Climate of Bryan County Bryan County is part of the Crosstimbers throughout most of the county. The extreme eastern portions of Bryan County are part of the Cypress Swamp and Forest. Average annual
The Climate of Payne County
 The Climate of Payne County Payne County is part of the Central Great Plains in the west, encompassing some of the best agricultural land in Oklahoma. Payne County is also part of the Crosstimbers in the
New Forecast Section. connection. Volume 3 Issue 4 April 2012
 Volume 3 Issue 4 April 2012 connection www.mesonet.org New Forecast Section Spring has arrived, and so has storm season. For many, that means monitoring the weather and forecast more. To help users prepare
A summary of the heat episodes of June 2017
 A summary of the heat episodes of June 2017 By Richard H. Grumm and Elissa A. Smith National Weather Service State College, PA 1. Overview Over 1800 record high temperatures were set or tied during the
KANSAS CLIMATE SUMMARY June 2016
 KANSAS CLIMATE SUMMARY June 2016 Summer arrives early June made a quick turn-around with both temperature and precipitation in most of the state. Only the Southwest Division averaged above normal precipitation