August 2016 Climate Summary
|
|
|
- Rudolph Houston
- 5 years ago
- Views:
Transcription

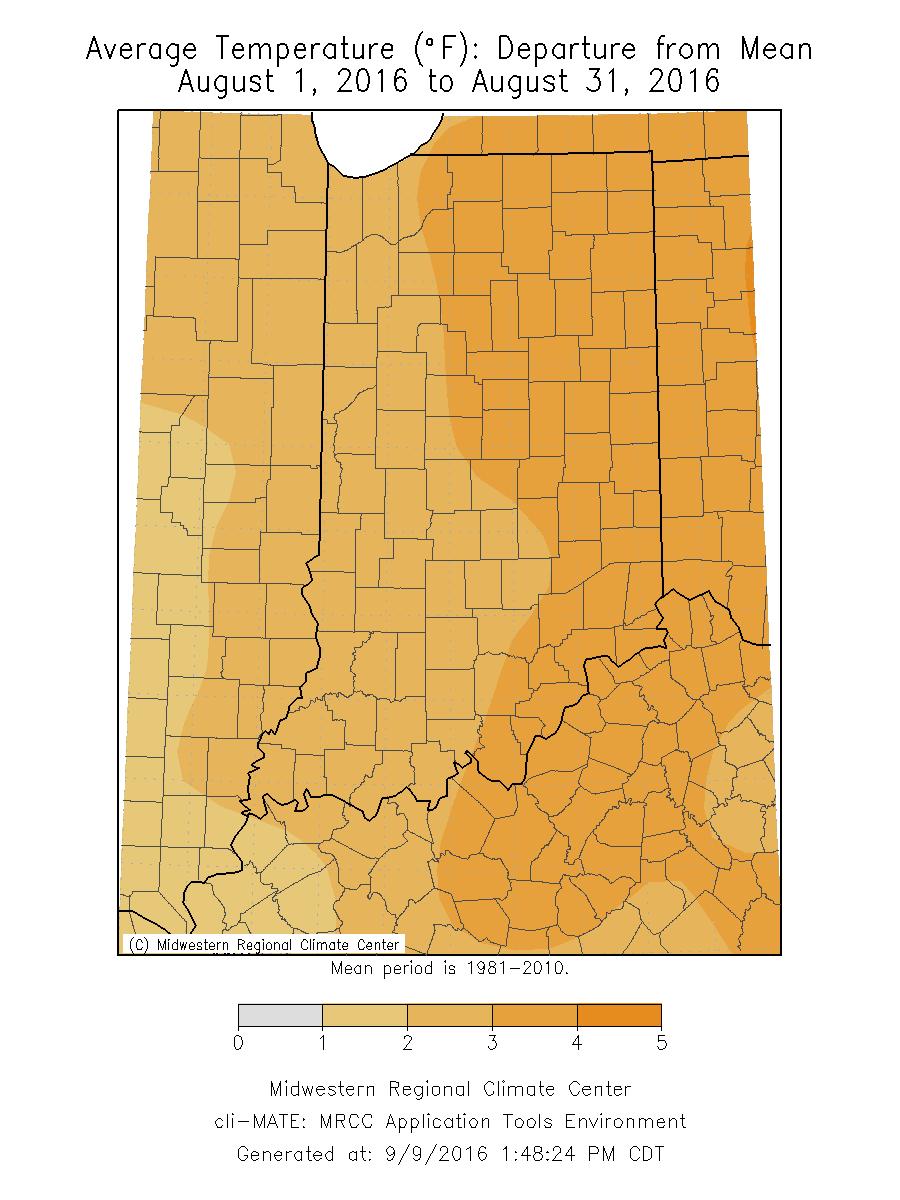
1 Ken Scheeringa And Andy Eggert Sep 12, 2016 (765) August 2016 Climate Summary Month Summary Hot but tranquil weather the first half of August transitioned to a tormented second half with record August tornado outbreaks, 9 severe weather days, and torrential local rainfall. A new August record of 22 confirmed tornadoes was set, smashing the old record of 6 tornadoes. Amazingly there was extensive property damage but no deaths or serious injuries reported. A 33 day warm spell finally ended on August 21 st. August entered the record books as the 2 nd wettest August on record and among the top ten warmest. The August state average temperature was 76.0 F. This is 3.4 F above normal and the 10 th warmest August on record. The 9 th warmest was August 1988 with its 76.2 F average temperature. More recently August 2007 was the 7 th warmest at 76.9 F. August 1995 came in as 3 rd warmest with 77.9 F. The warmest August on record was in 1947 with a scorching 78.7 F average. The day split in August 2016 was 3 days of below normal temperature, 28 days above normal, and no days at normal. There were no large daily deviations in temperature as no days were at least 10 F warmer or cooler than normal. The highest temperature of the month was 99 F on August 25 th at Paoli and the coolest was 50 F on August 23 rd at Crawfordsville 6se. The August state precipitation average was 6.43, a whopping 2.64 above normal. This places August 2016 as the 2 nd wettest August on record. Only the 6.85 state average in August 1977 was wetter since state records began in The heaviest one day precipitation among cooperative stations in August 2016 was on August 16 th at North Judson 3s. The highest among CoCoRaHS stations was 8.95 that same day at Walkerton 4.1ene. The largest month total precipitation in the cooperative network was at North Judson 3s. In the CoCoRaHS network the heaviest was at Hebron 3ssw. Widespread precipitation fell on about 16 days this month. Regionally August 2016 precipitation was near 170% of normal in each of northern, central, and southern Indiana. Normal August precipitation ranges from 3.6 in east central to 4.0 in west central Indiana. Moderate drought developed in a few counties of northeast Indiana early in the month during the long warm spell. This was the first drought in Indiana since the year began. Yet abnormally dry spots in central Indiana gradually disappeared in late August as heavy rains drenched this part of the state.
2 August 1 st 7 th Daily mean temperatures persisted above normal throughout this opening week of August. Light rain was reported on all but one day with the heaviest amounts in the southern third of the state. Soil moisture deteriorated with the introduction of moderate drought (D1 category) in northeast Indiana, the first instance of drought in Indiana since December 29 th. Crops and livestock became stressed due to hot weather with little widespread rainfall. No severe weather was reported this week. The state temperature averaged 2 F above normal on August 1 st. A stationary front was positioned at the Ohio River where it remained through the next day. On August 2 nd the state temperature edged up slightly to 3 F above normal. A new cold front stalled in Wisconsin on August 3 rd, leaving Indiana between two stationary fronts. The state temperature rose to 4 F above normal. A high pressure ridge over Vermont spread westward the next day, forcing the two fronts into retreat away from Indiana. The state temperature peaked at 6 F above normal with very little rain and mostly sunny skies. High pressure from western Canada pumped cooler air into the Dakotas on August 5 th. The leading edge of the cooler air was marked by a cold front in Michigan and Illinois. Indiana and states to the east were entrenched in the warm air sector. The Indiana state temperature hung on to its weekly peak at 6 F above normal. The cold front traveled through Indiana early on August 6 th but was again halted along the Ohio River as a stationary front. The state temperature fell to 4 F above normal in the cooler air. A Canadian ridge nudged the stationary front further south into Tennessee the next day, clearing Indiana skies. Cooler air continued to filter into the state dropping the daily temperature to 1 F above normal. Overall for the week the state temperature averaged to 4 F above normal. Typically at the start of August the daily maximum temperature should range between 82 F in far northern counties to 88 F in the southwest corner of the state. Daily minimums normally vary between 63 F and 67 F north to south across the state. The warmest temperature of the week among cooperative network stations was 94 F at Brookville on August 4 th. The coolest temperature for the week within the same network was 54 F at West Lafayette 6nw on August 7 th. Light rain was reported on all but the last day of the week. It did not rain statewide on any day. Totals were light in northern and central Indiana and in the extreme southwest portion of the state at generally under a half inch. In Knox, Lawrence, and Scott counties generally the heaviest totals were noted at 2 to 2.5. Elsewhere in southern Indiana between 0.5 and 2.0 sums were common. The heaviest single daily amounts were measured on August 5 th and 6 th and included 2.67 near Fort Wayne, two reports of 1.96 and 1.76 in Batesville, 1.91 in Cumberland, and 1.60 at Wabash. Some of the largest week totals were Paoli with 2.74, New Salisbury at 2.14, and Cumberland with Batesville came in with 1.80, and near Shoals the gage caught Regionally only a few hundredths inch of precipitation were tallied on average in northern Indiana, less than 0.2 in central, and 0.9 across southern Indiana. These amounts equate to about 5% of normal in the north, 20% of normal in central areas, and 80% of normal in southern Indiana.

3 Soil moisture conditions worsened in northeast Indiana according to the August 9 th edition of the US Drought Monitor. For the first time this year moderate drought was found in Indiana: in parts of Steuben, Lagrange, Elkhart, Kosciusko, Noble, DeKalb, and Allen counties. The existing abnormally dry (D0 category) area was expanded to include all of Steuben, DeKalb, and Elkhart counties, and additional parts of St Joseph, Marshall, Allen, and Kosciusko counties. In central Indiana all former D0 areas were removed. The net result was a 3% area deterioration into moderate drought, and a 2% improvement in abnormally dry coverage. There was minimal change in normal soil moisture coverage from a week earlier. The USDA Indiana Crop Weather report for August 8 th stated that corn and soybeans were certainly under stress in the hot weather with spotty rainfall. Farmers continued running irrigation wide open. Hay has slowed its growth and another cutting has stalled. Heat and poor pasture conditions have stressed livestock. Weeds were growing rapidly. Crops planted on sand were especially suffering. Leaves were dropping early in corn and stalks firing. Some soybeans were aborting their blossoms in the driest areas. Soybeans were in a critical stage of growth at the time. August 8 th 14 th August 14 th marked the 27 th consecutive day of above normal daily state temperatures in Indiana. Rainfall was recorded the last 5 days of the week with the heaviest amounts coming near the end with the only frontal passage. There were no days when rain fell statewide and no severe weather. Soil moisture improved in parts of east central and northeast Indiana with some removal of abnormally dry areas. Crops and livestock were stressed in northeast Indiana during hot days but fared better in southern Indiana where the heavier rains fell. High pressure was overhead Indiana as the week began on August 8 th. The state average temperature stood at 2 F above normal under mostly sunny skies. The ridge moved to New England the next day and set up a backflow of warmer southerly air into Indiana, allowing the state temperature to rise to 4 F above normal. On August 10 th the core of the ridge drifted offshore while expanding west into Virginia, extending the Indiana backflow a few days longer. The state temperature nudged upward to 5 F above normal, then to 8 F above normal on August 11 th. The Virginia ridge was quite strong and halted a Michigan cold front from advancing south, converting it instead into a warm front.
4 Indiana became part of a large warm air mass sector that covered the east half of the country. A cold front extended to Nebraska out of a low pressure center positioned in the Dakotas. On August 12 th high pressure lunged south out of central and western Canada, reconverting the warm front into a cold front through Michigan. Indiana remained within the shrinking warm air sector with its state temperature peaking at 9 F above normal for the week. The cold front slowed greatly the next day as the east coast ridge held firm. The entire frontal system from New England to Michigan to Arkansas became virtually stationary. Indiana barely clung to the warm sector but the state temperature did fall to 6 F above normal. While the northeast section of the front regained its momentum as a cold front on August 14 th, the remaining piece from Indiana south continued as a stationary front and crawled only slightly east. With the stationary front directly overhead Indiana the state temperature ended the week at just 1 F above normal. Rainfall now turned heavy as moisture streamed northward along the front from Louisiana to Indiana. For the week the state temperature averaged to 5 F above normal. Usually in the second week of August daily maximum temperatures would be expected to range from 81 F to 88 F north to south across the state. Daily minimums typically would vary from 62 F in far northern counties to 66 F in the southwest corner of the state. The warmest temperature of the week as recorded in the cooperative station network was 94 F at Fort Wayne Airport on August 10 th, and again the next day at Goshen 3sw and Goshen Airport. The coolest temperature among stations in this same network was 56 F at Crawfordsville 6se on August 8 th. No rainfall was measured in Indiana according to the CoCoRaHS morning reports of August 8 th and 9 th. Then light amounts fell across parts of the state the next 3 days before gradually becoming heavier during the last 2 days of the week. On the weekly rainfall map more than an inch fell generally south of a Terre Haute to Hartford City to Winchester line but north of an Evansville to French Lick to Madison line. An area north of a Morocco to Goshen line also received more than an inch. A band of heavy 3 to 5 rain fell in spots between Vincennes and Brookville. Much of the rest of Indiana collected less than 1 for the week. The heaviest single day rainfall was measured on the morning of August 14 th. The CoCoRaHS observer outside Vincennes had 6.86 that morning while the Newberry volunteer noted In Bicknell 4.52 was recorded, Washington had 4.43, and near Hazleton 4.20 was collected. Some of the heavier weekly totals among CoCoRaHS stations included two Spencer reports of 5.36 and 4.78, in the Bedford vicinity with 4.90, Oolitic with 4.73, and the Washington sum of Regionally for the week about 0.7 of rain accumulated on average across the northern third of Indiana, about 1.3 over central areas, and 2.1 in the south. These amounts equate to about 80% of normal in the north, 170% of normal in central Indiana, and 260% of normal across the southern third of the state. The August 16 th edition of the US Drought Monitor reported an 8% improvement in Indiana soil moisture status from a week prior. All D0 abnormally dry areas in east central Indiana were removed, essentially along a Miami to Randolph to Wayne county line. In northern Indiana D0 status was removed from St Joseph and Marshall counties and trimmed in Elkhart, Lagrange, Steuben, DeKalb, Kosciusko, and Adams counties. A D1 moderate drought area was removed in Adams county. The net result this week with these changes is a 1% reduction in D1 moderate
5 drought and an 8% reduction in D0 abnormally dry area coverage in Indiana. Soils are in normal soil moisture status in 93% of total Indiana land area, in abnormally dry status in 4%, and in moderate drought status in 3% of total land area. The USDA Indiana Crop Weather report for August 15 th lamented that northeast Indiana crops were under stress due to hot and dry conditions over the past week. Corn leaves were rolling and stalks firing. Pastures and livestock were also stressed. Field irrigation in stressed areas continued. Crops in central and southern Indiana did somewhat better. August 15 th 21 st A month long warm spell ended on August 21 st after 33 consecutive days of above normal daily state temperatures in Indiana. Along with many warm days came plenty of rain days. It rained every day this week with statewide coverage reported on two dates: August 16 th and 21 st. Mix in an abundance of confirmed tornadoes. There were 11 tornadoes in Indiana this week: 8 on August 15 th, and 3 on August 20 th. Despite all the rain there was only slight improvement in Indiana soil moisture according to the US Drought Monitor. Rain spelled relief for stressed crops and livestock yet farmers complained it was too wet in spots that were drenched by heavy rainfall. A stationary front straddled southern Indiana on August 15 th. The state temperature opened the week at 1 F above normal. Rainfall was heavy, flooding St. Joseph county, and 8 tornadoes touched down in central Indiana. The next day the stationary front morphed into a cold front, ready to march southward. The state temperature nudged higher to 2 F above normal. Moisture continued to stream north from Louisiana into Indiana as heavy rain expanded statewide. On August 17 th the wet storm moved to New England pulling the cold front east through and beyond Indiana. Rainfall slowed to moderate rates and left northwest Indiana. Skies were still cloudy and winds fairly calm. High pressure over North Carolina set up a backflow of warmer air into Indiana after the wet storm departed. The state temperature rose a tad to 3 F above normal. Not much changed on the weather map the next day but rainfall became much lighter. The warm backflow continued on August 19 th. Meanwhile an Alberta ridge plunged south into Colorado, transporting cooler air to that region. The next day the ridge shoved its leading cold front
6 further south into New Mexico and east to Missouri. Once again Indiana was positioned inside a warm air sector, bounded on the west by the cold front and on the north by a Michigan warm front. The unstable conditions favored the development of 3 confirmed tornadoes in northeast Indiana. The state temperature dipped to 2 F above normal. The Alberta ridge was still on the move, reaching Kansas on August 21 st. The leading cold front swept through Indiana and the state temperature fell to 2 F below normal. The light rainfall of the past few days became moderate and spread statewide. Overall for the week the state temperature averaged to 2 F above normal. Typically at this point in August the daily maximum temperature should vary between 81 F in the northern tier of counties to 88 F in the southwest corner of the state. Daily minimums should range between 62 F and 65 F north to south across the state. The warmest temperature this week among cooperative network stations was 88 F at Rushville on August 19 th and at Vincennes 5ne the next day. The coolest temperature among stations in the same network was 53 F at Shelbyville on August 20 th. Rainfall was recorded somewhere in Indiana on all 7 days and fell statewide on August 16 th and 21 st according to morning CoCoRaHS reports. Torrential rain fell in St Joseph county as measured on August 16 th. On that day two CoCoRaHS volunteers near South Bend collected 9.95 and Two observers outside Walkerton had 8.95 and 8.82 in their gages. In Granger 8.48 was noted. For the full week the two Walkerton observers tallied and South Bend summed to 8.60 while near Chesterton 8.69 was the total. Granger had On the weekly rainfall map the extreme totals of 8 or more were found in Starke, Laporte, St Joseph, and Elkhart counties. Totals of at least 3 were found generally north of a Clinton to West Lafayette to Angola line. There was also a wedge of 3 or more delimited generally on the north by a Clinton to Liberty line and on the south by a Clinton to Leavenworth line. Most remaining areas had less than 3 with less than 1.5 in parts of Allen and Adams counties. Regionally on average about 3.8 was common across the northern third of Indiana, 3.0 in central counties, and 2.8 across the south. These amounts equate to about 420% of normal in the north and 370% of normal in central and southern Indiana. Severe weather occurred on 4 days this week. On August 15 th there were 8 tornadoes and the already mentioned South Bend flooding. Local wind gust damage was the main complaint on August 17 th and 18 th. Then on August 20 th northeast Indiana noted 3 more confirmed tornadoes and local wind gust damage. Here is a table of essential facts for each of the 8 confirmed tornadoes which struck central and northeast Indiana on August 15 th :
7 County Time (EDT) EF Rating Hendricks 5:36 PM- 5:39 PM Tippecanoe 5:56 PM 5:57 PM Hendricks 6:06 PM 6:07 PM Est Peak Winds EF EF-0 85 EF-1 95 Hendricks 6:15 PM EF-1 95 Hendricks/ 6:19 PM EF-0 80 Boone Boone 6:27 PM 6:35 PM Hamilton 7:04 PM 7:06 PM Howard 8:17 PM 8:18 PM EF EF EF-0 80 Path Max Width Injurie s/death Summary 1.83 miles 500 y 0 Few farm buildings.. Trailer rolled; trees uprooted 0.51 miles 40 y 0 tree trunks snapped; corn mowed down 0.42 miles 100 y 0 trees uprooted; pontoon boat pushed across street brief 50 y 0 tree trunk touchdown brief touchdown snapped 40 y 0 porch pillars removed; tree branches 3.8 miles 150 y 0 pole barn destroyed; trunks snapped; limbs 0.42 miles 100 y 0 tree trunks snapped 0.12 miles 50 y 0 farm shed roof removed; tree limbs Wind damage was reported in 3 counties on August 15 th. In Howard county a barn was damaged and crops flattened. A tree fell across a road and limbs were downed in Boone county, and debris and structure damage were found. In Hendricks county roofing was ripped off, power lines fell, and a traffic signal was downed. Picnic tables and outdoor furniture were blown about and there were multiple reports of limbs down. An uprooted tree blocked a road while more trees were torn down. Storm debris was scattered about and corn and soybean fields were flattened in wind gusts estimated at 100. Nearly 11 of rain resulted in severe flooding of South Bend streets. Several water rescues of vehicles were made. Two houses collapsed from the rain deluge. The foundations of 7 other homes collapsed and 13 homes were destroyed. More than a dozen county roads were closed along with 3 main roads. There were no deaths or injuries as a result of the flooding. The Red Cross opened an emergency shelter in South Bend. Flood warnings were eventually issued for 4 counties including St Joseph, Elkhart, Laporte, and Marshall.
8 On August 17 th wind gusts toppled a tree on to a house and tore down power lines in St Joseph county. Trees were also ripped down in Kosciusko and Huntington counties. The next day a tree was brought down and others uprooted or snapped in Porter county. Flash flooding with power outages in Lake, Porter, and Laporte counties were reported. Corn was flattened in parts of the area and some fields were flooded by the Kankakee River in Laporte county. Two roads in the county were closed. Another tornado outbreak occurred on August 20 th. This time there were 3 confirmed tornadoes with limited damaged. County Elkhart Time (EDT) 3:19 PM- 3:20 PM Allen 5:42 PM 5:49 PM Kosciusko 2:53 PM- 2:57 PM EF rating Est Peak Wind Path Max Width Injuries/ Deaths Summary EF miles 50 y 0 2 homes minor damage; multiple tree limbs; corn flattened EF miles 70 y 0 large tree limbs; corn flattened; tree uprooted; shingle damage; swing set rolled back-tofront yard EF miles 10 y 0 Crops damaged in sporadic fields Straight line winds caused additional damage in Allen county that day and tore down a large tree and some limbs in Jay county. According to the August 23 rd edition of the US Drought Monitor there was very slight improvement in drought and soil moisture conditions this week. Moderate drought (D1 category) was removed from Elkhart, Steuben, and DeKalb counties and reduced in Lagrange and Kosciusko counties. An area of abnormally dry (D0 category) status was reduced in Elkhart county. The net coverage area by category numbers didn t change. Moderate drought continues in 2% of total Indiana land area while abnormally dry conditions persist in 4% of total area. The remaining 94% of Indiana land is still rated in normal soil moisture status for this time of year. The August 22 nd edition of the Indiana Crop Weather report stated that rain spelled relief for crops stressed by heat and lack of moisture. But rainfall this week also kept farmers out of the field due to wet conditions. While rain was adequate in some areas an overabundance in others resulted in local flooding. Some growers were unhappy with the wet soils which made weeds and plant disease prosper and hard to control. High winds in tornadoes caused minor crop flattening problems in some areas. Muddy feed lots and the halting of crop silage operations were a headache for some farmers. On a positive note livestock got a break from the heat and pastures were recovering.
9 August 22 nd 31 st Violent weather was the big story again with another 11 Indiana tornadoes, all in a single day, to set a new record for any August day and for the month! Despite lots of damage there were no deaths or serious injuries in this round of severe weather. After a few cool days to start this 10 day interval, the state temperature lingered near 5 F above normal to close the month. It was wet with rain recorded on 8 of these last ten August days but never statewide. Generally less rain fell in southern Indiana than in northern and central sections. Fields were wet, hampering farmer activities, but livestock looked good. It was a cool day on August 22 nd with the state temperature at 5 F below normal. A high pressure ridge sat over the lower Great Lakes. The ridge drifted east the next day, allowing a backflow of southerly winds to begin to nudge the state temperature to 3 F below normal. The ridge center reached Virginia on August 24 th. Indiana s atmosphere became more unstable as ample humidity was transported in ahead of an advancing cold front. Two supercell thunderstorms traveled across northern Indiana into northwest Ohio. These thunderstorms unleashed multiple tornadoes in central and northeast Indiana. The state temperature bounced to 6 F above normal just ahead of the cold front the next day. By August 26 th the cold front had slowed to a crawl across the northern half of Indiana where it stalled. The state temperature fell just a degree to 5 F above normal. Low pressure traveled from Oklahoma to Missouri the next day, and helped reverse the old cold front into a warm front. The state temperature barely moved to 4 F above normal. On August 28 th the warm front was on the move north across Indiana to the Michigan border. The state temperature rose to 6 F above normal. Here the front slammed into cooler air and stalled yet again. With all the back and forth movement the last few days the air masses had mixed and lost their identity and temperature differences. The front disappeared from the map on August 29 th, allowing high pressure to prevail overhead Indiana with no change in state temperature. A new low system entered Wisconsin on August 30 th, its warm front reaching to southwest Indiana ahead of a new warm sector. The state temperature peaked over the 10 day interval to 7 F above normal.
10 Another day but the same old story. On August 31 st the two fronts folded into a stationary front over central Indiana, the meeting ground for many fronts over the past 7 days. The state temperature dipped to 5 F above normal. Over the 10 day interval the state temperature averaged to 3 F above normal. Daily maximum temperatures in late August typically range between 80 F and 87 F north to south across the state. Daily minimums normally vary from 60 F in the northern tier of counties to 64 F in far southwest Indiana. The warmest temperature observed in the cooperative station network over the 10 days was 99 F at Paoli on August 25 th. The coolest temperature among stations in this same network was 50 F at Crawfordsville 6se on August 23 rd. Rain was reported on 8 days of the 10 day interval but did not cover the entire state on any day. Rainfall was heavy on several days, such as in the August 25 th morning report when a CoCoRaHS observer near Marion noted Two days later amounts of 4.06 and 3.47 were measured just outside Indianapolis. On August 29 th 6.43 was collected near Hebron while 3.50 fell in Pennville. On the weekly rainfall map more than 2 fell generally south of an Attica to Mishawaka to Fort Wayne line but north of an Attica to Shelbyville to Winchester line. Torrential rains of more than 5 was seen in downtown Indianapolis, and along a Monticello to Wabash to Portland line before heading north to Fort Wayne. In contrast less than 1 was tallied generally across the southern third of Indiana and in Steuben county. Some of the highest weekly spot totals included 6.51, 6.28, and 6.02 in Marion county outside the city, 5.13 near Cumberland, and 4.88 near Muncie. Regionally over the 10 day interval about 2.0 was recorded across the northern third of Indiana, 1.9 across central sections, and 1.0 in the south. These amounts equate to about 180% of normal in the north, 160% of normal across central Indiana, and 80% of normal across southern counties. Severe weather continued unabated this month. Reports of tornadoes, wind damage, and large hail were received on half of the 10 days in this interval. The most destructive day by far was August 24 th when 11 tornadoes hit Indiana, 5 of these in Howard county alone. August 24 A state of emergency was declared in Howard county. A Starbucks shop was destroyed and about half the buildings at an apartment complex lost their roofs, causing heavy damage. Air conditioning units mounted on apartment rooftops came crashing to the street, falling on nearly 30 parked cars. About 80 homes were destroyed, 170 homes had major damage, and another 1,000 homes had at least some damage. One resident was trapped in their home. A house in Russiaville was destroyed. Emergency officials opened 3 shelters around Kokomo where at least 400 people checked in and remained through August 26 th while widespread power outages continued. More than 27,000 customers had no power in Kokomo and 39,000 statewide. About 20 people suffered minor injuries due to flying debris but none were serious. A tree fell on a truck and tree stumps lay in yards. In Montgomery county grain wagons were lifted 500 feet into the air, then dropped into a field. Tall corn was leveled over at least 225 acres. Barns were damaged or destroyed, grain silos were toppled on to a highway, roads were closed, and trees snagged power lines. A home and shed lost their roofs. All together about 30 structures were affected. There were no injuries.
11 In Carroll county a resident lost his garage and his barn was flattened. The tornado turned his truck about face while blowing out two windows. Power lines were down in the area. In Marion county lightning started a downtown house fire. One inch hail pummeled some spots and power lines were down. There were 8 emergency runs due to high water and flooding around Indianapolis. Lightning struck a historical theatre in Tippecanoe county, destroying its chimney. In Allen county 5 homes and 2 barns were destroyed in the tornado there. A large tree was blown down in Huntington county. Here is a table of essential facts for each of the 11 confirmed tornadoes which struck central and northeast Indiana on August 24 th : County Time (EDT) EF Rating Est Peak Winds Montgomery 2:38-2:48 pm EF Howard 3:20-3:34 pm EF Marion 4:18-4:19 pm EF-0 80 Carroll/How ard 5:40-6:22 pm EF Howard 7:00-7:02 pm EF-1 85 Howard 7:16-7:20 pm EF-0 75 Wells 4:59-5:00 pm EF-0 65 Path Length Max Width Injuries /Deaths Summary 5.38 miles 125 y 0 Major damage homes and barns; trees 8.78 miles 300 y 20 minor injuries Homes and businesses damaged; Starbucks destroyed 0.37 miles 100 y 0 Home windows out; building roof damage miles 100 y 0 Barns wall & roof; garage foundation; trees 1.51 miles 50 y 0 Garage, trees and crops damaged 2.96 miles 75 y 0 Road sign; billboard; trees 0.4 miles 20 y 0 Branches; barn siding; well house into pond; grain wagons lifted
12 Howard 6:58-7:00 pm EF-0 80 Allen 5:27-5:39 pm EF Adams 5:49-6:03 pm EF Miami 6:13-6:14 pm EF miles 75 y 0 Damaged homes and trees 5.26 miles 500 y 0 Homes damaged, barn destroyed, trees, crop damage 7.62 miles 50 y 0 Crops, partial barn roofs, trees broken or uprooted.06 miles 20 y 0 Roof shingles and sheeting; large tree limbs; power lines August 25 Lots of tree limbs came down in Marion county due to high winds there. August 26 One inch hail was noted in Hamilton county. Wind gusts to 60 tore down trees and power lines there as well. In Marion county trees snapped and large tree limbs broke and fell on the ground. One tree fell on to a home. Heavy rain flooded streets in the county. Homes were damaged and thousands had no power. Some residents had to wait to get back into their homes. August 27 Wind damage moved from central to southeast Indiana. Gusts ripped down trees in Franklin, Dearborn, and Ripley counties. August 28 Hail and wind damage reached statewide. Large trees were snapped or uprooted in Elkhart county in far northern Indiana. To the south a tree fell on a house and power was knocked out in Miami county. Very large hail to 1.75 diameter was observed in Cass county and winds were reported to 70, damaging many more trees. In Grant county wind gusts to 58 took down trees which fell into power lines. One inch diameter hail was observed in Grant, Madison, and White counties. In Delaware county city streets were flooded, prompting home water rescues after heavy rains in a very short time. Firefighters had to carry people out of their homes and to an open shelter. In southern Indiana a tree fell on a house in Knox county. At a campground in Gibson county trees fell on to campers. Wind gusts in Orange county tore the roof off a barn and took down several trees. According to the US Drought Monitor edition of August 30 th there was very little change in Indiana soil moisture and drought status from a week earlier. The net state coverage by abnormally dry (D0 category) soils remained at 4% while soils rated in moderate drought (D1 category) were still 2% of
13 total Indiana land area. The vast majority of Indiana was still rated in normal soil moisture status for this time of year, at 94% coverage. A fraction of D1 soils improved to the D0 category in Lagrange and Kosciusko counties, a tiny change of 0.7% in total land area. The USDA Crop Weather report for August 29 th indicated scattered storms throughout Indiana had increased soil moisture and slowed down field work. There was isolated crop damage where tornadoes raced through fields. The report notes small pockets of drought in northeast Indiana remain, but fields with standing water and muddy fields are actually hurting more of the total crop area. High dew points were promoting corn rot and mold. Livestock are in good shape.
14 August 2016 Temperature Region Temperature Normal Deviation Northwest North Central Northeast West Central Central East Central Southwest South Central Southeast State Precipitation Region Precipitation Normal Deviation Percent of Normal Northwest North Central Northeast West Central Central East Central Southwest South Central Southeast State
15 Summer (June - August) Temperature Region Temperature Normal Deviation Northwest North Central Northeast West Central Central East Central Southwest South Central Southeast State Precipitation Region Precipitation Normal Deviation Percent of Normal Northwest North Central Northeast West Central Central East Central Southwest South Central Southeast State
16 2016 Annual so far (Jan - Aug) Temperature Region Temperature Normal Deviation Northwest North Central Northeast West Central Central East Central Southwest South Central Southeast State Precipitation Region Precipitation Normal Deviation Percent of Normal Northwest North Central Northeast West Central Central East Central Southwest South Central Southeast State
17
18
19

20 Drought Summary from the U.S. Drought Monitor Below is a drought summary for the state of Indiana from the U.S. Drought Monitor. Areas in white are not experiencing any drought. Yellow areas are abnormally dry, but not considered a drought. Drought begins when the moisture levels become more severe, with beige, orange, red, and brown indicating increasing levels of drought (moderate, severe, extreme, and exceptional, respectively). The table below indicates what percentage of the state is drought free, and how much of the state is in drought by degree of severity (D1 - D4 category).
21 Aug 2 nd Drought Summary
22 Aug 9 th Drought Summary
23 Aug 16 th Drought Summary
24 Aug 23 rd Drought Summary
25 Aug 30 th Drought Summary
August 2006 Summary. August 1-5
 Ashley Brooks (765) 494-6574 Sep 8, 2006 http://www.iclimate.org August 1-5 August 2006 Summary The heat wave that started during the end of July continued into the beginning parts of August with temperatures
August 2013 Climate Summary
 Ken Scheeringa and Matt Price Sep 6, 2013 (765) 494-8105 http://www.iclimate.org August 2013 Climate Summary Month Summary August weather began cool and wet but became progressively warmer and drier through
October 2011 Climate Summary
 Ken Scheeringa and Kayla Hudson Nov 4, 2011 http://www.iclimate.org October 2011 Climate Summary Month Summary October weather evolved as a two part story. Weather conditions the first half of the month
July 2007 Climate Summary
 Dan Bowman (765) 494-6574 Sep 3, 2007 http://www.iclimate.org Summary July 2007 Climate Summary The month of July ended as a very unusual month. Many events occurred during the month of July that is not
September 2016 Climate Summary
 Ken Scheeringa And Andy Eggert Oct 6, 2016 (765) 494-8105 http://www.iclimate.org September 2016 Climate Summary Month Summary The warmest September in 77 years brought alternating weeks of dry and wet
August 2015 Climate Summary
 Ken Scheeringa And Mary Rose Mangan Sep 4, 2015 (765) 494-8105 http://www.iclimate.org August 2015 Climate Summary Month Summary A very active wet summer weather pattern turned much calmer and drier in
August 2017 Climate Summary
 Ken Scheeringa And Andy Eggert Sep 7, 2017 (765) 494-8105 http://www.iclimate.org August 2017 Climate Summary Month Summary The coolest August in 13 years featured long cool and warm spells, below normal
March 2016 Climate Summary
 Ken Scheeringa And Andy Eggert Apr 8, 2016 (765) 494-8105 http://www.iclimate.org March 2016 Climate Summary Month Summary Count March as the 7 th month in a row that the state average temperature has
May 2018 Climate Summary
 Ken Scheeringa and Andy Eggert Jun 7, 2018 (765) 494-8105 http://www.iclimate.org May 2018 Climate Summary Month Summary As the calendar turned from April to May temperatures flipped dramatically away
May 2015 Climate Summary
 Ken Scheeringa And Mary Rose Mangan Jun 8, 2015 (765) 494-8105 http://www.iclimate.org May 2015 Climate Summary Month Summary May was a very warm month. Rainfall averaged near normal but was distributed
June 2016 Climate Summary
 Ken Scheeringa And Andy Eggert Jul 8, 2016 (765) 494-8105 http://www.iclimate.org June 2016 Climate Summary Month Summary June was a warm month with below normal temperature on just 6 days. Rainfall was
September 2005 Climate Summary
 Ashley Brooks (765) 494-6574 Oct 5, 2005 http://iclimate.org September 2005 Climate Summary September 1-7 A cold front came through on the 1 st of the month, however little moisture was associated with
February 2017 Climate Summary
 Ken Scheeringa And Andy Eggert Mar 9, 2017 (765) 494-8105 http://www.iclimate.org February 2017 Climate Summary Month Summary February 2017 was the warmest February in Indiana since state climate records
January 2017 Climate Summary
 Ken Scheeringa And Andy Eggert Feb 8, 2017 (765) 494-8105 http://www.iclimate.org January 2017 Climate Summary Month Summary The warmest January in 11 years was nearly 4 F warmer than December 2016. An
May 2016 Climate Summary
 Ken Scheeringa And Andy Eggert Jun 6, 2016 (765) 494-8105 http://www.iclimate.org May 2016 Climate Summary Month Summary Cold weather dominated in May until the last week of the month. May began wet but
December 2011 Climate Summary
 Ken Scheeringa and Kayla Hudson Jan 17, 2012 (765) 494-8105 http://www.iclimate.org December 2011 Climate Summary Month Summary What a difference a year makes! A year ago the misery of a harsh, cold, and
April 2016 Climate Summary
 Ken Scheeringa And Andy Eggert May 9, 2016 (765) 494-8105 http://www.iclimate.org April 2016 Climate Summary Month Summary One month but two seasons. The first half of April was cold with snow. Wind damage
October 2017 Climate Summary
 Ken Scheeringa and Andy Eggert Nov 6, 2017 (765) 494-8105 http://www.iclimate.org October 2017 Climate Summary Month Summary After more than three weeks of warm temperatures October turned suddenly cold
November 2012 Climate Summary
 Ken Scheeringa and Kayla Hudson Dec 6, 2012 (765) 494-8105 http://www.iclimate.org November 2012 Climate Summary Month Summary November was one of those rare weather months in Indiana when not much happened:
July 2010 Climate Summary
 Ken Scheeringa (765) 494-8105 Aug 4, 2010 http://www.iclimate.org July 2010 Climate Summary Summary The warm summer of 2010 continues. Daily state average temperatures were above normal on all but seven
April 2013 Climate Summary
 Ken Scheeringa and Kayla Hudson May 6, 2013 (765) 494-8105 http://www.iclimate.org April 2013 Climate Summary Month Summary Temperatures bounced high and low this month, keeping Hoosiers guessing which
April 2015 Climate Summary
 Ken Scheeringa And Mary Rose Mangan May 8, 2015 http://www iclimate org April 2015 Climate Summary Month Summary April was a month of extremes. Severe weather erupted on 4 days of the first week with multiple
January 2008 Climate Summary
 Joseph Mays (765) 494-6574 Feb 5, 2008 http://www.iclimate.org Summary January 2008 Climate Summary January was a mix bag of conditions, with an oscillatory pattern developing. We experienced phases of
November 2017 Climate Summary
 Ken Scheeringa and Andy Eggert Dec 8, 2017 (765) 494-8105 http://www.iclimate.org November 2017 Climate Summary Month Summary November temperatures alternated spells of warm and cool while precipitation
April 2017 Climate Summary
 Ken Scheeringa And Andy Eggert May 8, 2017 (765) 494-8105 http://www.iclimate.org April 2017 Climate Summary Month Summary April was a very warm and wet month in Indiana, nearly setting a new monthly temperature
September 2012 Climate Summary
 Ken Scheeringa and Kayla Hudson Oct 5, 2012 (765) 494-8105 http://www.iclimate.org September 2012 Climate Summary Month Summary Summer slipped away and it felt a lot more like autumn in Indiana this month
January 2006 Climate Summary
 Ashley Brooks (765) 494-6574 Feb 9, 2006 http://www.iclimate.org January 1-3 January 2006 Climate Summary Unseasonably warm conditions welcomed in the New Year with highs in the 40s across the northern
June 2010 Climate Summary
 Ken Scheeringa (765) 494-8105 Jul 6, 2010 http://www.iclimate.org June 2010 Climate Summary Summary Summer like heat and humidity arrived in Indiana on May 22 nd and dominated our weather scene nearly
November 2014 Climate Summary
 Ken Scheeringa And Matt Price Dec 10, 2014 (765) 494-8105 http://www.iclimate.org November 2014 Climate Summary Month Summary Unseasonable cold headlined the Indiana and national news in November. The
October 2014 Climate Summary
 Ken Scheeringa And Matt Price Nov 10, 2014 (765) 494-8105 http://www.iclimate.org October 2014 Climate Summary Month Summary October featured a mix of weather. A very wet first half of the month evolved
June 2011 Climate Summary
 Ken Scheeringa (765) 494-8105 Jul 8, 2011 http://www.iclimate.org June 2011 Climate Summary Month Summary The abundance of extreme weather this year extended yet another month into June. This month has
January 2012 Climate Summary
 Ken Scheeringa and Kayla Hudson Feb 6, 2012 (765) 494-8105 http://www.iclimate.org January 2012 Climate Summary Month Summary Where is winter? This question found its way into many conversations throughout
September 2011 Climate Summary
 Ken Scheeringa and Kayla Hudson Oct 5, 2011 (765) 494-8105 http://www.iclimate.org September 2011 Climate Summary Month Summary The final blast of summer heat arrived at the start of September. It lasted
July 2011 Climate Summary
 Ken Scheeringa (765) 494-8105 Aug 8, 2011 http://www.iclimate.org July 2011 Climate Summary Month Summary The upper atmospheric high pressure dome which baked the Texas area in heat and drought the past
October 2016 Climate Summary
 Ken Scheeringa And Andy Eggert Nov 9, 2016 (765) 494-8105 http://www.iclimate.org October 2016 Climate Summary Month Summary October was the 9 th month so far this year to average above normal in temperature.
June 2015 Climate Summary
 Ken Scheeringa And Mary Rose Mangan Jul 10, 2015 (765) 494-8105 http://www.iclimate.org June 2015 Climate Summary Month Summary Indiana set a new June rainfall record this month with a state average 8.99.
2011 Year in Review TORNADOES
 2011 Year in Review The year 2011 had weather events that will be remembered for a long time. Two significant tornado outbreaks in April, widespread damage and power outages from Hurricane Irene in August
January 2013 Climate Summary
 Ken Scheeringa and Kayla Hudson Feb 7, 2013 (765) 494-8105 http://www.iclimate.org January 2013 Climate Summary Month Summary Winter or spring? January featured several dramatic swings in temperature and
March 2009 Climate Summary
 Joseph Mays (765) 494-6574 Apr 1, 2009 http://www.iclimate.org Summary March 2009 Climate Summary March is in the books and it continued the trend of extreme weather we have experienced during the first
July 2014 Climate Summary
 Ken Scheeringa And Matt Price Aug 8, 2014 (765) 494-8105 http://www.iclimate.org July 2014 Climate Summary Month Summary July was unseasonably cool and drier than normal. Rainfall was light in parts of
March 2018 Climate Summary
 Ken Scheeringa and Andy Eggert Apr 5, 2018 (765) 494-8105 http://www.iclimate.org March 2018 Climate Summary Month Summary March turned cold with below normal temperatures on two-thirds of its days. Along
March 2014 Climate Summary
 Ken Scheeringa And Matt Price Apr 8, 2014 (765) 494-8105 http://www.iclimate.org March 2014 Climate Summary Month Summary Winter had officially ended by the calendar but snow and cold persisted in Indiana
November 2016 Climate Summary
 Ken Scheeringa And Andy Eggert Dec 15, 2016 (765) 494-8105 http://www.iclimate.org November 2016 Climate Summary Month Summary Unseasonably warm, pleasant, and sunny weather the first half of the month
The hydrologic service area (HSA) for this office covers Central Kentucky and South Central Indiana.
 for this office covers Central Kentucky and South Central Indiana.") January 2012 February 13, 2012 An X inside this box indicates that no flooding occurred within this hydrologic service area. January 2012 continued the string of wet months this winter. Rainfall was generally
January 2012 February 13, 2012 An X inside this box indicates that no flooding occurred within this hydrologic service area. January 2012 continued the string of wet months this winter. Rainfall was generally
NATIONAL WEATHER SERVICE
 January 2016 February 9, 2016 This was a dry month across the HSA despite one large and several smaller snowfalls. Most locations ended up 1-2 inches below normal for the month. The driest locations at
July 2015 Climate Summary
 Ken Scheeringa And Mary Rose Mangan Aug 6, 2015 (765) 494-8105 http://www.iclimate.org July 2015 Climate Summary Month Summary Record setting rainfall in June persisted into the first three weeks of July.
SIGNIFICANT EVENTS Severe Storms November 1994 January 1996 August 1998 and May 2000 March 2002 May 2002 Champaign County
 SIGNIFICANT EVENTS Severe Storms November 1994 On Nov. 1, 1994, high winds gusted over 60 mph at times across the northwest third of Ohio. The highest measured wind gust was 63 mph at Columbus Grove (Putnam).
May 2005 Climate Summary
 Ashley Brooks (765) 494-6574 Jun 7, 2005 http://iclimate.org May 2005 Climate Summary May 1-5 Early May was characterized by an upper-level trough that was in place over Indiana that brought in very cool
November 2015 Climate Summary
 Ken Scheeringa And Mary Rose Mangan Dec 8, 2015 (765) 494-8105 http://www.iclimate.org November 2015 Climate Summary Month Summary November was much warmer than normal while precipitation was very near
National Wildland Significant Fire Potential Outlook
 National Wildland Significant Fire Potential Outlook National Interagency Fire Center Predictive Services Issued: September, 2007 Wildland Fire Outlook September through December 2007 Significant fire
The Pennsylvania Observer
 The Pennsylvania Observer October 1, 2015 September 2015 - Pennsylvania Weather Recap By: Quinn Lease The month of September will be remembered for its above normal temperatures and dry conditions that
The Pennsylvania Observer
 The Pennsylvania Observer August 3, 2015 July 2015 - Pennsylvania Weather Recap By: Arthur Person Although this seventh month of 2015 was fairly normal across Pennsylvania as a whole, the details reveal
January 2018 Climate Summary
 Ken Scheeringa and Andy Eggert Feb 8, 2018 (765) 494-8105 http://www.iclimate.org January 2018 Climate Summary Month Summary January temperature swings were amazing. In the first few days arctic cold pushed
2012 Growing Season Weather Summary for North Dakota. Adnan Akyüz and Barbara A. Mullins Department of Soil Science October 30, 2012
 2012 Growing Season Weather Summary for North Dakota Adnan Akyüz and Barbara A. Mullins Department of Soil Science October 30, 2012 Introduction The 2012 growing season (the period from April through September)
Champaign-Urbana 1998 Annual Weather Summary
 Champaign-Urbana 1998 Annual Weather Summary ILLINOIS STATE WATER SURVEY Audrey Bryan, Weather Observer 2204 Griffith Dr. Champaign, IL 61820 wxobsrvr@sparc.sws.uiuc.edu The development of the El Nìno
The hydrologic service area (HSA) for this office covers Central Kentucky and South Central Indiana.
 for this office covers Central Kentucky and South Central Indiana.") MONTH YEAR January 2011 February 15, 2011 X An X inside this box indicates that no flooding occurred within this hydrologic service area. January 2011 was drier than normal in all locations in the area.
MONTH YEAR January 2011 February 15, 2011 X An X inside this box indicates that no flooding occurred within this hydrologic service area. January 2011 was drier than normal in all locations in the area.
October 2012 Climate Summary
 Ken Scheeringa and Kayla Hudson Nov 8, 2012 (765) 494-8105 http://www.iclimate.org October 2012 Climate Summary Month Summary In a reversal from the hot and dry summer, cooler and wetter than normal conditions
NWS FORM E-5 U.S. DEPARTMENT OF COMMERCE HSA OFFICE:
 NWS FORM E-5 U.S. DEPARTMENT OF COMMERCE HSA OFFICE: NOAA, NATIONAL WEATHER SERVICE MONTHLY REPORT OF RIVER AND FLOOD CONDITIONS DATE: TO: North Webster, IN REPORT FOR (MONTH &YEAR): July 1998 August 5,
April 2011 Climate Summary
 Ken Scheeringa (765) 494-8105 May 9, 2011 http://www.iclimate.org April 2011 Climate Summary Summary After somewhat of a respite in March Indiana weather ramped up with a vengeance in April. Extreme weather
Champaign-Urbana 2001 Annual Weather Summary
 Champaign-Urbana 2001 Annual Weather Summary ILLINOIS STATE WATER SURVEY 2204 Griffith Dr. Champaign, IL 61820 wxobsrvr@sws.uiuc.edu Maria Peters, Weather Observer January: After a cold and snowy December,
November 2010 Climate Summary
 Ken Scheeringa (765) 494-8105 Dec 6, 2010 http://www.iclimate.org November 2010 Climate Summary Summary A four month drought in Indiana is collapsing as significant rain fell the final week of November.
March 2011 Climate Summary
 Ken Scheeringa (765) 494-8105 Apr 5, 2011 http://www.iclimate.org March 2011 Climate Summary Summary The fast paced weather action of February slowed some in March. The major March weather features were
The Pennsylvania Observer
 The Pennsylvania Observer May 31, 2012 May 2012 - Pennsylvania Weather Recap By: Paul Knight The majority of the fifth month had temperatures averaging well above seasonal levels with two distinct hot
NATIONAL WEATHER SERVICE
 NWS Form E-5 (PRES. BY NWS Instruction 10-924) MONTHLY REPORT OF HYDROLOGIC CONDITIONS HYDROLOGIC SERVICE AREA (HSA) NORTHERN INDIANA (IWX) MONTH YEAR TO: Hydrologic Information Center, W/OS31 NOAA s National
INDIANAPOLIS, INDIANA
 The NWS FORM E-5 U.S. DEPARTMENT OF COMMERCE HYDROLOGIC SERVICE AREA: NATIONAL OCEANIC AND ATMOSPHERIC ADMINISTRATION NATIONAL WEATHER SERVICE INDIANAPOLIS, INDIANA REPORT FOR: MONTHLY REPORT OF RIVER
Chapter 3: Weather Fronts & Storms
 Chapter 3: Weather Fronts & Storms An AIR MASS is a large body of air that has similar characteristics (temperature, humidity) throughout. Air masses can be massively large. Air masses are classified by
Crop / Weather Update
 Crop / Weather Update Corn Crop Condition Percent of Acreage Rated Good or Excellent 85 80 75 70 65 60 55 50 45 The U.S. corn crop was rated 69% good-to-excellent on September 23, up 1% from week-ago,
MIAMI-SOUTH FLORIDA National Weather Service Forecast Office
 MIAMI-SOUTH FLORIDA National Weather Service Forecast Office http://www.weather.gov/miami June 2015 South Florida Weather Summary Dry East, Wet West...Drought Remains SE Florida July 3, 2015: Depending
3 Severe Weather. Critical Thinking
 CHAPTER 2 3 Severe Weather SECTION Understanding Weather BEFORE YOU READ After you read this section, you should be able to answer these questions: What are some types of severe weather? How can you stay
National Drought Summary August 14, 2018
 National Drought Summary August 14, 2018 The discussion in the Looking Ahead section is a description of what the official national guidance from the National Weather Service (NWS) National Centers for
Above normal temperatures and precipitation continue across the HSA
 NWS Form E-5 (PRES. BY NWS Instruction 10-924) MONTHLY REPORT OF HYDROLOGIC CONDITIONS HYDROLOGIC SERVICE AREA (HSA) MONTH YEAR TO: Hydrologic Information Center, W/OS31 NOAA s National Weather Service
October 2010 Climate Summary
 Ken Scheeringa (765) 494-8105 Nov 5, 2010 http://www.iclimate.org October 2010 Climate Summary Summary Rain fell on about 10 days in October but did little to slow the drought raging across Indiana. For
KANSAS CLIMATE SUMMARY February 2015
 KANSAS CLIMATE SUMMARY February 2015 Extended Cold Despite some record warm readings at a few locations, February was characterized by colder than normal conditions. This was particularly true during the
Your Task: Read each slide then use the underlined red or underlined information to fill in your organizer.
 Severe Weather: Tornadoes and Hurricanes Thunderstorms and Lightning S6E4 d. Construct an explanation of the relationship between air pressure, weather fronts, and air masses and meteorological events
FLOOD/SCS EVENT, APRIL 28 MAY 4
 REPORT DATE: May 4, 2017 EVENT DATE: April 28-May 4, 2017 FLOOD/SCS EVENT, APRIL 28 MAY 4 Event Summary General Significant Flood Outlook. SOURCE: National Weather Service. A significant severe thunderstorm
One person killed when tornadoes hit Oklahoma, Arkansas (Update) 25 March 2015, byjustin Juozapavicius
 25 March 2015, byjustin Juozapavicius") One person killed when tornadoes hit Oklahoma, Arkansas (Update) 25 March 2015, byjustin Juozapavicius from those. A small tornado swept across parts of Moore, an Oklahoma City suburb where 24 people died
One person killed when tornadoes hit Oklahoma, Arkansas (Update) 25 March 2015, byjustin Juozapavicius from those. A small tornado swept across parts of Moore, an Oklahoma City suburb where 24 people died
The Pennsylvania Observer
 The Pennsylvania Observer September 3, 2008 Summer 2008 Weather Summary Written by: Brian Thompson The opening days of June started dry, but a warm front brought a widespread rain a couple of days into
KANSAS CLIMATE SUMMARY August 2015
 KANSAS CLIMATE SUMMARY August 2015 Cool and Dry August was drier than normal in most of the state. State-wide average precipitation was 2.80 inches or 85 percent of normal. The Northeast division of the
Champaign-Urbana 1999 Annual Weather Summary
 Champaign-Urbana 1999 Annual Weather Summary ILLINOIS STATE WATER SURVEY 2204 Griffith Dr. Champaign, IL 61820 wxobsrvr@sws.uiuc.edu Maria Peters, Weather Observer A major snowstorm kicked off the new
How strong does wind have to be to topple a garbage can?
 How strong does wind have to be to topple a garbage can? Imagine winds powerful enough to pick up a truck and toss it the length of a football field. Winds of this extreme sometimes happen in a tornado.
IC ARTICLE 19. DESCRIBING REAL PROPERTY; INDIANA COORDINATE SYSTEM. IC Chapter 1. Designation of Indiana Coordinate System; Zones
 IC 32-19 ARTICLE 19. DESCRIBING REAL PROPERTY; INDIANA COORDINATE SYSTEM IC 32-19-1 Chapter 1. Designation of Indiana Coordinate System; Zones IC 32-19-1-1 Designation of systems Sec. 1. The systems of
The Weather Wire. Contents: Summer 2018 Outlook. Summer 2018 Outlook Drought Monitor May Summary/Statistics June Preview Rainfall Totals
 The Weather Wire June 2018 Volume 25 Number 6 Contents: Summer 2018 Outlook Drought Monitor May Summary/Statistics June Preview Rainfall Totals Summer 2018 Outlook June 1 st marked the first day of meteorological
DAMAGE SURVEY OF THE BINGER, OKLAHOMA TORNADO OF MAY 22, 1981
 DAMAGE SURVEY OF THE BINGER, OKLAHOMA TORNADO OF MAY 22, 1981 1. INTRODUCTION James R. McDonald, H. Scott Norville, and Timothy P. Marshall Institute for Disaster Research Texas Tech University Lubbock,
WeatherManager Weekly
 Issue 288 July 14, 2016 WeatherManager Weekly Industries We Serve Agriculture Energy/Utilities Construction Transportation Retail Our Weather Protection Products Standard Temperature Products Lowest Daily
Crop / Weather Update
 Crop / Weather Update Corn Crop Condition Percent of Acreage Rated Good or Excellent 85 80 75 70 65 60 55 50 45 As of September 9, USDA rates the crop at 68% good to excellent. The rating is up one point
2018 Year in Review for Central and Southeast Illinois By: Chris Geelhart, Meteorologist National Weather Service, Lincoln IL
 By: Chris Geelhart, Meteorologist National Weather Service, Lincoln IL While 2018 featured some significant out-of-season weather, including below zero temperatures in April and 90-degree highs in early
Table 1. August average temperatures and departures from normal ( F) for selected cities.
 for selected cities.") Climate Summary for Florida August 2016 Prepared by Lydia Stefanova and David Zierden Florida Climate Center, The Florida State University, Tallahassee, Florida Online at: http://climatecenter.fsu.edu/products-services/summaries
Climate Summary for Florida August 2016 Prepared by Lydia Stefanova and David Zierden Florida Climate Center, The Florida State University, Tallahassee, Florida Online at: http://climatecenter.fsu.edu/products-services/summaries
NWS FORM E-5 U.S. DEPARTMENT OF COMMERCE I HYDRO SERVICE AREA NOAA, NATIONAL WEATHER SERVICE I Indianapolis, IN MONTHLY REPORT
 NWS FORM E-5 U.S. DEPARTMENT OF COMMERCE I HYDRO SERVICE AREA NOAA, NATIONAL WEATHER SERVICE I Indianapolis, IN. 1-------------------- MONTHLY REPORT OF RIVER AND FLOOD CONDITIONSI REPORT FOR I November
Kentucky Weather Hazards: What is Your Risk?
 Kentucky Weather Hazards: What is Your Risk? Stuart A. Foster State Climatologist for Kentucky 2010 Kentucky Weather Conference Bowling Green, Kentucky January 16, 2010 Perspectives on Kentucky s Climate
Weather and Climate Summary and Forecast Summer 2017
 Weather and Climate Summary and Forecast Summer 2017 Gregory V. Jones Southern Oregon University August 4, 2017 July largely held true to forecast, although it ended with the start of one of the most extreme
Ch. 3: Weather Patterns
 Ch. 3: Weather Patterns Sect. 1: Air Mass & Fronts Sect. 2: Storms Sect. 3: Predicting the Weather Sect. 4: Weather forecasters use advanced technologies Ch. 3 Weather Fronts and Storms Objective(s) 7.E.1.3
III. Section 3.3 Vertical air motion can cause severe storms
 III. Section 3.3 Vertical air motion can cause severe storms http://www.youtube.com/watch?v=nxwbr60tflg&feature=relmfu A. Thunderstorms form from rising moist air Electrical charges build up near the tops
The Pennsylvania Observer
 The Pennsylvania Observer April 2, 2009 March 2009 Pennsylvania Weather Recap Prepared by Curt Harpster For the month of March the saying, In like a lion and out like a lamb really fit the pattern quite
Flood warnings were issued for the Maumee, St. Marys, Blanchard, St. Joseph (Ohio), Tippecanoe, Tiffin, Eel and Wabash Rivers on the 30 th and 31 st.
, Tippecanoe, Tiffin, Eel and Wabash Rivers on the 30 th and 31 st.") NWS FORM E-5 U.S. DEPARTMENT OF COMMERCE HSA OFFICE: NOAA, NATIONAL WEATHER SERVICE MONTHLY REPORT OF RIVER AND FLOOD CONDITIONS DATE: TO: North Webster, IN REPORT FOR (MONTH &YEAR): January 2002 February
NWS FORM E-5 U.S. DEPARTMENT OF COMMERCE HSA OFFICE: NOAA, NATIONAL WEATHER SERVICE MONTHLY REPORT OF RIVER AND FLOOD CONDITIONS DATE: TO: North Webster, IN REPORT FOR (MONTH &YEAR): January 2002 February
Monthly Long Range Weather Commentary Issued: SEPTEMBER 19, 2015 Steven A. Root, CCM, Chief Analytics Officer, Sr. VP, sales
 Monthly Long Range Weather Commentary Issued: SEPTEMBER 19, 2015 Steven A. Root, CCM, Chief Analytics Officer, Sr. VP, sales sroot@weatherbank.com AUGUST 2015 Climate Highlights The Month in Review The
Severe Weather: Tornadoes and Hurricanes
 Severe Weather: Tornadoes and Hurricanes Tornadoes Grab Toto!! TORNADOES Are a low pressure storm that usually forms over land in an average year, 800 tornadoes are reported in the U.S. a tornado is defined
New Hampshire State Climate Office Dr. Mary D. Stampone, State Climatologist
 New Hampshire State Climate Office Dr. Mary D. Stampone, State Climatologist University of New Hampshire c/o Department of Geography 73 Main Street Durham, NH 03824 Phone: 603-862-3136 Fax: 603-862-4362
Crop / Weather Update
 Crop / Weather Update Corn Crop Condition Percent of Acreage Rated Good or Excellent 85 80 75 70 65 60 55 50 45 Corn condition this week is the same as the last two weeks in the good/excellent category,
W I N T E R STORM HAZARD DESCRIPTION
 W I N T E R STORM HAZARD DESCRIPTION... 1 LOCATION... 2 EXTENT... 2 HISTORICAL OCCURRENCES... 4 SIGNIFICANT PAST EVENTS... 4 PROBABILITY OF FUTURE EVENTS... 5 VULNERABILITY AND IMPACT... 5 HAZARD DESCRIPTION
Arizona Climate Summary September 2014 Summary of conditions for August 2014
 Arizona Climate Summary September 2014 Summary of conditions for August 2014 August 2014 Temperature and Precipitation Summary August 1 st 16 th : The first 5 days of August were quite wet with high pressure