July 2015 Climate Summary
|
|
|
- Eleanore Shepherd
- 5 years ago
- Views:
Transcription

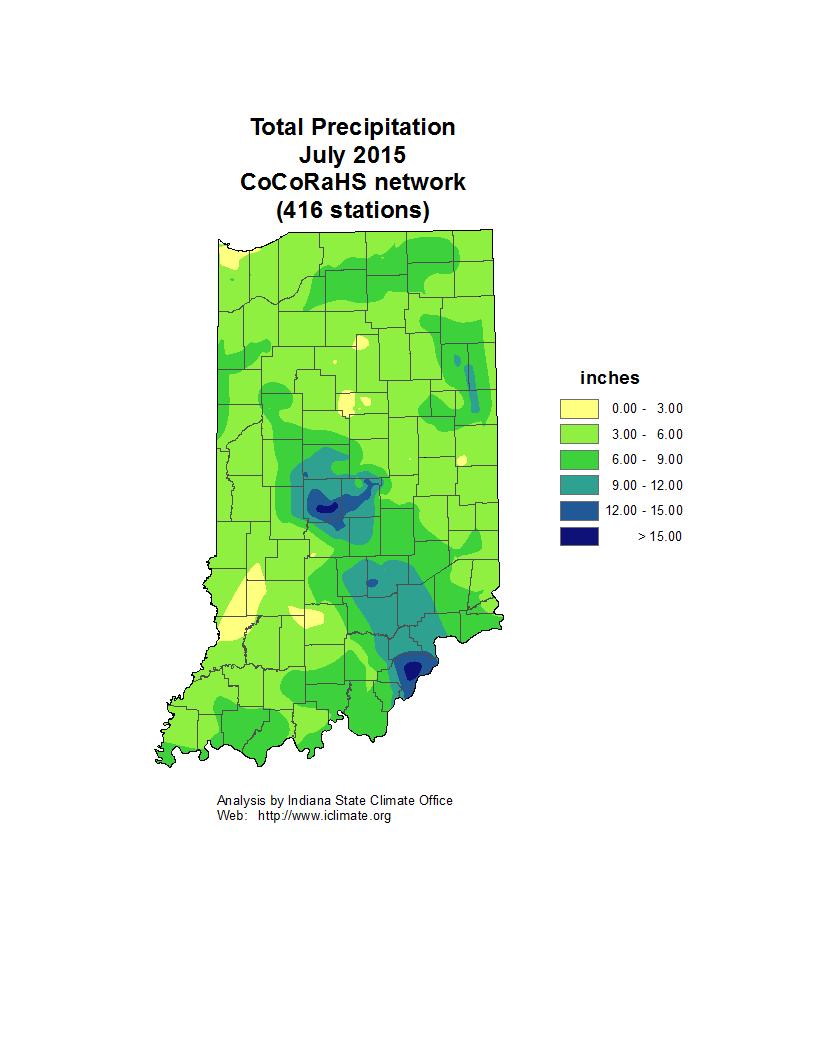
1 Ken Scheeringa And Mary Rose Mangan Aug 6, 2015 (765) July 2015 Climate Summary Month Summary Record setting rainfall in June persisted into the first three weeks of July. For the month the July state average rainfall tallied to 6.04, tied with 1969 as the 7 th wettest July on record. The preliminary combined June and July rainfall total was set at 15.09, the 2 nd wettest June-July period on record in Indiana since The wettest June-July state total was in Flash flooding was a frequent challenge in Indiana during July with dozens of water rescues by boat required. Two men drowned in separate incidents. There were 5 tornadoes on three days: July 12 th, 13 th, and 17 th, reported in Johnson, Warren, Putnam, and Tippecanoe counties. This month was the 3 rd consecutive cool July. The state average temperature for July 2015 was 73.3 F which is 1.3 F below normal. This ties 1961 and 2008 as the 40 th coolest July on record. Some recent cooler Julys were a 72.3 F average in 2013, good for 23 rd coolest. A 71.9 F mean in 2007 falls into 12 th place. The 69.2 F value in 2009 ranks as the 2 nd coolest July. Do you remember? The coldest July on record happened just last year with a chilly 69.1 F state average. The day split in July 2015 was 17 days of below normal temperature, 11 days above normal, and 3 days at normal. There was 1 day with the state average temperature at 10 F or more below normal. The highest temperature of the month in the cooperative observer network was 96 F on July 15 th in Mount Vernon and again on July 29 th at Myers Lock and Dam. The coldest minimum was 50 F on July 8 th in Rockville and again on July 10 th at the Goshen Airport. The July state precipitation average of 6.04 was 1.94 above normal, tying 1969 as the 7 th wettest July on record. A recent wetter July was the 8.18 state average in 2003, perched in the rankings at 2 nd wettest on record. The wettest July on record was the 8.55 mean back in The highest single day precipitation among cooperative stations in July 2015 was 5.05 recorded on July 14 th at North Vernon 2ne. The highest daily total in the CoCoRaHS network was 6.26 measured on July 8 th at Plainfield 1.5nw. The highest monthly total in the cooperative network was as recorded at the Indianapolis Intl Airport. In the CoCoRaHS network the highest monthly total was noted by the volunteer in Charlestown 2.6n. A full CoCoRaHS list can be found at by selecting a date interval of July 1 st 31 st in 2015 for Indiana, then clicking the Total Precip in. column title on the output page to sort the values. Regionally July 2015 precipitation was near 150% of normal in all of northern, central, and southern Indiana. Normal July precipitation ranges from 3.7 in northeast to 4.4 in west central Indiana. Widespread precipitation fell on about 22 days this month.
2 July 1 st 10 th July continued where a very wet June left off. Rain fell somewhere in Indiana on each of the first 10 days of the month. Not only was it wet but the state temperature held cooler than normal throughout the 10 day interval. All 3 cold fronts which crossed the state stalled once they reached the Ohio River. Severe weather has been absent so far in July. A slow cold front stalled in central Indiana on July 1 st. The state temperature opened the month at 4 F below normal. The next day the nearly stationary front drifted slowly south to the Ohio River. The temperature nudged cooler by a degree to 5 F below normal. The front inched south into Kentucky on July 3 rd as it yielded to a high pressure ridge which spread from New York to Wisconsin to Colorado. The ridge crawled south across Indiana on Independence Day, clearing most skies in time for the holiday celebration. The state average temperature had barely moved since the month began, stable at 4 F below normal. High pressure exited east to Pennsylvania on July 5 th. Indiana was sunny across much of the state with pleasant temperatures for a second consecutive day, a delight to rain weary residents. Winds from the south allowed the temperature to rise to 3 F below normal, then to 1 F below normal by July 6 th. Much cooler Canadian air behind a new cold front marched into northern Indiana on July 7 th. Initially the state temperature fell slightly to 4 F below normal. The next day the cold front advanced to the Ohio River rather quickly but waited there as low pressure approached Indiana from the southwest. Meanwhile cold air from Canada continued to filter into the state, lowering the state temperature to 10 F below normal and marking July 8 th as the coldest of the 10 day interval. The southwest storm traveled directly over Indiana the next day. The leading warm front tracked across the state briefly but was followed immediately by the trailing cold front. The state temperature barely noticed, hanging on at 9 F below normal. The weak cold front finally reached the Ohio River on July 10 th and, following the now familiar trend, stalled there. The state temperature was unaffected by the weak cold front but responded to warmer air and precipitation already overrunning the state from the southwest. The July 10 th state temperature rose to 6 F below normal to end the interval. Over the 10 days the state temperature averaged to 5 F below normal. Typically at the start of July daily maximum temperatures should range between 83 F and 89 F north to south across the state. Daily minimums normally vary between 63 F in far northern Indiana to 68 F in the far southwest corner of the state. The warmest daily maximum temperature in the cooperative station network in these 10 days was 89 F at Boonville 1s on July 6 th and at Vincennes 5 ne on July 7 th. The coolest daily minimum in this same network was 50 F at Rockville on July 8 th and at Goshen Airport on July 10 th. Rainfall was moderate to start the month, turned light to dry over the holiday weekend, then heavy near the end of the interval. Regionally over the 10 days amounts averaged near 2.3 in northern Indiana, 2.0 in central counties, and 2.8 across southern Indiana. These totals equate to about 210% of normal in the north, 150% of normal in central, and 200% of normal in southern Indiana. These approximately double normal rates continued the June trend. The heaviest single day rainfall amounts were measured by 3 Plainfield observers in the CoCoRaHS network with reports on the morning of July 8 th at 6.26, 6.08, and The Clayton volunteer had 5.40 while in Avon 5.10 was found in the rain gage. The Plainfield volunteer totals for the 10 days included 7.90,
3 7.07, and At Charlestown 7.90 was tallied while near Rensselaer 5.90 was summed over the 10 days. Continued flooding due to heavy rainfall in June and early July forced the city of Newburgh in Warrick county to cancel its first Independence Day boat parade on the Ohio River. Rainfall on July 7 th entered the record books as the 7 th wettest day ever in over 100 years of Indianapolis history. This heavy rain in July fell on ground saturated by June storms, causing flash flooding in some Indianapolis neighborhoods Residents of more than 20 homes had to be rescued by boat. At least 35 homes there incurred some flood damage. Drivers of vehicles stalled in street flooding had to be rescued as storm drains could not handle the torrential rains. Campers in RV parks were evacuated as well. Shelters were opened as temporary housing to 50 to 60 displaced residents. Roads were closed in adjacent Hamilton county due to heavy flooding. On July 9 th the Indiana Department of Homeland Security (IDHS) requested anyone who sustained water or flood damage since June 7 th to file a report with details of their uninsured losses with the state. These reports were needed to compile damage assessments to determine if application for assistance from FEMA and the Small Business Association should be made. It was expected that some farmers would not make a profit this growing season. In Rensselaer inmates with the work release program were being used to pick up thousands of sand bags which were distributed earlier for flood control. In Carroll county some roads were starting to flood. Farm Service Agency officials began to evaluate local crop losses to determine if individual counties were eligible for a state disaster declaration. A county must show that losses from one crop exceed 30% to be eligible. Flood impact on the public is expected to be an increase in milk prices and a lowered availability of corn to supply local ethanol plants. On the positive side a bumper crop of blueberries was anticipated in areas which were wet but did not flood. Blueberries thrive in wet weather during June and early July. According to the July 6 th edition of the USDA Indiana Crop Bulletin farmers in northern and central Indiana finally got a chance to apply nitrogen to corn and soybeans. The holiday break from nearly continuous rain events allowed a reduction in field ponding. Some much delayed hay cutting and baling was finally possible. Yet the condition of corn and soybeans was rated at less than 50% good or excellent around the state and wheat fields were still too wet to harvest to make room for double crop soybean planting. Unfortunately weeds were growing all too well.
4 July 11 th 17 th The prolonged wet spell which began June 7 th has persisted into mid-july. With the exception of 2 days this week moderate to heavy rain continued across much of Indiana. Cloudy skies and storm systems moving directly overhead limited daily range in the state average temperature, holding within 5 F of normal. Five tornadoes spun up in Indiana on July 12th, 13th, and 17th during four days of severe weather. There were 2 deaths by drowning this week and 3 people injured when trees fell on their vehicles. The state average temperature began at 4 F below normal. High pressure over Ohio on July 11 th helped start a warming trend. The high center moved east and a new storm system settled overhead Indiana the next day. The storm s leading warm front transported warmer air into the southwest quarter of the state nudging the temperature upward to normal. On July 13 th the warm front drifted northward to central Indiana. The state temperature showed little movement, holding near 1 F above normal. Finally the warm front reached Michigan, placing all of Indiana inside the warm sector the next day. Two cold fronts in sequence pounced on Indiana early on July 15 th. The state temperature fell to nearly 4 F below normal and the rain finally subsided. High pressure quickly moved through and beyond Indiana on July 16 th, setting up another return flow of warm air. The next day the state temperature rebounded to 2 F above normal. Another warm front punched through the state that day and brought Indiana inside a strong warm sector. Warmer air rich with moisture rushed into Indiana. Once again the rains returned to close out the week. Overall for the week the state temperature averaged to 1 F below normal. Typically at this point in July the daily maximum temperature should vary between 83 F in far northern counties of Indiana to 89 F in the southwest corner of the state. Daily minimums normally range from 63 F to 68 F north to south across the state. The warmest daily maximum temperature in the cooperative station network this week was 96 F at Mount Vernon on July 15 th. The coolest minimum temperature in this same network was 51 F at Spencer on July 16 th.
5 Moderate to heavy rain fell the first half of the week inside unstable humid air masses. The arrival of cooler temperatures later in the week nearly shut down storms for a few days. The return of warm unstable air at the end of the week brought back storminess and heavy rainfall. Regionally for the week rainfall averaged about 2 across northern Indiana, 2.3 in central sections, and 1.9 in southern Indiana. These amounts equate to about 260% of normal in northern and central Indiana and 210% of normal in the south. The heaviest single day rainfall amounts were found in the morning reports of July 14 th. In the CoCoRaHS network North Vernon measured 5.52 that day while the observer in Hanover collected 4.76 in the gage there. The Columbus volunteer noted 4.68 while in Portland 4.48 was recorded. Over the full week two Jeffersonville gages tallied to 7.30 and Two Columbus observers had 7.06 and Hanover had a 6.01 total. Severe weather ran rampant this week with tornadoes, thunderstorms, flash floods, hail, high wind, and heavy rainfall causing deaths, injuries, and extensive damage to utilities and property throughout Indiana. A daily chronology of major storm impacts follows. July 12 An EF-0 tornado was confirmed in Johnson county. Power lines and more than 100 trees were broken, splintered, and twisted by winds estimated at 85 mph. One of the downed power lines fell into a lake. A tree punctured the roof of a house while another crushed a pickup truck. About 25 homes were damaged and 2 residents had to be evacuated. The Red Cross helped Johnson county officials attend to displaced residents. There were no injuries reported. In Morgan county heavy rains left cars and homes underwater. About a dozen homes were evacuated due to flooding caused by heavy rain. Officials in Mooresville performed boat rescues to extract residents from a few of the flooded homes. Many roads were closed due to high water. The Red Cross distributed cleaning supplies and set up shelters for displaced residents in Mooresville and Nineveh. No injuries were reported. In Hendricks county heavy rainfall caused flooding that shut down highway intersections. Monroe county roads were covered with water and tree limbs were down across the area. In Brown county heavy rains shut down access to some businesses. A corn field was blown down by high winds and several trees were damaged. July 13 The NWS confirmed an EF-0 tornado touched down for about 0.1 mile in Warren county near Pine Village this evening. Winds were estimated at 70 mph. There were no injuries or structural damage with most damage limited to crops. In Putnam county an EF-1 tornado was confirmed northeast of Greencastle. Wind speeds hit 90 mph over a path 0.1 mile long. Trees and power poles fell in the high winds. A Brown county man fell into a creek and drowned behind his home this evening. Officers in Brown and Bartholomew counties had spent a hectic night saving people who had become stranded by rising flood waters in their homes and vehicles.
6 Very large hail fell in extreme northwest Indiana. Hail size in Lake county was reported from 1.75 up to 2.75 in diameter. One inch hail fell in Kosciusko, Marion, Morgan, Boone, and Harrison counties. Hail was somewhat larger in Hendricks county at Wind damage was extensive on this day. A large portion of central and south central Indiana extending along a line from Tippecanoe county to Clark county reported trees down, some on power lines, and others on roads, highways, or signs. Other counties impacted by wind damage outside this central area included Elkhart, Noble, Allen, Jay, Randolph, Fayette, Cass, Ohio, and Knox. In Bartholomew county roads and property were flooded and trees snapped and uprooted. A tree fell on a garage and other fallen trees blocked US31 for a time. Severe weather and 77 mph winds downed power lines causing numerous outages. Utility crews from other parts of Indiana were brought in to help fix the massive damages. The Columbus hospital sustained a punched hole in its roof and several inches of water flooded the first floor. The saturated ground since early June has compounded problems in this area with many neighborhoods experiencing water damage. Two families were rescued from flooding and provided emergency lodging by the Red Cross. One family home suffered lightning damage while a tree fell on another house. Other scattered damages of note included in Tippecanoe county where high winds tore the roof off a concrete plant. A driver was injured in Boone county when a tree fell on his car. There were also damages to signs in that area. In Marion county several trees fell on vehicles, homes were damaged, power lines fell and blocked roads, and streets were flooded. In Brown county power lines were ripped down by trees and flooding was a significant problem. In Jefferson county many trees fell and high winds destroyed a barn there. Trees fell on a state highway in Clark county. There was also some tree damage reported in Montgomery and Clinton counties. Thousands of Jennings county residents had no power and dozens of trees were reported down there. July 14 A Clark county man drowned after flood waters swept away his truck. In Bartholomew county 14 water rescues were made and 1 rescue was needed in Brown county. In Boone county roads were flooded and more trees fell on to roads. In Tippecanoe county some trees fell and damaged homes. In Jackson county water overran I-65 near Seymour for an extended time. Overnight flooding in the Whitley county town of Roanoke left a foot of water in downtown. Residents of side streets had several feet of water in their homes. July 15 In Jay county downtown Portland was underwater for the third time this summer. Several inches of water covered the floors of downtown businesses. US27 was closed for more than a day due to flooding. The severity of the flooding this year is attributed to the intensity and frequency of heavy downpours, leaving the ground so saturated it doesn t have time to dry out. July 17 Two tornadoes touched down in Tippecanoe county. The first tornado occurred late in the afternoon and was rated an EF-1 with winds estimated to 100 mph. The path length was just 0.2
7 mile. There were no reported injuries. The tornado destroyed a garage, tore down power lines, and sheared or downed nearby trees. The second tornado was also classified an EF-1 with winds estimated to 97 mph with a path length of almost 0.3 mile. There were no significant injuries. This tornado collapsed a garage, pulled trees out of the ground and tore siding off a home. Elsewhere in the county winds to 50 mph tore some limbs off trees. Hail 1 in diameter was reported in Randolph and Wayne counties. In Indianapolis a shopping center was shut down and evacuated due to flooding. Several businesses were damaged by flooding. Customers in a grocery store were evacuated when water poured down the aisles. Nearby 5 neighborhood residents were evacuated by boat from their homes. A transformer mounted on a power pole fell to the ground and caught fire after being hit by lightning. The pole and grass were scorched by flames and a house immediately caught fire. Elsewhere in Marion county reports of downed power lines, stranded motorists, and gas leaks were reported to emergency dispatchers. Intense rainfall and high winds caused havoc throughout Indiana. Local roads were not passable in Johnson county. One car was abandoned as a creek overflowed on to a road. Winds to 60 mph snapped and uprooted trees, blocking a road in Hendricks county. In Boone county large branches fell across roadways, power lines came down, and water ponded due to intense rainfall. In Decatur county a tree fell on a pickup truck, injuring 2 people. Other fallen trees blocked roadways. In Ripley county intense rainfall caused standing water on a state highway. Trees blown over by high winds blocked roads there as well. In Jefferson county trees snagged power lines while a roof suffered shingle damage. Large limbs and trees fell in Clark and Floyd counties. State government requested that Indiana residents who sustained uninsured property damage report that damage to the state website. These reports would be used to help IDHS make preliminary damage assessments and determine if federal assistance should be sought. The July 20 th edition of the USDA Indiana Crop Bulletin remained dismal about farming conditions given the continued frequent heavy rainfall. According to the report only a few mid-week days were suitable to work fields. The bulletin noted farmers continue to be challenged to combine wheat, cut and bale hay, and plant double crop soybeans. Harvested wheat has been of low quality with disease that often causes rejection at local elevators. Corn growth is extremely variable with early planted corn still doing the best. About half the corn crop has reached the silk stage. Less than half the corn and soybean crops were rated in good to excellent condition. Despite muddy feedlots livestock were still in good condition.
8 July 18 th 24 th A final day of severe weather on July 18 th marked a welcome end to tornadoes, hail, wind damage, heavy rain, and flooding in Indiana at least for a while. A cooling trend most of this week concluded with a few days of warming. A break in the nearly every-day rain pattern arrived in the second half of the week. The week began warm with the state temperature at 4 F above normal. Indiana was positioned inside a strong warm and humid air mass sector. A cold front approached from the north the next day as the temperature slid a tad to 3 F above normal. The cold front trekked through Indiana on July 20 th but stalled at the Ohio River, a typical resting place of cold fronts moving through the state this summer. The state temperature fell to normal. A stronger second cold front raced south through Indiana the next day and caught up to the stationary front parked at the Ohio River. Cooler air slowly infiltrated the state as the temperature edged down a bit to 1 F below normal. High pressure from Canada arrived in Indiana and forced the merged fronts far south of the state on July 22 nd, bringing sunny skies and pleasant temperatures. This was the coolest day of the week with the state temperature falling to 5 F below normal. The ridge of high pressure expanded into neighboring states through July 24 th, keeping Indiana mostly sunny with a slight warming trend. The week ended with the state temperature at 1 F below normal. Overall for the week the state temperature averaged to 1 F below normal. Usually in the third week of July the daily maximum temperature should range between 83 F and 88 F north to south across the state. The daily minimum normally varies from 63 F in far northern Indiana to 68 F in the far southwest corner of the state. The warmest daily maximum temperature this week in the cooperative station network was 96 F at Terre Haute on July 20 th. The coolest daily minimum in this same network was 52 F at New Castle 4sse on July 23 rd. As temperatures cooled early in the week rain kept falling. The arrival of high pressure near the end of the week largely shut down rain events after July 21 st. Regionally for the week about 1.1 was recorded across northern Indiana, 1.3 in central areas, and 0.8 in the south. These amounts equate to normal in the north, about 110% of normal in central, and 90% of normal in southern Indiana.
9 The highest local rainfall amounts came at the start of the week during the last severe weather day on July 18 th. Among the heavier CoCoRaHS reports were 4.43 and 4.13 measured by two observers near Greenwood, 3.91 recorded at Speedway, 3.78 observed in Clayton, and 3.76 noted at Plainfield, all in central Indiana. This area also had the highest weekly rain totals with 4.70 and 4.60 at the Greenwood locations, 4.60 in Brooklyn, 4.34 at Clayton, and 4.30 in Plainfield. High winds caused damage in a handful of northern Indiana counties on July 18 th. In Elkhart county 60 mph winds toppled trees which then snagged power lines and cut off power. Some trees may have been struck by lightning. Four animal shelters were destroyed in the storm. In St Joseph county a tree took down a power line and in Marshall county trees were uprooted and fell on to a house. Trees fell on roadways in Laporte, Huntington, and Blackford counties. In Porter county more trees were snapped in high wind gusts. The afternoon storm left thousands of residents without power in Porter and Laporte counties. Police reported smoldering trees where live wires were dangling. In Laporte county traffic signals were out and tree limbs were on the ground. One lane of I-94 was closed that evening due to flooding caused by the intense rainfall. On July 20 th residents of 4 lake homes in Noble county voluntarily evacuated as lake water surrounded their homes. Lake levels had risen this summer with each heavy rain storm that moved through that area. In some cases this caused the home sewer system to shut down. The Red Cross provided shelter for displaced residents. On July 23 rd the city of Muncie notified the public there were higher levels of sewage in the White River than usual. The water treatment plant had been adding more chemicals to the river water since Muncie relies on the White River as its source of drinking water. Some of the recent heavy rainfall was combined with city sewage which was discharged into the river. This is a last resort practice in urban areas when rainfall rates exceed the design capacity of the sewage system. The July 27 th edition of the USDA Indiana crop bulletin rejoiced that sunshine had returned this week. Saturated fields were finally getting a chance to dry out. Surveyed farmers rated a little less than half of soils as surplus in moisture. Farmers were able to spray for weeds, cut and bale hay, and finish the wheat harvest. Yet recently harvested wheat was often of poor quality and was being used for livestock feed. The report said that corn was tasseling but short in height, with variable growth and variable response to nitrogen. Soybeans were also growing slower than normal. About two-thirds of the corn has now silked.
10 July 25 th 31 st The final week of July was warm with normal to above normal temperatures on all 7 days. Moderate rain fell on several days when a nearly stationary front dallied within Indiana. Locally heavy rainfall in the center of the state on the evening of July 26 th provoked flash flooding which led to numerous water rescues. There were no severe weather days this week. Indiana was boxed in on 3 sides by fronts on July 25 th. The next day the cold front began moving across the state but didn t get very far, stalling in northern Indiana. This stationary front would trail south across Indiana over 4 days, drifting to central Indiana on July 27 th, then to southern Indiana a day later until dissolving altogether on July 29 th. As the front slid south day by day the daily state average temperature edged higher as warmer air mixed in: to 2 F above normal on July 26 th, then 4 F above the next day before topping out at 6 F above normal on July 28 th and 29 th. A stronger cold front pushed through Indiana on July 30 th, cooling the state temperature a few degrees to 2 F above normal. A high pressure ridge from the Rockies took control of the state on July 31 st, ending days of moderate rainfall while the state temperature held at 2 F above normal to wrap up the month. Overall for this last week of July the daily state temperature averaged to 3 F above normal. Typically at this time of year the daily maximum temperature should range between 82 F in far northern counties to 88 F in the southwest corner of the state. Daily minimums should vary between 63 F and 67 F north to south across the state. The warmest daily maximum temperature in the cooperative observer network this week was 96 F at Myers Lock and Dam on July 29 th. The coolest daily minimum in this same network was 57 F at New Castle 4sse on July 25 th. Moderate rainfall was reported on all but the first and last days of the week. Regional totals were about 0.2 across northern Indiana, 0.9 in central sections, and 0.7 in the south. These amounts equate to about 25% of normal in the north, 75% of normal in southern Indiana, and right about normal in the central third of the state. Rainfall was intense in the center of Indiana on the evening of July 26 th as the first cold front slowed and morphed into the multi-day stationary front. Among the heaviest rainfall amounts in the morning reports on July 27 th in the CoCoRaHS network were
11 5.15 at Lawrence, 5.04 about 10 miles northeast of Indianapolis, 4.21 at Castleton, and two reports of 3.97 and 3.56 about 3 miles east of Indianapolis. The heaviest weekly totals were also near central Indiana with 5.18 in Lawrence, 4.21 at Castleton, 2.87 near Lebanon, and 2.79 near New Ross. Heavy rainfall triggered flash flooding yet again in central Indiana on July 26 th. The flooding swamped city streets and roads. One lane of I-65 was forced to close due to high water during the deluge. Fire departments in the Indianapolis area responded with 23 water rescues in less than 3 hours. None of the calls were deemed to be life threatening emergencies. When the official rainfall amount for Indianapolis was tallied at the end of the day the July total so far had reached 13.13, the most for any month in records going back to Yet July still had a few remaining days on the calendar. Residents marveled at the repeated flooding events that have occurred just within the past 3 weeks. The USDA Farm Service Agency and Indiana state government tallied farmland damages due to the summer rainfall at the end of July. Indiana sent a request to the USDA secretary to declare 53 counties eligible for federal emergency loan assistance. A county will meet the declaration requirement if it can show at least 30% loss to any one crop in the county. An amended request to include more counties is possible if more damages are documented after the July 31 st assessment. State government was encouraging farmers to continue providing crop damage reports to their county FSA if not already submitted. The August 3 rd edition of the USDA Indiana crop bulletin displayed surprise that a few Indiana farms on sandy soils had turned on irrigation systems. The report noted that some sandy fields were actually showing some dryness already. The weekly Indiana farmer soil moisture survey rated 9% of topsoils and 5% of subsoils in short or very short moisture status this week while about 25% continued with a soil water surplus. The report indicated crops had improved in recent days but root systems remained poor due to long term wet soils. Soybeans were only showing a few pods while corn had generally silked but some corn was suffering from nitrogen deficiency. More than half of Indiana corn and soybean plants were rated in fair to poor condition. Nearly all wheat had been harvested but yields were low and discounted for disease at local elevators. Hay cutting had been long delayed in many areas but this week cutting and baling were finally underway.
12 July 2015 Temperature Region Temperature Normal Deviation Northwest North Central Northeast West Central Central East Central Southwest South Central Southeast State Precipitation Region Precipitation Normal Deviation Percent of Normal Northwest North Central Northeast West Central Central East Central Southwest South Central Southeast State
13 Summer so far (June - July) Temperature Region Temperature Normal Deviation Northwest North Central Northeast West Central Central East Central Southwest South Central Southeast State Precipitation Region Precipitation Normal Deviation Percent of Normal Northwest North Central Northeast West Central Central East Central Southwest South Central Southeast State
14 2015 Annual (through July) Temperature Region Temperature Normal Deviation Northwest North Central Northeast West Central Central East Central Southwest South Central Southeast State Precipitation Region Precipitation Normal Deviation Percent of Normal Northwest North Central Northeast West Central Central East Central Southwest South Central Southeast State
15

16
17

18 Drought Summary from the U.S. Drought Monitor Below is a drought summary for the state of Indiana from the U.S. Drought Monitor. Areas in white are not experiencing any drought. Yellow areas are abnormally dry, but not considered a drought. Drought begins when the moisture levels become more severe, with beige, orange, red, and brown indicating increasing levels of drought (moderate, severe, extreme, and exceptional, respectively). The table below indicates what percentage of the state is drought free, and how much of the state is in drought by degree of severity (D1 - D4 category).
19 July 7 th Drought Summary
20 July 14 th Drought Summary
21 July 21 st Drought Summary
22 July 28 th Drought Summary
August 2006 Summary. August 1-5
 Ashley Brooks (765) 494-6574 Sep 8, 2006 http://www.iclimate.org August 1-5 August 2006 Summary The heat wave that started during the end of July continued into the beginning parts of August with temperatures
July 2007 Climate Summary
 Dan Bowman (765) 494-6574 Sep 3, 2007 http://www.iclimate.org Summary July 2007 Climate Summary The month of July ended as a very unusual month. Many events occurred during the month of July that is not
October 2011 Climate Summary
 Ken Scheeringa and Kayla Hudson Nov 4, 2011 http://www.iclimate.org October 2011 Climate Summary Month Summary October weather evolved as a two part story. Weather conditions the first half of the month
August 2017 Climate Summary
 Ken Scheeringa And Andy Eggert Sep 7, 2017 (765) 494-8105 http://www.iclimate.org August 2017 Climate Summary Month Summary The coolest August in 13 years featured long cool and warm spells, below normal
August 2015 Climate Summary
 Ken Scheeringa And Mary Rose Mangan Sep 4, 2015 (765) 494-8105 http://www.iclimate.org August 2015 Climate Summary Month Summary A very active wet summer weather pattern turned much calmer and drier in
September 2005 Climate Summary
 Ashley Brooks (765) 494-6574 Oct 5, 2005 http://iclimate.org September 2005 Climate Summary September 1-7 A cold front came through on the 1 st of the month, however little moisture was associated with
August 2013 Climate Summary
 Ken Scheeringa and Matt Price Sep 6, 2013 (765) 494-8105 http://www.iclimate.org August 2013 Climate Summary Month Summary August weather began cool and wet but became progressively warmer and drier through
June 2011 Climate Summary
 Ken Scheeringa (765) 494-8105 Jul 8, 2011 http://www.iclimate.org June 2011 Climate Summary Month Summary The abundance of extreme weather this year extended yet another month into June. This month has
May 2015 Climate Summary
 Ken Scheeringa And Mary Rose Mangan Jun 8, 2015 (765) 494-8105 http://www.iclimate.org May 2015 Climate Summary Month Summary May was a very warm month. Rainfall averaged near normal but was distributed
June 2010 Climate Summary
 Ken Scheeringa (765) 494-8105 Jul 6, 2010 http://www.iclimate.org June 2010 Climate Summary Summary Summer like heat and humidity arrived in Indiana on May 22 nd and dominated our weather scene nearly
September 2012 Climate Summary
 Ken Scheeringa and Kayla Hudson Oct 5, 2012 (765) 494-8105 http://www.iclimate.org September 2012 Climate Summary Month Summary Summer slipped away and it felt a lot more like autumn in Indiana this month
June 2015 Climate Summary
 Ken Scheeringa And Mary Rose Mangan Jul 10, 2015 (765) 494-8105 http://www.iclimate.org June 2015 Climate Summary Month Summary Indiana set a new June rainfall record this month with a state average 8.99.
May 2016 Climate Summary
 Ken Scheeringa And Andy Eggert Jun 6, 2016 (765) 494-8105 http://www.iclimate.org May 2016 Climate Summary Month Summary Cold weather dominated in May until the last week of the month. May began wet but
November 2012 Climate Summary
 Ken Scheeringa and Kayla Hudson Dec 6, 2012 (765) 494-8105 http://www.iclimate.org November 2012 Climate Summary Month Summary November was one of those rare weather months in Indiana when not much happened:
January 2006 Climate Summary
 Ashley Brooks (765) 494-6574 Feb 9, 2006 http://www.iclimate.org January 1-3 January 2006 Climate Summary Unseasonably warm conditions welcomed in the New Year with highs in the 40s across the northern
May 2018 Climate Summary
 Ken Scheeringa and Andy Eggert Jun 7, 2018 (765) 494-8105 http://www.iclimate.org May 2018 Climate Summary Month Summary As the calendar turned from April to May temperatures flipped dramatically away
June 2016 Climate Summary
 Ken Scheeringa And Andy Eggert Jul 8, 2016 (765) 494-8105 http://www.iclimate.org June 2016 Climate Summary Month Summary June was a warm month with below normal temperature on just 6 days. Rainfall was
December 2011 Climate Summary
 Ken Scheeringa and Kayla Hudson Jan 17, 2012 (765) 494-8105 http://www.iclimate.org December 2011 Climate Summary Month Summary What a difference a year makes! A year ago the misery of a harsh, cold, and
September 2011 Climate Summary
 Ken Scheeringa and Kayla Hudson Oct 5, 2011 (765) 494-8105 http://www.iclimate.org September 2011 Climate Summary Month Summary The final blast of summer heat arrived at the start of September. It lasted
January 2008 Climate Summary
 Joseph Mays (765) 494-6574 Feb 5, 2008 http://www.iclimate.org Summary January 2008 Climate Summary January was a mix bag of conditions, with an oscillatory pattern developing. We experienced phases of
SIGNIFICANT EVENTS Severe Storms November 1994 January 1996 August 1998 and May 2000 March 2002 May 2002 Champaign County
 SIGNIFICANT EVENTS Severe Storms November 1994 On Nov. 1, 1994, high winds gusted over 60 mph at times across the northwest third of Ohio. The highest measured wind gust was 63 mph at Columbus Grove (Putnam).
March 2014 Climate Summary
 Ken Scheeringa And Matt Price Apr 8, 2014 (765) 494-8105 http://www.iclimate.org March 2014 Climate Summary Month Summary Winter had officially ended by the calendar but snow and cold persisted in Indiana
July 2010 Climate Summary
 Ken Scheeringa (765) 494-8105 Aug 4, 2010 http://www.iclimate.org July 2010 Climate Summary Summary The warm summer of 2010 continues. Daily state average temperatures were above normal on all but seven
March 2016 Climate Summary
 Ken Scheeringa And Andy Eggert Apr 8, 2016 (765) 494-8105 http://www.iclimate.org March 2016 Climate Summary Month Summary Count March as the 7 th month in a row that the state average temperature has
March 2009 Climate Summary
 Joseph Mays (765) 494-6574 Apr 1, 2009 http://www.iclimate.org Summary March 2009 Climate Summary March is in the books and it continued the trend of extreme weather we have experienced during the first
August 2016 Climate Summary
 Ken Scheeringa And Andy Eggert Sep 12, 2016 (765) 494-8105 http://www.iclimate.org August 2016 Climate Summary Month Summary Hot but tranquil weather the first half of August transitioned to a tormented
April 2013 Climate Summary
 Ken Scheeringa and Kayla Hudson May 6, 2013 (765) 494-8105 http://www.iclimate.org April 2013 Climate Summary Month Summary Temperatures bounced high and low this month, keeping Hoosiers guessing which
April 2016 Climate Summary
 Ken Scheeringa And Andy Eggert May 9, 2016 (765) 494-8105 http://www.iclimate.org April 2016 Climate Summary Month Summary One month but two seasons. The first half of April was cold with snow. Wind damage
January 2017 Climate Summary
 Ken Scheeringa And Andy Eggert Feb 8, 2017 (765) 494-8105 http://www.iclimate.org January 2017 Climate Summary Month Summary The warmest January in 11 years was nearly 4 F warmer than December 2016. An
2011 Year in Review TORNADOES
 2011 Year in Review The year 2011 had weather events that will be remembered for a long time. Two significant tornado outbreaks in April, widespread damage and power outages from Hurricane Irene in August
January 2012 Climate Summary
 Ken Scheeringa and Kayla Hudson Feb 6, 2012 (765) 494-8105 http://www.iclimate.org January 2012 Climate Summary Month Summary Where is winter? This question found its way into many conversations throughout
The hydrologic service area (HSA) for this office covers Central Kentucky and South Central Indiana.
 for this office covers Central Kentucky and South Central Indiana.") January 2012 February 13, 2012 An X inside this box indicates that no flooding occurred within this hydrologic service area. January 2012 continued the string of wet months this winter. Rainfall was generally
January 2012 February 13, 2012 An X inside this box indicates that no flooding occurred within this hydrologic service area. January 2012 continued the string of wet months this winter. Rainfall was generally
May 2005 Climate Summary
 Ashley Brooks (765) 494-6574 Jun 7, 2005 http://iclimate.org May 2005 Climate Summary May 1-5 Early May was characterized by an upper-level trough that was in place over Indiana that brought in very cool
September 2016 Climate Summary
 Ken Scheeringa And Andy Eggert Oct 6, 2016 (765) 494-8105 http://www.iclimate.org September 2016 Climate Summary Month Summary The warmest September in 77 years brought alternating weeks of dry and wet
July 2011 Climate Summary
 Ken Scheeringa (765) 494-8105 Aug 8, 2011 http://www.iclimate.org July 2011 Climate Summary Month Summary The upper atmospheric high pressure dome which baked the Texas area in heat and drought the past
November 2017 Climate Summary
 Ken Scheeringa and Andy Eggert Dec 8, 2017 (765) 494-8105 http://www.iclimate.org November 2017 Climate Summary Month Summary November temperatures alternated spells of warm and cool while precipitation
January 2013 Climate Summary
 Ken Scheeringa and Kayla Hudson Feb 7, 2013 (765) 494-8105 http://www.iclimate.org January 2013 Climate Summary Month Summary Winter or spring? January featured several dramatic swings in temperature and
April 2015 Climate Summary
 Ken Scheeringa And Mary Rose Mangan May 8, 2015 http://www iclimate org April 2015 Climate Summary Month Summary April was a month of extremes. Severe weather erupted on 4 days of the first week with multiple
2012 Growing Season Weather Summary for North Dakota. Adnan Akyüz and Barbara A. Mullins Department of Soil Science October 30, 2012
 2012 Growing Season Weather Summary for North Dakota Adnan Akyüz and Barbara A. Mullins Department of Soil Science October 30, 2012 Introduction The 2012 growing season (the period from April through September)
October 2017 Climate Summary
 Ken Scheeringa and Andy Eggert Nov 6, 2017 (765) 494-8105 http://www.iclimate.org October 2017 Climate Summary Month Summary After more than three weeks of warm temperatures October turned suddenly cold
October 2012 Climate Summary
 Ken Scheeringa and Kayla Hudson Nov 8, 2012 (765) 494-8105 http://www.iclimate.org October 2012 Climate Summary Month Summary In a reversal from the hot and dry summer, cooler and wetter than normal conditions
November 2010 Climate Summary
 Ken Scheeringa (765) 494-8105 Dec 6, 2010 http://www.iclimate.org November 2010 Climate Summary Summary A four month drought in Indiana is collapsing as significant rain fell the final week of November.
November 2014 Climate Summary
 Ken Scheeringa And Matt Price Dec 10, 2014 (765) 494-8105 http://www.iclimate.org November 2014 Climate Summary Month Summary Unseasonable cold headlined the Indiana and national news in November. The
November 2015 Climate Summary
 Ken Scheeringa And Mary Rose Mangan Dec 8, 2015 (765) 494-8105 http://www.iclimate.org November 2015 Climate Summary Month Summary November was much warmer than normal while precipitation was very near
April 2017 Climate Summary
 Ken Scheeringa And Andy Eggert May 8, 2017 (765) 494-8105 http://www.iclimate.org April 2017 Climate Summary Month Summary April was a very warm and wet month in Indiana, nearly setting a new monthly temperature
The Pennsylvania Observer
 The Pennsylvania Observer August 3, 2015 July 2015 - Pennsylvania Weather Recap By: Arthur Person Although this seventh month of 2015 was fairly normal across Pennsylvania as a whole, the details reveal
April 2011 Climate Summary
 Ken Scheeringa (765) 494-8105 May 9, 2011 http://www.iclimate.org April 2011 Climate Summary Summary After somewhat of a respite in March Indiana weather ramped up with a vengeance in April. Extreme weather
February 2017 Climate Summary
 Ken Scheeringa And Andy Eggert Mar 9, 2017 (765) 494-8105 http://www.iclimate.org February 2017 Climate Summary Month Summary February 2017 was the warmest February in Indiana since state climate records
March 2011 Climate Summary
 Ken Scheeringa (765) 494-8105 Apr 5, 2011 http://www.iclimate.org March 2011 Climate Summary Summary The fast paced weather action of February slowed some in March. The major March weather features were
October 2014 Climate Summary
 Ken Scheeringa And Matt Price Nov 10, 2014 (765) 494-8105 http://www.iclimate.org October 2014 Climate Summary Month Summary October featured a mix of weather. A very wet first half of the month evolved
NATIONAL WEATHER SERVICE
 January 2016 February 9, 2016 This was a dry month across the HSA despite one large and several smaller snowfalls. Most locations ended up 1-2 inches below normal for the month. The driest locations at
March 2018 Climate Summary
 Ken Scheeringa and Andy Eggert Apr 5, 2018 (765) 494-8105 http://www.iclimate.org March 2018 Climate Summary Month Summary March turned cold with below normal temperatures on two-thirds of its days. Along
Champaign-Urbana 2001 Annual Weather Summary
 Champaign-Urbana 2001 Annual Weather Summary ILLINOIS STATE WATER SURVEY 2204 Griffith Dr. Champaign, IL 61820 wxobsrvr@sws.uiuc.edu Maria Peters, Weather Observer January: After a cold and snowy December,
KANSAS CLIMATE SUMMARY August 2015
 KANSAS CLIMATE SUMMARY August 2015 Cool and Dry August was drier than normal in most of the state. State-wide average precipitation was 2.80 inches or 85 percent of normal. The Northeast division of the
The hydrologic service area (HSA) for this office covers Central Kentucky and South Central Indiana.
 for this office covers Central Kentucky and South Central Indiana.") MONTH YEAR January 2011 February 15, 2011 X An X inside this box indicates that no flooding occurred within this hydrologic service area. January 2011 was drier than normal in all locations in the area.
MONTH YEAR January 2011 February 15, 2011 X An X inside this box indicates that no flooding occurred within this hydrologic service area. January 2011 was drier than normal in all locations in the area.
November 2016 Climate Summary
 Ken Scheeringa And Andy Eggert Dec 15, 2016 (765) 494-8105 http://www.iclimate.org November 2016 Climate Summary Month Summary Unseasonably warm, pleasant, and sunny weather the first half of the month
Above normal temperatures and precipitation continue across the HSA
 NWS Form E-5 (PRES. BY NWS Instruction 10-924) MONTHLY REPORT OF HYDROLOGIC CONDITIONS HYDROLOGIC SERVICE AREA (HSA) MONTH YEAR TO: Hydrologic Information Center, W/OS31 NOAA s National Weather Service
July 2014 Climate Summary
 Ken Scheeringa And Matt Price Aug 8, 2014 (765) 494-8105 http://www.iclimate.org July 2014 Climate Summary Month Summary July was unseasonably cool and drier than normal. Rainfall was light in parts of
New Hampshire State Climate Office Dr. Mary D. Stampone, State Climatologist
 New Hampshire State Climate Office Dr. Mary D. Stampone, State Climatologist University of New Hampshire c/o Department of Geography 73 Main Street Durham, NH 03824 Phone: 603-862-3136 Fax: 603-862-4362
October 2016 Climate Summary
 Ken Scheeringa And Andy Eggert Nov 9, 2016 (765) 494-8105 http://www.iclimate.org October 2016 Climate Summary Month Summary October was the 9 th month so far this year to average above normal in temperature.
Table 1. August average temperatures and departures from normal ( F) for selected cities.
 for selected cities.") Climate Summary for Florida August 2016 Prepared by Lydia Stefanova and David Zierden Florida Climate Center, The Florida State University, Tallahassee, Florida Online at: http://climatecenter.fsu.edu/products-services/summaries
Climate Summary for Florida August 2016 Prepared by Lydia Stefanova and David Zierden Florida Climate Center, The Florida State University, Tallahassee, Florida Online at: http://climatecenter.fsu.edu/products-services/summaries
The Pennsylvania Observer
 The Pennsylvania Observer October 1, 2015 September 2015 - Pennsylvania Weather Recap By: Quinn Lease The month of September will be remembered for its above normal temperatures and dry conditions that
Monthly Long Range Weather Commentary Issued: May 15, 2014 Steven A. Root, CCM, President/CEO
 Monthly Long Range Weather Commentary Issued: May 15, 2014 Steven A. Root, CCM, President/CEO sroot@weatherbank.com APRIL 2014 REVIEW Climate Highlights The Month in Review The average temperature for
The Weather Wire. Contents: Summer 2018 Outlook. Summer 2018 Outlook Drought Monitor May Summary/Statistics June Preview Rainfall Totals
 The Weather Wire June 2018 Volume 25 Number 6 Contents: Summer 2018 Outlook Drought Monitor May Summary/Statistics June Preview Rainfall Totals Summer 2018 Outlook June 1 st marked the first day of meteorological
Champaign-Urbana 1998 Annual Weather Summary
 Champaign-Urbana 1998 Annual Weather Summary ILLINOIS STATE WATER SURVEY Audrey Bryan, Weather Observer 2204 Griffith Dr. Champaign, IL 61820 wxobsrvr@sparc.sws.uiuc.edu The development of the El Nìno
Flood Scenario Worksheet
 Flood Scenario Worksheet Scenario adapted from: http://www.epa.gov/watersecurity/tools/trainingcd/simple/source/scenario-8/ssc8-0.pdf Simple Tabletop Exercise, Interdependency Natural Disaster Scenario,
National Wildland Significant Fire Potential Outlook
 National Wildland Significant Fire Potential Outlook National Interagency Fire Center Predictive Services Issued: September, 2007 Wildland Fire Outlook September through December 2007 Significant fire
WeatherManager Weekly
 Issue 288 July 14, 2016 WeatherManager Weekly Industries We Serve Agriculture Energy/Utilities Construction Transportation Retail Our Weather Protection Products Standard Temperature Products Lowest Daily
INDIANAPOLIS, INDIANA
 The NWS FORM E-5 U.S. DEPARTMENT OF COMMERCE HYDROLOGIC SERVICE AREA: NATIONAL OCEANIC AND ATMOSPHERIC ADMINISTRATION NATIONAL WEATHER SERVICE INDIANAPOLIS, INDIANA REPORT FOR: MONTHLY REPORT OF RIVER
MIAMI-SOUTH FLORIDA National Weather Service Forecast Office
 MIAMI-SOUTH FLORIDA National Weather Service Forecast Office http://www.weather.gov/miami June 2015 South Florida Weather Summary Dry East, Wet West...Drought Remains SE Florida July 3, 2015: Depending
NATIONAL WEATHER SERVICE
 NWS Form E-5 (PRES. BY NWS Instruction 10-924) MONTHLY REPORT OF HYDROLOGIC CONDITIONS HYDROLOGIC SERVICE AREA (HSA) NORTHERN INDIANA (IWX) MONTH YEAR TO: Hydrologic Information Center, W/OS31 NOAA s National
October 2010 Climate Summary
 Ken Scheeringa (765) 494-8105 Nov 5, 2010 http://www.iclimate.org October 2010 Climate Summary Summary Rain fell on about 10 days in October but did little to slow the drought raging across Indiana. For
Arizona Climate Summary September 2014 Summary of conditions for August 2014
 Arizona Climate Summary September 2014 Summary of conditions for August 2014 August 2014 Temperature and Precipitation Summary August 1 st 16 th : The first 5 days of August were quite wet with high pressure
The Pennsylvania Observer
 The Pennsylvania Observer April 2, 2009 March 2009 Pennsylvania Weather Recap Prepared by Curt Harpster For the month of March the saying, In like a lion and out like a lamb really fit the pattern quite
IC ARTICLE 19. DESCRIBING REAL PROPERTY; INDIANA COORDINATE SYSTEM. IC Chapter 1. Designation of Indiana Coordinate System; Zones
 IC 32-19 ARTICLE 19. DESCRIBING REAL PROPERTY; INDIANA COORDINATE SYSTEM IC 32-19-1 Chapter 1. Designation of Indiana Coordinate System; Zones IC 32-19-1-1 Designation of systems Sec. 1. The systems of
February 2016 Climate Summary
 Ken Scheeringa And Andy Eggert Mar 9, 2016 (765) 494-8105 http://www.iclimate.org February 2016 Climate Summary Month Summary February was the 6 th consecutive month with an above normal state average
NWS FORM E-5 U.S. DEPARTMENT OF COMMERCE I HYDRO SERVICE AREA NOAA, NATIONAL WEATHER SERVICE I Indianapolis, IN MONTHLY REPORT
 NWS FORM E-5 U.S. DEPARTMENT OF COMMERCE I HYDRO SERVICE AREA NOAA, NATIONAL WEATHER SERVICE I Indianapolis, IN. 1-------------------- MONTHLY REPORT OF RIVER AND FLOOD CONDITIONSI REPORT FOR I November
Unit 4. This unit will enable you to improve coordination and communication with State and local agencies when hazardous weather threatens.
 Unit 4 This unit will enable you to improve coordination and communication with State and local agencies when hazardous weather threatens. In this unit we will discuss the role of Emergency Managers in
2018 Year in Review for Central and Southeast Illinois By: Chris Geelhart, Meteorologist National Weather Service, Lincoln IL
 By: Chris Geelhart, Meteorologist National Weather Service, Lincoln IL While 2018 featured some significant out-of-season weather, including below zero temperatures in April and 90-degree highs in early
Nebraska experienced a wide
 Issue 1 August 2016 CLIMATE UPDATE A MONTHLY SUMMARY FROM THE neclimate.unl.edu August saw reprieve from dryness, cooler temps Overview Nebraska experienced a wide range of conditions across the state
Champaign-Urbana 1999 Annual Weather Summary
 Champaign-Urbana 1999 Annual Weather Summary ILLINOIS STATE WATER SURVEY 2204 Griffith Dr. Champaign, IL 61820 wxobsrvr@sws.uiuc.edu Maria Peters, Weather Observer A major snowstorm kicked off the new
Flood warnings were issued for the Maumee, St. Marys, Blanchard, St. Joseph (Ohio), Tippecanoe, Tiffin, Eel and Wabash Rivers on the 30 th and 31 st.
, Tippecanoe, Tiffin, Eel and Wabash Rivers on the 30 th and 31 st.") NWS FORM E-5 U.S. DEPARTMENT OF COMMERCE HSA OFFICE: NOAA, NATIONAL WEATHER SERVICE MONTHLY REPORT OF RIVER AND FLOOD CONDITIONS DATE: TO: North Webster, IN REPORT FOR (MONTH &YEAR): January 2002 February
NWS FORM E-5 U.S. DEPARTMENT OF COMMERCE HSA OFFICE: NOAA, NATIONAL WEATHER SERVICE MONTHLY REPORT OF RIVER AND FLOOD CONDITIONS DATE: TO: North Webster, IN REPORT FOR (MONTH &YEAR): January 2002 February
X An X inside this box indicates that no flooding occurred within this Hydrologic Service Area.
 NWS FORM E-5 U.S. DEPARTMENT OF COMMERCE HSA OFFICE: NOAA, NATIONAL WEATHER SERVICE MONTHLY REPORT OF RIVER AND FLOOD CONDITIONS DATE: TO: North Webster, IN REPORT FOR (MONTH &YEAR): January, 2003 February
Climate change in the U.S. Northeast
 Climate change in the U.S. Northeast By U.S. Environmental Protection Agency, adapted by Newsela staff on 04.10.17 Word Count 1,109 Killington Ski Resort is located in Vermont. As temperatures increase
CoCoRaHS. Community Collaborative Rain, Hail, & Snow Network. Ashley Wolf Meteorologist NWS Green Bay Northeast Wisconsin CoCoRaHS Coordinator
 CoCoRaHS Community Collaborative Rain, Hail, & Snow Network Ashley Wolf Meteorologist NWS Green Bay Northeast Wisconsin CoCoRaHS Coordinator What is CoCoRaHS Who, What, Where and Whys of CoCoRaHS What?
NWS FORM E-5 U.S. DEPARTMENT OF COMMERCE HSA OFFICE:
 NWS FORM E-5 U.S. DEPARTMENT OF COMMERCE HSA OFFICE: NOAA, NATIONAL WEATHER SERVICE MONTHLY REPORT OF RIVER AND FLOOD CONDITIONS DATE: TO: North Webster, IN REPORT FOR (MONTH &YEAR): July 1998 August 5,
The Pennsylvania Observer
 The Pennsylvania Observer The Pennsylvania Observer September 16, 2004 Recap of Pennsylvania's weather from August 6 - September 12, 2004. http://pasc.met.psu.edu/pa_climatologist/nl/archive/20040916/sec1.php
One person killed when tornadoes hit Oklahoma, Arkansas (Update) 25 March 2015, byjustin Juozapavicius
 25 March 2015, byjustin Juozapavicius") One person killed when tornadoes hit Oklahoma, Arkansas (Update) 25 March 2015, byjustin Juozapavicius from those. A small tornado swept across parts of Moore, an Oklahoma City suburb where 24 people died
One person killed when tornadoes hit Oklahoma, Arkansas (Update) 25 March 2015, byjustin Juozapavicius from those. A small tornado swept across parts of Moore, an Oklahoma City suburb where 24 people died
Wyoming State Operations Center
 Wyoming State Operations Center Updated Situation Report, Bordeaux Tornado site 14: 36 hrs 8 June 2012 Wyoming Office of Homeland Security (WOHS) arrived at the incident command post at the corner of Olson
The Pennsylvania Observer
 The Pennsylvania Observer September 3, 2008 Summer 2008 Weather Summary Written by: Brian Thompson The opening days of June started dry, but a warm front brought a widespread rain a couple of days into
UNITED STATES AND SOUTH AMERICA OUTLOOK (FULL REPORT) Thursday, December 28, 2017
 Thursday, December 28, 2017") T-storm Weather Summary Despite scattered t-storms Sat.-Sun. in central and northern areas in Argentina, more will likely be needed especially in sunflower areas of the southwest. Some t-storms likely
T-storm Weather Summary Despite scattered t-storms Sat.-Sun. in central and northern areas in Argentina, more will likely be needed especially in sunflower areas of the southwest. Some t-storms likely
January 2018 Climate Summary
 Ken Scheeringa and Andy Eggert Feb 8, 2018 (765) 494-8105 http://www.iclimate.org January 2018 Climate Summary Month Summary January temperature swings were amazing. In the first few days arctic cold pushed
FLOOD/SCS EVENT, APRIL 28 MAY 4
 REPORT DATE: May 4, 2017 EVENT DATE: April 28-May 4, 2017 FLOOD/SCS EVENT, APRIL 28 MAY 4 Event Summary General Significant Flood Outlook. SOURCE: National Weather Service. A significant severe thunderstorm
W I N T E R STORM HAZARD DESCRIPTION
 W I N T E R STORM HAZARD DESCRIPTION... 1 LOCATION... 2 EXTENT... 2 HISTORICAL OCCURRENCES... 4 SIGNIFICANT PAST EVENTS... 4 PROBABILITY OF FUTURE EVENTS... 5 VULNERABILITY AND IMPACT... 5 HAZARD DESCRIPTION
Chapter 3: Weather Fronts & Storms
 Chapter 3: Weather Fronts & Storms An AIR MASS is a large body of air that has similar characteristics (temperature, humidity) throughout. Air masses can be massively large. Air masses are classified by
KANSAS CLIMATE SUMMARY February 2015
 KANSAS CLIMATE SUMMARY February 2015 Extended Cold Despite some record warm readings at a few locations, February was characterized by colder than normal conditions. This was particularly true during the
May 2016 Volume 23 Number 5
 The Weather Wire May 2016 Volume 23 Number 5 Contents: Winter Summary Current Colorado and West-wide Snow Pack Drought Monitor April Summary/Statistics May Preview Snowfall Totals Winter Summary The Front
March 2012 Climate Summary
 Ken Scheeringa and Kayla Hudson Apr 4, 2012 (765) 494-8105 http://www.iclimate.org March 2012 Climate Summary Month Summary March was a month of weather extremes with records shattered almost as a daily
The Pennsylvania Observer
 The Pennsylvania Observer May 31, 2012 May 2012 - Pennsylvania Weather Recap By: Paul Knight The majority of the fifth month had temperatures averaging well above seasonal levels with two distinct hot
The hydrologic service area (HSA) for this office covers Central Kentucky and South Central Indiana.
 for this office covers Central Kentucky and South Central Indiana.") NWS Form E-5 (04-2006) NATIONAL OCEANIC AND ATMOSPHERIC ADMINISTRATION (PRES. BY NWS Instruction 10-924) NATIONAL WEATHER SERVICE MONTHLY REPORT OF HYDROLOGIC CONDITIONS HYDROLOGIC SERVICE AREA (HSA) Louisville
NWS Form E-5 (04-2006) NATIONAL OCEANIC AND ATMOSPHERIC ADMINISTRATION (PRES. BY NWS Instruction 10-924) NATIONAL WEATHER SERVICE MONTHLY REPORT OF HYDROLOGIC CONDITIONS HYDROLOGIC SERVICE AREA (HSA) Louisville