Maggie M. Kovach. Department of Geography University of North Carolina at Chapel Hill
|
|
|
- Timothy Tyler
- 5 years ago
- Views:
Transcription


1 Maggie M. Kovach Department of Geography University of North Carolina at Chapel Hill


2 Rationale What is heat-related illness? Why is it important? Who is at risk for heat-related illness and death? Urban areas Poor, minorities, socially isolated, elderly, lack of fan or air conditioning dailykos.com Information adapted from: Meehl and Tebaldi 2004, McGeehin and Mirabelli 2001Whitman et al. 1997, Semenza et al. 1999, Naughton et al. 2002, Jones et al. 1982, Kilbourne et al. 1982, Smoyer et al. 1998, Johnson et al. 2009, CDC 2004

3 Rationale What geographic locations are at greater risk for heat-related illness? Measure the co-location of areas with greater physical exposure to extreme heat with locations with poor social vulnerability. A main limitation results not validated with actual counts to heat morbidity and mortality


.")
4 Rationale Are agricultural workers at greater risk for HRI? In the US, North Carolina accounts for 57% of all heat related deaths among all reported heat deaths among crop workers heatcrop workers from 1992 to 2006 (Luginbuhl et al. 2008) African Americans, Latino workers (Richardson and Gregory 1997, Richardson and Mirabelli 2002). EPA Agricultural Worker Health Project : David Bacon ers.usda.gov


5 Research Question What is the spatial pattern of HRI across the study region? How does this pattern relate to socioeconomic, demographic, and land cover patterns? OSHA joepaduda.com
 Over 50% of these ED admissions are patients from 20 to 50 years old Males comprised 73% of")
6 North Carolina Disease Event Tracking and Epidemiologic Tool (NC DETECT) Dates Available: 01/01/ /31/2010 ICD 9: 992.xx ED admissions: 9,594 visits (81% in summer) Over 50% of these ED admissions are patients from 20 to 50 years old Males comprised 73% of the HRI ED admissions.
7 Data Sources ACS Survey Race: (Hispanic, Black, White) Citizenship: (Naturalized, Non-Citizen, Spanish speakers) Income: (food stamps, below $20,000, median household income) Housing Type: (Mobile home, multihouse, rental occupancy) Electricity source:(lpg, natural gas, electricity, heating oil) National Land Cover Database (2008) Developed Land: High intensity, medium intensity, Low intensity Cultivated Crops: 30 total crops (e.g. tobacco, corn, apples, oats, peanuts) Forest: Evergreen, Mixed forest, deciduous forest, woodland Potential Relationship to HRI Populations most vulnerable to heat Agricultural workers/social isolation Wealth or poverty Wealth or poverty/social isolation Rural or Urban/Poverty Potential Relationship to HRI Rural or Urban/Geographic Locations Agriculture workers/microclimate of fields Cooling potential from vegetation
8 Methodology 1.) Transform data to a similar spatial scale National Land Cover Database (2008)
 Perform GWR on each physiographic region (coastal plain, piedmont and mountains) 4.")
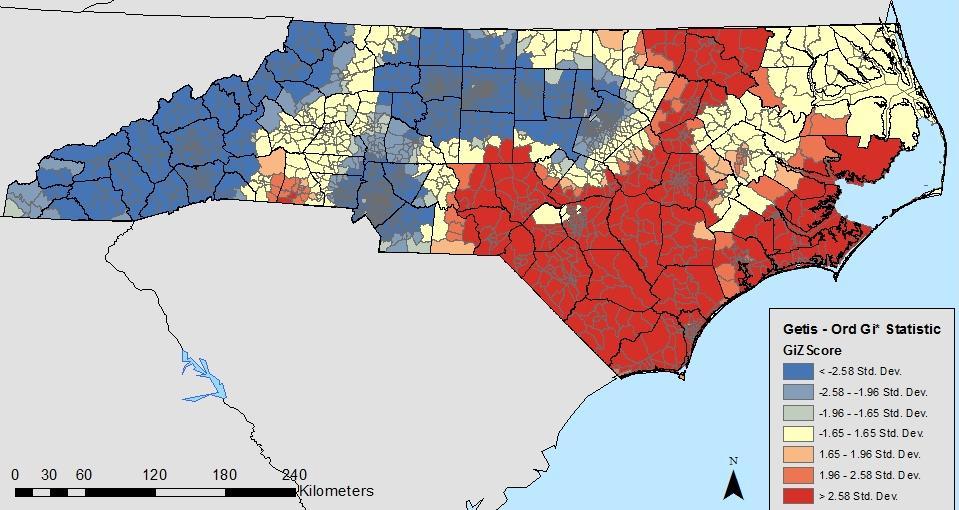
9 Methodology 2.) Map the spatial distribution and descriptive cluster analysis to analyze patterns of HRI 3.) Perform GWR on each physiographic region (coastal plain, piedmont and mountains) 4.) Perform basic correlations within physiographic regions to identify any at risk agricultural land cover
 *as defined by the NC Rural Economic Development")
10 ED Admissions By County N = 9, 594 ED Admissions Rural Admissions = 6, 035 (82, 084 Per 100,000) Urban Admissions = 3, 559 (9,985 Per 100,000) *as defined by the NC Rural Economic Development Center
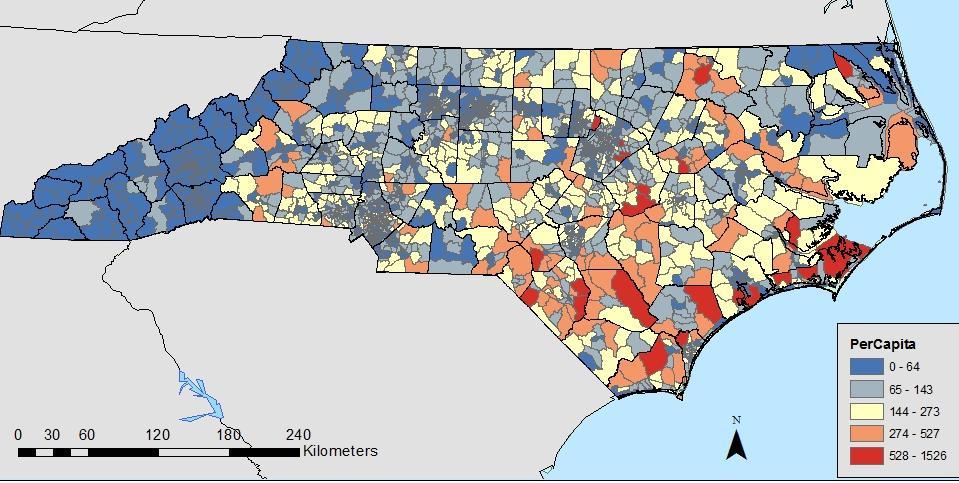
11 ED Admissions By Census Tract
12 State Wide Analysis Variables R Mobile Home 0.45 Cropland 0.34 Developed *p-values < 0.05 Developed Land Stepwise Regression (in descending effect): Mobile home density Developed land Cropland Together the variables in this model accounted for 23% of the variance in HRI admissions. Cropland


13 Coastal Plain Geographically Weighted Regression Developed Land R^2 Value Mobile Home Cropland American Indian N = 3,753ED Admissions

14 Coastal Plain Land Cover Analysis Coastal Plain Land Cover Type R - Value Southern Forest Vegetation ED visits Soybean Per Capita Corn 0.24 Developed Middle Forest Vegetation ED visits Corn Per Capita Tobacco 0.16 Developed Northern Cotton ED Visits Forest Vegetation Per Capita Sunflower 0.22 Developed *p-values < 0.05

15 Piedmont Geographically Weighted Regression R^2 Value Developed Land Mobile Home

16 Piedmont Land Cover Analysis Per Capita HRI for Piedmont Piedmont Land Cover Type R - Value Southern Forest Vegetation ED visits Peaches Per Capita Soybean 0.2 Developed Middle Forest Vegetation ED visits Corn Per Capita Soybean 0.24 Developed Northern Forest Vegetation ED Visits Tobacco Per Capita Corn 0.28 Developed -0.54
17 Mountains Geographically Weighted Regression Black R^2 Value Median Income Developed Land No High School

18 Mountains Land Cover Analysis Coastal Plain Land Cover Type R - Value Southern Forest Vegetation 0.4 Soybean 0.25 Corn 0.24 Developed Northern Forest Vegetation 0.62 Watermelon 0.27 Developed -0.3 Per Capita HRI for Mountains
19 Rural vs. Urban Piedmont Variables R^2 Rural (+)Mobile Home (+)Cropland (-) Developed (+) American Indian (+)Population 18 to 24 Urban (-)Developed (+)Less than High School Education (+)Mobile Home (+)Black
20 Summary In North Carolina, heat related illness (HRI) is found predominately in rural areas. Since rural risk factors for heat have rarely been examined, these results highlight a need for additional study of rural population s vulnerability to heat. Mobile homes, a possible proxy for rural poverty, increase a community s risk for heat-related illness. Other indicators for poverty such as food stamps, income below $20,000 or home value below $10,000 have less influence on HRI. In the Coastal Plain, American Indians are a possible at-risk group. In the Northern Coastal Plain, agriculture is positively associated with HRI particularly for cotton. In the Piedmont, no minority populations were associated with increased HRI. However, rural areas with high mobile home concentration were associated In the Mountains, particularly in the North blacks and residents with no high school are positively associated with HRI. Previously identified risk factors, such as cooling vegetation and an urban environment DO not apply to North Carolina residents. This research highlights how risk factors for other geographic regions cannot necessarily be applied to other regions to assess vulnerability.
21 Summary In North Carolina, heat related illness (HRI) is found predominately in rural areas. Since rural risk factors for heat have rarely been examined, these results highlight a need for additional study of rural population s vulnerability to heat. Mobile homes, a possible proxy for rural poverty, increase a community s risk for heat-related illness. Other indicators for poverty such as food stamps, income below $20,000 or home value below $10,000 have less influence on HRI. Minorities such as American Indians are positively associated with HRI in rural counties of NC, particularly in the Northern and Southern Coastal Plain. Other Minorities such as Blacks are positively associated with HRI in urban counties and selected areas of the mountains. Cropland is postively associated with HRI, but crop type varies regionally. More analysis and data is needed to confirm any relationship. Previously identified risk factors, such as cooling vegetation and an urban environment DO not apply to North Carolina residents. This research highlights how risk factors for other geographic regions cannot necessarily be applied to other regions to assess vulnerability.


22 Future Directions Integrate weather data to explore climate thresholds. Incorporate into heat advisory, warnings National Weather Service Department of Public Health
 The NC DETECT Data Oversight")

23 Acknowledgements: NC Division of Public Health NC-DETECT Southeast Regional Climate Center Carolina Integrated Science & Assessments (CISA) The NC DETECT Data Oversight Committee does not take responsibility for the scientific validity or accuracy of methodology, results, statistical analyses or conclusions presented. Contact:
Comparing the Relationships Between Heat Stress Indices and Mortality in North Carolina
 Comparing the Relationships Between Heat Stress Indices and Mortality in North Carolina Jordan Clark PhD Student CISA Research Assistant Department of Geography UNC-Chapel Hill 10/30/2018 Overview Background
Assessing Social Vulnerability to Biophysical Hazards. Dr. Jasmine Waddell
 Assessing Social Vulnerability to Biophysical Hazards Dr. Jasmine Waddell About the Project Built on a need to understand: The pre-disposition of the populations in the SE to adverse impacts from disaster
Social Vulnerability Index. Susan L. Cutter Department of Geography, University of South Carolina
 Social Vulnerability Index Susan L. Cutter Department of Geography, University of South Carolina scutter@sc.edu Great Lakes and St. Lawrence Cities Initiative Webinar December 3, 2014 Vulnerability The
Environmental Analysis, Chapter 4 Consequences, and Mitigation
 Environmental Analysis, Chapter 4 4.17 Environmental Justice This section summarizes the potential impacts described in Chapter 3, Transportation Impacts and Mitigation, and other sections of Chapter 4,
Jun Tu. Department of Geography and Anthropology Kennesaw State University
 Examining Spatially Varying Relationships between Preterm Births and Ambient Air Pollution in Georgia using Geographically Weighted Logistic Regression Jun Tu Department of Geography and Anthropology Kennesaw
Agro Ecological Malaria Linkages in Uganda, A Spatial Probit Model:
 Agro Ecological Malaria Linkages in Uganda, A Spatial Probit Model: IFPRI Project Title: Environmental management options and delivery mechanisms to reduce malaria transmission in Uganda Spatial Probit
1Department of Demography and Organization Studies, University of Texas at San Antonio, One UTSA Circle, San Antonio, TX
 Well, it depends on where you're born: A practical application of geographically weighted regression to the study of infant mortality in the U.S. P. Johnelle Sparks and Corey S. Sparks 1 Introduction Infant
ARIC Manuscript Proposal # PC Reviewed: _9/_25_/06 Status: A Priority: _2 SC Reviewed: _9/_25_/06 Status: A Priority: _2
 ARIC Manuscript Proposal # 1186 PC Reviewed: _9/_25_/06 Status: A Priority: _2 SC Reviewed: _9/_25_/06 Status: A Priority: _2 1.a. Full Title: Comparing Methods of Incorporating Spatial Correlation in
Medical GIS: New Uses of Mapping Technology in Public Health. Peter Hayward, PhD Department of Geography SUNY College at Oneonta
 Medical GIS: New Uses of Mapping Technology in Public Health Peter Hayward, PhD Department of Geography SUNY College at Oneonta Invited research seminar presentation at Bassett Healthcare. Cooperstown,
Apéndice 1: Figuras y Tablas del Marco Teórico
 Apéndice 1: Figuras y Tablas del Marco Teórico FIGURA A.1.1 Manufacture poles and manufacture regions Poles: Share of employment in manufacture at least 12% and population of 250,000 or more. Regions:
Neighborhood social characteristics and chronic disease outcomes: does the geographic scale of neighborhood matter? Malia Jones
 Neighborhood social characteristics and chronic disease outcomes: does the geographic scale of neighborhood matter? Malia Jones Prepared for consideration for PAA 2013 Short Abstract Empirical research
APPENDIX V VALLEYWIDE REPORT
 APPENDIX V VALLEYWIDE REPORT Page Intentionally Left Blank 1.2 San Joaquin Valley Profile Geography The San Joaquin Valley is the southern portion of the Great Central Valley of California (Exhibit 1-1).
Most people used to live like this
 Urbanization Most people used to live like this Increasingly people live like this. For the first time in history, there are now more urban residents than rural residents. Land Cover & Land Use Land cover
DEVELOPING DECISION SUPPORT TOOLS FOR THE IMPLEMENTATION OF BICYCLE AND PEDESTRIAN SAFETY STRATEGIES
 DEVELOPING DECISION SUPPORT TOOLS FOR THE IMPLEMENTATION OF BICYCLE AND PEDESTRIAN SAFETY STRATEGIES Deo Chimba, PhD., P.E., PTOE Associate Professor Civil Engineering Department Tennessee State University
Reducing Vulnerability to Extreme Heat: Science-Policy Interface
 Reducing Vulnerability to Extreme Heat: Science-Policy Interface Olga Wilhelmi, Mary Hayden, Jennifer Boehnert, Ursula Lauper and SIMMER research team October 23, 2013 Toronto SIMMER workshop Science-Policy
MAKING PLANNING LOCAL
 Georgia Social Vulnerability Index 2010 Atlas MAKING PLANNING LOCAL VULNERABLE & AT-RISK POPULATIONS DATA FOR JURISDICTIONS AT THE CENSUS TRACT LEVEL Public Health Districts Regional Coordinating Hospital
Module 10 Summative Assessment
 Module 10 Summative Assessment Activity In this activity you will use the three dimensions of vulnerability that you learned about in this module exposure, sensitivity, and adaptive capacity to assess
Description DESCRIPTION
 DESCRIPTION The location of the Upper James Watershed is located in northeastern South Dakota as well as southeastern North Dakota. It includes the following counties located in North Dakota Barnes, Dickey,
Spatial segregation and socioeconomic inequalities in health in major Brazilian cities. An ESRC pathfinder project
 Spatial segregation and socioeconomic inequalities in health in major Brazilian cities An ESRC pathfinder project Income per head and life-expectancy: rich & poor countries Source: Wilkinson & Pickett,
4.3.3 Extreme Temperature
 4.3.3 Extreme Temperature This section provides a profile and vulnerability assessment for the extreme temperature hazard, including extreme heat and extreme cold. Extreme heat can be described as temperatures
2009 ESRI User Conference San Diego, CA
 Guillaume Turcotte GIS Laboratory Technician Villanova University Determining Factors in the Siting of Undesirable Land Uses 2009 ESRI User Conference San Diego, CA Introduction and Literature Review Warren
Life, Physical, and Social Science Occupations in Allegheny County
 Life, Physical, and Social Science Occupations in Allegheny County 2015-2025 1 Life, Physical, and Social Science Occupations Regions Code Description 42003 Allegheny County, PA Timeframe 2015-2025 Datarun
Spatial Disparities in the Distribution of Parks and Green Spaces in the United States
 March 11 th, 2012 Active Living Research Conference Spatial Disparities in the Distribution of Parks and Green Spaces in the United States Ming Wen, Ph.D., University of Utah Xingyou Zhang, Ph.D., CDC
Poverty and Hazard Linkages
 Poverty and Hazard Linkages Global Risk Identification Programme Proposal Development Coordination Meeting Friday, 19 May 2006 CIESIN Earth Institute Columbia University www.ciesin.columbia.edu Data Improvements
Long Island Breast Cancer Study and the GIS-H (Health)
") Long Island Breast Cancer Study and the GIS-H (Health) Edward J. Trapido, Sc.D. Associate Director Epidemiology and Genetics Research Program, DCCPS/NCI COMPREHENSIVE APPROACHES TO CANCER CONTROL September,
Long Island Breast Cancer Study and the GIS-H (Health) Edward J. Trapido, Sc.D. Associate Director Epidemiology and Genetics Research Program, DCCPS/NCI COMPREHENSIVE APPROACHES TO CANCER CONTROL September,
Population Profiles
 U N D E R S T A N D I N G A N D E X P L O R I N G D E M O G R A P H I C C H A N G E MAPPING AMERICA S FUTURES, BRIEF 6 2000 2010 Population Profiles Atlanta, Las Vegas, Washington, DC, and Youngstown Allison
Keywords: Air Quality, Environmental Justice, Vehicle Emissions, Public Health, Monitoring Network
 NOTICE: this is the author s version of a work that was accepted for publication in Transportation Research Part D: Transport and Environment. Changes resulting from the publishing process, such as peer
hurricane harvey and equitable recovery
 hurricane harvey and equitable recovery Mapping social vulnerability and intensity of wind and flooding from Hurricane Harvey in Texas hurricane harvey s impact on texas In August 2017, Hurricane Harvey
Spatial Organization of Data and Data Extraction from Maptitude
 Spatial Organization of Data and Data Extraction from Maptitude N. P. Taliceo Geospatial Information Sciences The University of Texas at Dallas UT Dallas GIS Workshop Richardson, TX March 30 31, 2018 1/
Measuring community health outcomes: New approaches for public health services research
 Research Brief March 2015 Measuring community health outcomes: New approaches for public health services research P ublic Health agencies are increasingly asked to do more with less. Tough economic times
Extreme Weather Events: Infrastructure Damage and Impact on Vulnerable Populations
 Extreme Weather Events: Infrastructure Damage and Impact on Vulnerable Populations Cindy L. Parker MD, MPH Physicians for Social Responsibility Johns Hopkins Bloomberg School of Public Health 1 Climate
Geospatial Analysis of Job-Housing Mismatch Using ArcGIS and Python
 Geospatial Analysis of Job-Housing Mismatch Using ArcGIS and Python 2016 ESRI User Conference June 29, 2016 San Diego, CA Jung Seo, Frank Wen, Simon Choi and Tom Vo, Research & Analysis Southern California
CRP 608 Winter 10 Class presentation February 04, Senior Research Associate Kirwan Institute for the Study of Race and Ethnicity
 CRP 608 Winter 10 Class presentation February 04, 2010 SAMIR GAMBHIR SAMIR GAMBHIR Senior Research Associate Kirwan Institute for the Study of Race and Ethnicity Background Kirwan Institute Our work Using
Tracey Farrigan Research Geographer USDA-Economic Research Service
 Rural Poverty Symposium Federal Reserve Bank of Atlanta December 2-3, 2013 Tracey Farrigan Research Geographer USDA-Economic Research Service Justification Increasing demand for sub-county analysis Policy
Indicators of sustainable development: framework and methodologies CSD Indicators of sustainable development 1996
 Indicators of sustainable development: framework and methodologies CSD Indicators of sustainable development 1996 Keywords: mountain areas, mountain development, natural resources management, sustainable
GEOGRAPHY Practice Answer Paper - 2
 GEOGRAPHY Practice Answer Paper - 2 Q.1) Select the correct option and rewrite the sentence : 4 1) According to Census 2011, the average population density of India is 382 persons per sq.km. 2) The rate
Urbanization, Land Cover, Weather, and Incidence Rates of Neuroinvasive West Nile Virus Infections In Illinois
 Urbanization, Land Cover, Weather, and Incidence Rates of Neuroinvasive West Nile Virus Infections In Illinois JUNE 23, 2016 H ANNAH MATZ KE Background Uganda 1937 United States -1999 New York Quickly
2014 Planning Database (PDB)
") 2014 Planning Database (PDB) November 19, 2014 Barbara O Hare, Nancy Bates, Julia Coombs, Travis Pape, Chandra Erdman Office of Survey Analytics 1 Overview Tract and Block Group PDBs Useful for: Identifying
2014 Planning Database (PDB) November 19, 2014 Barbara O Hare, Nancy Bates, Julia Coombs, Travis Pape, Chandra Erdman Office of Survey Analytics 1 Overview Tract and Block Group PDBs Useful for: Identifying
Measuring Poverty. Introduction
 Measuring Poverty Introduction To measure something, we need to provide answers to the following basic questions: 1. What are we going to measure? Poverty? So, what is poverty? 2. Who wants to measure
Regional Performance Measures
 G Performance Measures Regional Performance Measures Introduction This appendix highlights the performance of the MTP/SCS for 2035. The performance of the Revenue Constrained network also is compared to
Regional Performance Measures
 G Performance Measures Regional Performance Measures Introduction This appendix highlights the performance of the MTP/SCS for 2035. The performance of the Revenue Constrained network also is compared to
The Climate of the Carolinas: Past, Present, and Future - Results from the National Climate Assessment
 The Climate of the Carolinas: Past, Present, and Future - Results from the National Climate Assessment Chip Konrad Chris Fuhrmann Director of the The Southeast Regional Climate Center Associate Professor
Demographic Data in ArcGIS. Harry J. Moore IV
 Demographic Data in ArcGIS Harry J. Moore IV Outline What is demographic data? Esri Demographic data - Real world examples with GIS - Redistricting - Emergency Preparedness - Economic Development Next
Subunit 4.1: 2.5 hours. Subunit 4.2: 2.75 hours. Subunit 4.3: 1.5 hours. Subunit 4.4: 3.5 hours. Subunit 4.5: 1.5 hours Unit 4 Learning Outcomes close
 Unit 4: North America The realm of North America extends from the polar regions of the Arctic in northern Canada and Alaska, all the way south through Mexico and the countries of Central America. Geographers
Income Inequality in Missouri 2000
 Through the growth in global media, people around the world are becoming more aware of and more vocal about the gap between the rich and the poor. Policy makers, researchers and academics are also increasingly
The Church Demographic Specialists
 The Church Demographic Specialists Easy-to-Use Features Map-driven, Web-based Software An Integrated Suite of Information and Query Tools Providing An Insightful Window into the Communities You Serve Key
Social and Economic Impacts of Brownfield Redevelopment in Florida New Analytical Tools to Assess the State and Tribal Response Program
 Social and Economic Impacts of Brownfield Redevelopment in Florida New Analytical Tools to Assess the State and Tribal Response Program Christian Wells Our mission is to leverage interdisciplinary scientific
Integrating GIS into Food Access Analysis
 GIS Day at Kansas University Integrating GIS into Food Access Analysis Daoqin Tong School of Geography and Development Outline Introduction Research questions Method Results Discussion Introduction Food
Spatial and Socioeconomic Analysis of Commuting Patterns in Southern California Using LODES, CTPP, and ACS PUMS
 Spatial and Socioeconomic Analysis of Commuting Patterns in Southern California Using LODES, CTPP, and ACS PUMS Census for Transportation Planning Subcommittee meeting TRB 95th Annual Meeting January 11,
Poverty statistics in Mongolia
 HIGH-LEVEL SEMINAR ON HARMONISATION OF POVERTY STATISTICS IN CIS COUNTRIES SOCHI (RUSSIAN FEDERATION) Poverty statistics in Mongolia Oyunchimeg Dandar Director Population and Social Statistics Department,
Analyzing the Geospatial Rates of the Primary Care Physician Labor Supply in the Contiguous United States
 Analyzing the Geospatial Rates of the Primary Care Physician Labor Supply in the Contiguous United States By Russ Frith Advisor: Dr. Raid Amin University of W. Florida Capstone Project in Statistics April,
Do the Causes of Poverty Vary by Neighborhood Type?
 Do the Causes of Poverty Vary by Neighborhood Type? Suburbs and the 2010 Census Conference Uday Kandula 1 and Brian Mikelbank 2 1 Ph.D. Candidate, Maxine Levin College of Urban Affairs Cleveland State
Environmental Justice Analysis
 Environmental Justice Analysis October 2013 Transportation Department Environmental Justice Analysis Background The U.S. Environmental Protection Agency (EPA) defines environmental justice as the fair
Evidence on the impact of sustained exposure to air pollution on life expectancy from China s Huai River policy, Chen et al.
 Evidence on the impact of sustained exposure to air pollution on life expectancy from China s Huai River policy, Chen et al. 2013, PNAS 11.4.2017 Matti Liski Department of Economics, BIZ Research question
DIFFERENT INFLUENCES OF SOCIOECONOMIC FACTORS ON THE HUNTING AND FISHING LICENSE SALES IN COOK COUNTY, IL
 DIFFERENT INFLUENCES OF SOCIOECONOMIC FACTORS ON THE HUNTING AND FISHING LICENSE SALES IN COOK COUNTY, IL Xiaohan Zhang and Craig Miller Illinois Natural History Survey University of Illinois at Urbana
Environmental Justice Analysis FOR THE MINNESOTA STATEWIDE FREIGHT SYSTEM PLAN
 Environmental Justice Analysis FOR THE MINNESOTA STATEWIDE FREIGHT SYSTEM PLAN Presentation Overview Minnesota Freight Plan Summary Environmental Justice (EJ) Background Freight Plan EJ Analysis Methodology
Climate and Health Vulnerability & Adaptation Assessment Profile Manaus - Brazil
 Climate and Health Vulnerability & Adaptation Assessment Profile Manaus - Brazil Christovam Barcellos (ICICT/Fiocruz) Diego Xavier Silva (ICICT/Fiocruz) Rita Bacuri (CPqLMD/Fiocruz) Assessment Objectives
ITEM 11 Information June 20, Visualize 2045: Update to the Equity Emphasis Areas. None
 ITEM 11 Information June 20, 2018 Visualize 2045: Update to the Equity Emphasis Areas Staff Recommendation: Issues: Background: Briefing on the TPB-approved methodology to update the Equity Emphasis Areas
Assessment Objectives Grid for Geography - G1. Summer Application Skills Total. (a) (b) (c) (a)
 (b) (c) (a)") Assessment Objectives Grid for Geography - G1 Summer 2014 Question 1 Knowledge and Understanding Application Skills Total Key Question (a) 0 2 3 5 1.5 (b) 8 2 10 1.3 (c) 7 3 10 1.4 15 7 3 25 Question 2
Assessment Objectives Grid for Geography - G1 Summer 2014 Question 1 Knowledge and Understanding Application Skills Total Key Question (a) 0 2 3 5 1.5 (b) 8 2 10 1.3 (c) 7 3 10 1.4 15 7 3 25 Question 2
Foundation Geospatial Information to serve National and Global Priorities
 Foundation Geospatial Information to serve National and Global Priorities Greg Scott Inter-Regional Advisor Global Geospatial Information Management United Nations Statistics Division UN-GGIM: A global
This report details analyses and methodologies used to examine and visualize the spatial and nonspatial
 Analysis Summary: Acute Myocardial Infarction and Social Determinants of Health Acute Myocardial Infarction Study Summary March 2014 Project Summary :: Purpose This report details analyses and methodologies
Measuring Disaster Risk for Urban areas in Asia-Pacific
 Measuring Disaster Risk for Urban areas in Asia-Pacific Acknowledgement: Trevor Clifford, Intl Consultant 1 SDG 11 Make cities and human settlements inclusive, safe, resilient and sustainable 11.1: By
ADDRESSING TITLE VI AND ENVIRONMENTAL JUSTICE IN LONG-RANGE TRANSPORTATION PLANS
 ADDRESSING TITLE VI AND ENVIRONMENTAL JUSTICE IN LONG-RANGE TRANSPORTATION PLANS Activities from the National Capital Region Transportation Planning Board Sergio Ritacco Transportation Planner 2017 Association
HOW FAR TO THE NEAREST PHYSICIAN?
 Rural and Small Town Canada Analysis Bulletin Catalogue no. 21-006-XIE Vol. 1, No. 5 (March 1999) HOW FAR TO THE NEAREST PHYSICIAN? Edward Ng, Russell Wilkins, Jason Pole and Owen B. Adams HIGHLIGHTS In
MARS AREA SCHOOL DISTRICT CURRICULUM GRADE: Grade 4
 MARS AREA SCHOOL DISTRICT CURRICULUM GRADE: Grade 4 Course Title: Social Studies Brief Description Overview: Students will explore the history, geography, government, and economy of the United States with
ESRI 2008 Health GIS Conference
 ESRI 2008 Health GIS Conference An Exploration of Geographically Weighted Regression on Spatial Non- Stationarity and Principal Component Extraction of Determinative Information from Robust Datasets A
Arkansas Retiree In-Migration: A Regional Analysis
 Community & Economic Development FSCDM5 Arkansas Retiree In-Migration: A Regional Analysis Wayne Miller Professor and Extension Economist Katy Elliott Extension Associate - Community and Economic Development
CHANGES IN THE STRUCTURE OF POPULATION AND HOUSING FUND BETWEEN TWO CENSUSES 1 - South Muntenia Development Region
 TERITORIAL STATISTICS CHANGES IN THE STRUCTURE OF POPULATION AND HOUSING FUND BETWEEN TWO CENSUSES 1 - South Muntenia Development Region PhD Senior Lecturer Nicu MARCU In the last decade, a series of structural
A Comprehensive Method for Identifying Optimal Areas for Supermarket Development. TRF Policy Solutions April 28, 2011
 A Comprehensive Method for Identifying Optimal Areas for Supermarket Development TRF Policy Solutions April 28, 2011 Profile of TRF The Reinvestment Fund builds wealth and opportunity for lowwealth communities
OBESITY AND LOCATION IN MARION COUNTY, INDIANA MIDWEST STUDENT SUMMIT, APRIL Samantha Snyder, Purdue University
 OBESITY AND LOCATION IN MARION COUNTY, INDIANA MIDWEST STUDENT SUMMIT, APRIL 2008 Samantha Snyder, Purdue University Organization Introduction Literature and Motivation Data Geographic Distributions ib
Hot Weather Response Plan
 City of Greater Sudbury Hot Weather Response Plan For Public Release Version 1.3 July 2007 May 2009 Revised: May 2010 TABLE OF CONTENTS Introduction... 3 Essential Components... 4 Objectives... 4 Roles
APPENDIX C-3 Equitable Target Areas (ETA) Technical Analysis Methodology
 Technical Analysis Methodology") APPENDIX C-3 Equitable Target Areas (ETA) Technical Analysis Methodology Contents Introduction... 1 ETA Index Methodology... 1 ETA Index Development... 1 Other EJ Measures... 4 The Limited English Proficiency
APPENDIX C-3 Equitable Target Areas (ETA) Technical Analysis Methodology Contents Introduction... 1 ETA Index Methodology... 1 ETA Index Development... 1 Other EJ Measures... 4 The Limited English Proficiency
A Review of Concept of Peri-urban Area & Its Identification
 A Review of Concept of Peri-urban Area & Its Identification Ar. Manita Saxena Research Scholar Department of Architecture and Planning M.A.N.I.T, Bhopal Dr. Supriya Vyas Assistant Professor, Department
NEW YORK DEPARTMENT OF SANITATION. Spatial Analysis of Complaints
 NEW YORK DEPARTMENT OF SANITATION Spatial Analysis of Complaints Spatial Information Design Lab Columbia University Graduate School of Architecture, Planning and Preservation November 2007 Title New York
Societal impacts of inland moving tropical cyclones across the southeastern U.S
 Societal impacts of inland moving tropical cyclones across the southeastern U.S Maggie M. Kovach, Gretchen Carlson, Charles E. Konrad II NOAA Southeast Regional Climate Center Department of Geography University
KENTUCKY HAZARD MITIGATION PLAN RISK ASSESSMENT
 KENTUCKY HAZARD MITIGATION PLAN RISK ASSESSMENT Presentation Outline Development of the 2013 State Hazard Mitigation Plan Risk Assessment Determining risk assessment scale Census Data Aggregation Levels
Enrollment at a Glance Fall 2015
 1. Number of Students Enrolled at Tenth Day of Fall Term 2011 2012 2013 2014 2015 3,705 ( 100.0% ) 3,626 ( 100.0% ) 3,706 ( 100.0% ) 3,746 ( 100.0% ) 3,891 ( 100.0% ) New 1 1,051 ( 28.4% ) 1,063 ( 29.3%
The MRCC and Monitoring Drought in the Midwest
 The and Monitoring Drought in the Midwest Steve Hilberg Director, Illinois State Water Survey Prairie Research Institute, University of Illinois The A partner of a national climate service program that
Heat and Health: Reducing the Impact of the Leading Weather-Related Killer
 Heat and Health: Reducing the Impact of the Leading Weather-Related Killer Laurence S. Kalkstein, Ph.D. Department of Public Health Sciences Miller School of Medicine University of Miami June, 2017 Quick
OnTheMap for Emergency Management
 OnTheMap for Emergency Management Robert Pitts Geographer/Project Manager Longitudinal Employer Household Dynamics (LEHD) Center for Economic Studies U.S. Census Bureau Jody Hoon-Star Geographer/Application
A Street Named for a King
 A Street Named for a King Dr. Jerry Mitchell University of South Carolina OVERVIEW This lesson adapts the work of Dr. Derek Alderman, a geographer who has used the Martin Luther King, Jr. street-naming
Southington. Challenges
 Southington Southington, similar to its next-door neighbor Berlin, is a suburban community in the southeast part of the region. Originally an agricultural community, Southington has also hosted industry
Demographic Data. How to get it and how to use it (with caution) By Amber Keller
 By Amber Keller") Demographic Data How to get it and how to use it (with caution) By Amber Keller 101 Where does it come from? o The American Community Survey o Socio-economic characteristics of a population o Administered
Demographic Data How to get it and how to use it (with caution) By Amber Keller 101 Where does it come from? o The American Community Survey o Socio-economic characteristics of a population o Administered
Geospatial Technologies for Resources Planning & Management
 Geospatial Technologies for Resources Planning & Management Lal Samarakoon, PhD Director, Geoinformatics Center Asian Institute of Technology, Thailand Content Geoinformatics for SDG Information Integration
* * GEOGRAPHY 2217/02. Paper 2 Geographical Skills For examination from 2020
 Cambridge O Level *0123456789* GEOGRAPHY 2217/02 Paper 2 Geographical Skills For examination from 2020 SPECIMEN PAPER You must answer on the question paper. You will need: Insert (enclosed) Plain paper
Climate change in the U.S. Northeast
 Climate change in the U.S. Northeast By U.S. Environmental Protection Agency, adapted by Newsela staff on 04.10.17 Word Count 1,109 Killington Ski Resort is located in Vermont. As temperatures increase
HAZARD DESCRIPTION... 1 LOCATION... 1 EXTENT... 1 HISTORICAL OCCURRENCES...
 WINTER STORM HAZARD DESCRIPTION... 1 LOCATION... 1 EXTENT... 1 HISTORICAL OCCURRENCES... 3 SIGNIFICANT PAST EVENTS... 4 PROBABILITY OF FUTURE EVENTS... 5 VULNERABILITY AND IMPACT... 5 Hazard Description
Hennepin GIS. Tree Planting Priority Areas - Analysis Methodology. GIS Services April 2018 GOAL:
 Hennepin GIS GIS Services April 2018 Tree Planting Priority Areas - Analysis Methodology GOAL: To create a GIS data layer that will aid Hennepin County Environment & Energy staff in determining where to
Modeling global, urban, and rural exposure to climate-related hazards
 Modeling global, urban, and rural exposure to climate-related hazards Elizabeth Christenson, Mark Elliott, Ovik Banerjee, Laura Hamrick, Jamie Bartram University of North Carolina Chapel Hill ESRI User
I-94 COMMERCIAL LAND ±30.44 ACRES TH ST Eau Galle, WI 54747
 PROPERTY HIGHLIGHTS + + Located off I-94 and Hwy 63 Interchange 2,900 VPD + + Baldwin-Woodville Area School District + + Zoning: Commercial, Rural Residential + + 40 miles to St. Paul + + 25 miles to Menomonie,
Health and Medical Geography (GEOG 222)
") Spring 2019 Class meets: Tuesdays and Thursdays 12:30-1:45pm Carolina Hall Room 220 Instructor: Michael Emch Email: emch@unc.edu Course Objectives Health and Medical Geography (GEOG 222) This course is
Spring 2019 Class meets: Tuesdays and Thursdays 12:30-1:45pm Carolina Hall Room 220 Instructor: Michael Emch Email: emch@unc.edu Course Objectives Health and Medical Geography (GEOG 222) This course is
JOINT STRATEGIC NEEDS ASSESSMENT (JSNA) Key findings from the Leicestershire JSNA and Charnwood summary
 Key findings from the Leicestershire JSNA and Charnwood summary") JOINT STRATEGIC NEEDS ASSESSMENT (JSNA) Key findings from the Leicestershire JSNA and Charnwood summary 1 What is a JSNA? Joint Strategic Needs Assessment (JSNA) identifies the big picture in terms of
JOINT STRATEGIC NEEDS ASSESSMENT (JSNA) Key findings from the Leicestershire JSNA and Charnwood summary 1 What is a JSNA? Joint Strategic Needs Assessment (JSNA) identifies the big picture in terms of
Models for Count and Binary Data. Poisson and Logistic GWR Models. 24/07/2008 GWR Workshop 1
 Models for Count and Binary Data Poisson and Logistic GWR Models 24/07/2008 GWR Workshop 1 Outline I: Modelling counts Poisson regression II: Modelling binary events Logistic Regression III: Poisson Regression
4 th Grade Virginia Studies SOL Review Packet Geography of Virginia. 1. The Algonquian language group of Indians lived in what region of Virginia?
 4 th Grade Virginia Studies SOL Review Packet Geography of Virginia 1. The Algonquian language group of Indians lived in what region of Virginia? A. Allegheny B. Piedmont C. Ridge and Valley D. Tidewater
Baldwin County, Alabama
 2015 Baldwin County, Alabama Multi-Hazard Mitigation Plan I. Comprehensive Plan A multi-jurisdiction plan City of Bay Minette City of Daphne Town of Elberta City of Fairhope City of Foley City of Gulf
Summary Article: Poverty from Encyclopedia of Geography
 Topic Page: Poverty Definition: poverty from Dictionary of Energy Social Issues. the fact of being poor; the absence of wealth. A term with a wide range of interpretations depending on which markers of
The AIR Bushfire Model for Australia
 The AIR Bushfire Model for Australia In February 2009, amid tripledigit temperatures and drought conditions, fires broke out just north of Melbourne, Australia. Propelled by high winds, as many as 400
Migration Modelling using Global Population Projections
 Migration Modelling using Global Population Projections Bryan Jones CUNY Institute for Demographic Research Workshop on Data and Methods for Modelling Migration Associated with Climate Change 5 December
The SE US Drought of 2016 and Public Health Impacts of Wildfire Smoke
 The SE US Drought of 2016 and Public Health Impacts of Wildfire Smoke Chip Konrad Carolinas RISA NOAA Southeast Regional Climate Center University of North Carolina at Chapel Hill Outline Evolution of
Unit 2. United States Physical Geography
 Unit 2 United States Physical Geography Physical Geography U.S. extends from the Atlantic to Pacific U.S. is the 3rd largest country U.S. has fertile soils, vast forests, and variety of minerals All major