1Department of Demography and Organization Studies, University of Texas at San Antonio, One UTSA Circle, San Antonio, TX
|
|
|
- Emma Lane
- 5 years ago
- Views:
Transcription
1 Well, it depends on where you're born: A practical application of geographically weighted regression to the study of infant mortality in the U.S. P. Johnelle Sparks and Corey S. Sparks 1 Introduction Infant mortality remains one of the most sensitive measures indicating the general health status of the population (see Clarke et al. 1994; Cramer 1987; Nersesian 1988; Newland 1981; Singh and Yu 1995). Major medical advances in prenatal and early infant care have led to dramatic decreases in infant mortality rates in the United States. This is largely attributable to fewer infants being born low birth weight and reducing complications during pregnancy that could lead to an infant death. Recent reports from the National Center for Health Statistics indicate that the overall infant mortality rate for the U.S. in 2003 was 6.85 deaths per 1,000 live births (Hoyert et al. 2006). Yet, the U.S. still lags behind many industrialized nations with regard to overall infant mortality rates, and variation in rates across places in the United States and between racial/ethnic groups remains (Nersesian 1988). The goal of our research is to identify possible explanations for the variation in infant mortality rates across space. Social structure theory suggests that the social, racial, economic, and educational distributions of places may impact health outcomes (Bird and Bauman 1995). This theory argues that minority concentration and residential segregation are just two possible components of the social structure that could negatively impact health outcomes at the aggregate level, such as for counties or states. Within the social structure, resources are distributed unequally. Therefore, the social structure can perpetuate inequality in such things as quality employment, affordable and safe housing, incomes, or health care resources to name a few. It is from this theoretical perspective that we test for spatial variation in county infant mortality rates using geographically weighted regression. The purpose of this paper is to examine the associations between various socioeconomic indicators of inequality and county infant mortality rates across the United State. By using analytical methods that allow the relationships between our socioeconomic indicators and infant mortality to vary across space, we hope to provide a better understanding of the often continuous and spatially varying nature of inequality and health. The ultimate goal of this work is inform policy makers about the distinct regional variations in the relationship between socioeconomic inequality and population health. Data and methods Data for this analysis are taken from two sources: Compressed Mortality Files from the National Center for Health Statistics and 2000 U.S. Census of Population and Housing, Summary File 3. Five year sex-race standardized infant mortality rates for the years serve as the dependent variable in this analysis. Standardization of mortality rates is used in order to facilitate the comparison of rates across groups. It is important in this analysis to standardize mortality rates based on sex and race, because mortality risks vary greatly based on these demographic characteristics during the first year of life. For this analysis we use the sex-race distribution of the 2000 U.S. population as our standard population. Independent variables for this analysis are taken from the Census and serve as county-level economic and social indicators. We include five independent variables in our analyses: percentage of the county population that is rural, percentage of the county population that is black, percentage of the county population that is Hispanic, the percentage of the county population below age 5 that lives in a family that is below the federally 1Department of Demography and Organization Studies, University of Texas at San Antonio, One UTSA Circle, San Antonio, TX
2 designated poverty level, and percentage of female headed households in the county. The percentage of the county population that is rural, defined as a population not classified as urban by the Census Bureau, is constructed by dividing the county s rural population by the county total population and multiplying this value by 100. Similarly the percentages of the county population that is black or Hispanic are constructed by taking the total number of black or Hispanic residents per county and dividing those numbers by the total county population in 2000 and multiplying the value by 100. The number of county children below the age of five living below the federally designated poverty threshold is divided by the total county population under the age of five and multiplied by 100 to construct the percentage of the country population under the age of 5 living in poverty. To construct the percentage of female headed households we take the total number of female headed households per county divided by the county population and multiplying this value by 100. The primary method used in this paper is geographically weighted regression (GWR) (Brunsdon et al. 1998; Fotheringham et al. 2002). The primary benefit of using the GWR approach is that it allows us to visualize how the effects of each covariate in our model vary over geographic space. This approach is opposed to the autoregressive models frequently used in spatial demography that, while controlling for autocorrelation in either the dependent variable or the error structure, still estimates global regression parameters. Since we are primarily interested in how the processes that influence infant mortality rates vary across space, global parameter estimates are not sufficient to increase our understanding of the process. The GWR model takes the traditional OLS model and extends the framework by allowing local, rather than global parameter estimates of βi, this is rewritten as: y i = 0 u i,v j k k u i,v j x ik i, where now each βi is estimated at the location ui,vj where i and j are the coordinates or geographic location of the observation i. βi(ui,vj) is the local realization of the continuous β function at point i. This constructs a trend surface of parameter values for each independent variable and the model intercept. Note that the basic OLS regression model above is just a special case of the GWR model where the coefficients are constant over space. The parameters in the GWR are estimated by weighted least squares. The weighting matrix is a diagonal matrix, with each diagonal element being a function of the location of the observation. If Wi is the weighting matrix at location i, then the parameter estimate at that location would be specified as: i =[X ' W i X ] 1 X ' W i Y The role of the weight matrix is to give more value to observations that are close to i, as it is assumed that observations that are close will influence each other more than those that are far away. The form of this weight matrix can vary (as far as how it is calculated). Typically a distance based weight is used, and an observation has 0 weight if it is beyond a distance dij. This distance weighting is used for defining neighborhoods on which to base the estimates of βi. If an observation is within the distance d, then it is included in the analysis for location i. We employ the kernel method of weighting proposed by Brunsdon et al. and Fotheringham et al., in which a global kernel bandwidth is estimated via cross-validation of the observed and predicted mortality rates. This bandwidth parameter defines the neighborhood or the number of observations in the data that will be used to estimate the regression parameters at that specific i,j location. Model estimation is done in R version using the spgwr library and we test the improvement in model performance using the global F-tests and the tests for geographic variation in the regression
3 parameters derived in Leung et al. (2000). Preliminary results The results of our initial OLS regression models are provided in Table 1. They suggest that as the percentage of the county population that is rural, the percentage of the county population that is black and the percentage the county population that is Hispanic increase, these indicate a decrease in the county infant mortality rate, while as the percentage of the county population of children in poverty and the percentage the county population of households with a female head increase, that these factors tend to indicate increase county infant mortality rates. Table 1. Results from Ordinary Least Squares (OLS) Regression Model for US County Infant Mortality Rates, Variable Estimate t Prob(> t ) Intercept <.0001 % Rural <.0001 % Black % Hispanic <.0001 % Children in Poverty % of Female Household Heads < <.0001 While these effects provide a baseline estimate of the effects of our independent variables, we are more concerned with testing the hypothesis that these parameters vary across space. Table 2 presents the results of the GWR, indicating the minimum, median, first and third quartiles, and maximum values for the estimated regression coefficients. The OLS estimates are also given for comparison. Table 2 Distribution of GWR Coefficients for US County Infant Mortality Rates, Variable Minimum 1 st Quartile Median 3 rd Quartile Maximum OLS Estimate Intercept % Rural % Black % Hispanic % Children in Poverty % of Female Household Heads

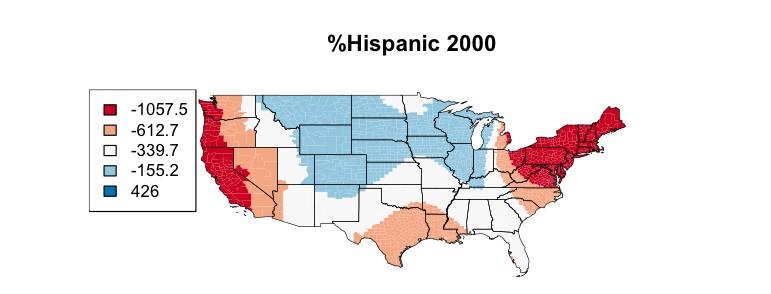
4 While inspection of the table of coefficients reveals significant variability in the regression coefficients across space, and a visual inspection of the regression parameters better illustrates how the relationships between the independent variables and county infant mortality rates vary across space. The following figures provide an illustration of the geographic variation in regression parameters. The ultimate goal of this work is inform policy makers about the distinct regional variations in the relationship between socioeconomic inequality and population health using county infant mortality rates as an example.
5
6 References Bird, S.T. and K.E. Bauman The Relationship between Structural and Health Services Variables and State-Level Infant Mortality in the United States. American Journal of Public Health 85(1): Brunsdon, C., S. Fotheringham, and M. Charlton Geographically Weighted Regression: Modeling Spatial Non-Stationarity. Journal of the Royal Statistical Society Series D-The Statistician 47: Clarke, L.L., F.L. Farmer, and M.K. Miller Structural Determinants of Infant Mortality in Metropolitan and Nonmetropolitan America. Rural Sociology 59(1): Cramer, J.C Social Factors and Infant Mortality: Identifying High-Risk Groups and Proximate Causes. Demography 24(3): Fotheringham, A., C. Brunsdon, and M. Charlton. (eds.) Geographically Weighted Regression: The Analysis of Spatially Varying Relationships. New York: Wiley. Hoyert, D.L., M.P. Heron, S.L. Murphy, and H.C. Kung Deaths: Final Data for National Vital Statistics Report 54(13): Leung, Y., C. Mei, and, W. Zhang Statistical tests for spatial nonstationarity based on the geographically weighted regression model. Environment and Planning A 32: Nersesian, W.S Infant Mortality in Socially Vulnerable Populations. Annual Review of Public Health 9: Newland, K Infant Mortality and the Health of Societies. Washington, DC: Worldwatch Institute. R Development Core Team (2008) R: A Language and Environment for Statistical Computing ed. Vienna, Austria, R Foundation for Statistical Computing. Singh, G.K. and S.M. Yu Infant Mortality in the United States: Trends, Differentials, and Projections, 1950 through Health Services Research 85(7):
Jun Tu. Department of Geography and Anthropology Kennesaw State University
 Examining Spatially Varying Relationships between Preterm Births and Ambient Air Pollution in Georgia using Geographically Weighted Logistic Regression Jun Tu Department of Geography and Anthropology Kennesaw
Explorative Spatial Analysis of Coastal Community Incomes in Setiu Wetlands: Geographically Weighted Regression
 Explorative Spatial Analysis of Coastal Community Incomes in Setiu Wetlands: Geographically Weighted Regression Z. Syerrina 1, A.R. Naeim, L. Muhamad Safiih 3 and Z. Nuredayu 4 1,,3,4 School of Informatics
Assessing Social Vulnerability to Biophysical Hazards. Dr. Jasmine Waddell
 Assessing Social Vulnerability to Biophysical Hazards Dr. Jasmine Waddell About the Project Built on a need to understand: The pre-disposition of the populations in the SE to adverse impacts from disaster
Population Profiles
 U N D E R S T A N D I N G A N D E X P L O R I N G D E M O G R A P H I C C H A N G E MAPPING AMERICA S FUTURES, BRIEF 6 2000 2010 Population Profiles Atlanta, Las Vegas, Washington, DC, and Youngstown Allison
Using Spatial Statistics Social Service Applications Public Safety and Public Health
 Using Spatial Statistics Social Service Applications Public Safety and Public Health Lauren Rosenshein 1 Regression analysis Regression analysis allows you to model, examine, and explore spatial relationships,
Daniel Fuller Lise Gauvin Yan Kestens
 Examining the spatial distribution and relationship between support for policies aimed at active living in transportation and transportation behavior Daniel Fuller Lise Gauvin Yan Kestens Introduction
Social Vulnerability Index. Susan L. Cutter Department of Geography, University of South Carolina
 Social Vulnerability Index Susan L. Cutter Department of Geography, University of South Carolina scutter@sc.edu Great Lakes and St. Lawrence Cities Initiative Webinar December 3, 2014 Vulnerability The
Summary Article: Poverty from Encyclopedia of Geography
 Topic Page: Poverty Definition: poverty from Dictionary of Energy Social Issues. the fact of being poor; the absence of wealth. A term with a wide range of interpretations depending on which markers of
ESRI 2008 Health GIS Conference
 ESRI 2008 Health GIS Conference An Exploration of Geographically Weighted Regression on Spatial Non- Stationarity and Principal Component Extraction of Determinative Information from Robust Datasets A
Neighborhood social characteristics and chronic disease outcomes: does the geographic scale of neighborhood matter? Malia Jones
 Neighborhood social characteristics and chronic disease outcomes: does the geographic scale of neighborhood matter? Malia Jones Prepared for consideration for PAA 2013 Short Abstract Empirical research
Medical GIS: New Uses of Mapping Technology in Public Health. Peter Hayward, PhD Department of Geography SUNY College at Oneonta
 Medical GIS: New Uses of Mapping Technology in Public Health Peter Hayward, PhD Department of Geography SUNY College at Oneonta Invited research seminar presentation at Bassett Healthcare. Cooperstown,
Running head: GEOGRAPHICALLY WEIGHTED REGRESSION 1. Geographically Weighted Regression. Chelsey-Ann Cu GEOB 479 L2A. University of British Columbia
 Running head: GEOGRAPHICALLY WEIGHTED REGRESSION 1 Geographically Weighted Regression Chelsey-Ann Cu 32482135 GEOB 479 L2A University of British Columbia Dr. Brian Klinkenberg 9 February 2018 GEOGRAPHICALLY
This report details analyses and methodologies used to examine and visualize the spatial and nonspatial
 Analysis Summary: Acute Myocardial Infarction and Social Determinants of Health Acute Myocardial Infarction Study Summary March 2014 Project Summary :: Purpose This report details analyses and methodologies
Spatial Disparities in the Distribution of Parks and Green Spaces in the United States
 March 11 th, 2012 Active Living Research Conference Spatial Disparities in the Distribution of Parks and Green Spaces in the United States Ming Wen, Ph.D., University of Utah Xingyou Zhang, Ph.D., CDC
Abstract Teenage Employment and the Spatial Isolation of Minority and Poverty Households Using micro data from the US Census, this paper tests the imp
 Teenage Employment and the Spatial Isolation of Minority and Poverty Households by Katherine M. O'Regan Yale School of Management and John M. Quigley University of California Berkeley I II III IV V Introduction
Spatial Analysis Of Inequity: Methods, Models, and Case Studies Jayajit Chakraborty
 Spatial Analysis Of Inequity: Methods, Models, and Case Studies Jayajit Chakraborty Professor of Geography Department of Sociology and Anthropology University of Texas at El Paso El Paso, Texas, USA jchakraborty@utep.edu
Environmental Analysis, Chapter 4 Consequences, and Mitigation
 Environmental Analysis, Chapter 4 4.17 Environmental Justice This section summarizes the potential impacts described in Chapter 3, Transportation Impacts and Mitigation, and other sections of Chapter 4,
The Empirical Study of Rail Transit Impacts on Land Value in Developing Countries: A Case Study in Bangkok, Thailand
 The Empirical Study of Rail Transit Impacts on Land Value in Developing Countries: A Case Study in Bangkok, Thailand Sathita MALAITHAM 1, Dai NAKAGAWA 2, Ryoji MATSUNAKA 3 and Testsuharu OBA 4 1 Doctoral
Spatial segregation and socioeconomic inequalities in health in major Brazilian cities. An ESRC pathfinder project
 Spatial segregation and socioeconomic inequalities in health in major Brazilian cities An ESRC pathfinder project Income per head and life-expectancy: rich & poor countries Source: Wilkinson & Pickett,
Spatial Variation in Infant Mortality with Geographically Weighted Poisson Regression (GWPR) Approach
 Approach") Spatial Variation in Infant Mortality with Geographically Weighted Poisson Regression (GWPR) Approach Kristina Pestaria Sinaga, Manuntun Hutahaean 2, Petrus Gea 3 1, 2, 3 University of Sumatera Utara,
Spatial Variation in Infant Mortality with Geographically Weighted Poisson Regression (GWPR) Approach Kristina Pestaria Sinaga, Manuntun Hutahaean 2, Petrus Gea 3 1, 2, 3 University of Sumatera Utara,
Maggie M. Kovach. Department of Geography University of North Carolina at Chapel Hill
 Maggie M. Kovach Department of Geography University of North Carolina at Chapel Hill Rationale What is heat-related illness? Why is it important? Who is at risk for heat-related illness and death? Urban
GIS in Locating and Explaining Conflict Hotspots in Nepal
 GIS in Locating and Explaining Conflict Hotspots in Nepal Lila Kumar Khatiwada Notre Dame Initiative for Global Development 1 Outline Brief background Use of GIS in conflict study Data source Findings
Spatial Variation in Local Road Pedestrian and Bicycle Crashes
 2015 Esri International User Conference July 20 24, 2015 San Diego, California Spatial Variation in Local Road Pedestrian and Bicycle Crashes Musinguzi, Abram, Graduate Research Assistant Chimba,Deo, PhD.,
DIFFERENT INFLUENCES OF SOCIOECONOMIC FACTORS ON THE HUNTING AND FISHING LICENSE SALES IN COOK COUNTY, IL
 DIFFERENT INFLUENCES OF SOCIOECONOMIC FACTORS ON THE HUNTING AND FISHING LICENSE SALES IN COOK COUNTY, IL Xiaohan Zhang and Craig Miller Illinois Natural History Survey University of Illinois at Urbana
Community Health Needs Assessment through Spatial Regression Modeling
 Community Health Needs Assessment through Spatial Regression Modeling Glen D. Johnson, PhD CUNY School of Public Health glen.johnson@lehman.cuny.edu Objectives: Assess community needs with respect to particular
Tracey Farrigan Research Geographer USDA-Economic Research Service
 Rural Poverty Symposium Federal Reserve Bank of Atlanta December 2-3, 2013 Tracey Farrigan Research Geographer USDA-Economic Research Service Justification Increasing demand for sub-county analysis Policy
NEW YORK DEPARTMENT OF SANITATION. Spatial Analysis of Complaints
 NEW YORK DEPARTMENT OF SANITATION Spatial Analysis of Complaints Spatial Information Design Lab Columbia University Graduate School of Architecture, Planning and Preservation November 2007 Title New York
Does city structure cause unemployment?
 The World Bank Urban Research Symposium, December 15-17, 2003 Does city structure cause unemployment? The case study of Cape Town Presented by Harris Selod (INRA and CREST, France) Co-authored with Sandrine
ARIC Manuscript Proposal # PC Reviewed: _9/_25_/06 Status: A Priority: _2 SC Reviewed: _9/_25_/06 Status: A Priority: _2
 ARIC Manuscript Proposal # 1186 PC Reviewed: _9/_25_/06 Status: A Priority: _2 SC Reviewed: _9/_25_/06 Status: A Priority: _2 1.a. Full Title: Comparing Methods of Incorporating Spatial Correlation in
Environmental Justice and the Environmental Protection Agency s Superfund Program
 Environmental Justice and the Environmental Protection Agency s Superfund Program Brian Alt Advance GIS 26 April 2011 Introduction In the late 1970 s the Environmental Protection Agency, the United States
Rencontres de l Hôtel Dieu Paris,12-13 mai C. Padilla, B Lalloue, D Zmirou-Navier, S Deguen
 Association of Proximity to Polluting Industries, Deprivation and Infant Mortality - A spatial analysis using census data Lille metropolitan Area France 1,2,4 1,4 1,2,3,4 1,2 C. Padilla, B Lalloue, D Zmirou-Navier,
AS Population Change Question spotting
 AS Change Question spotting Changing rate of growth How the rate of growth has changed over the last 100 years Explain the reasons for these changes Describe global or national distribution. Study the
CHAPTER 2: KEY ISSUE 1 Where Is the World s Population Distributed? p
 CHAPTER 2: KEY ISSUE 1 Where Is the World s Population Distributed? p. 45-49 Always keep your vocabulary packet out whenever you take notes. As the term comes up in the text, add to your examples for the
Mapping Communities of Opportunity in New Orleans
 Mapping Communities of Opportunity in New Orleans December 11, 2009 Samir Gambhir Senior Research Associate Kirwan Institute for the study of Race and Ethnicity The Ohio State University Gambhir.2@osu.edu
Keywords: Air Quality, Environmental Justice, Vehicle Emissions, Public Health, Monitoring Network
 NOTICE: this is the author s version of a work that was accepted for publication in Transportation Research Part D: Transport and Environment. Changes resulting from the publishing process, such as peer
Exploring the Association Between Family Planning and Developing Telecommunications Infrastructure in Rural Peru
 Exploring the Association Between Family Planning and Developing Telecommunications Infrastructure in Rural Peru Heide Jackson, University of Wisconsin-Madison September 21, 2011 Abstract This paper explores
Katherine J. Curtis 1, Heather O Connell 1, Perla E. Reyes 2, and Jun Zhu 1. University of Wisconsin-Madison 2. University of California-Santa Cruz
 Disentangling the Spatial Concentration and Temporal Stickiness of Poverty: Industrial Structure, Racial/Ethnic Composition, and the Complex Links to Poverty Katherine J. Curtis 1, Heather O Connell 1,
Modeling the Ecology of Urban Inequality in Space and Time
 Modeling the Ecology of Urban Inequality in Space and Time Corina Graif PhD Candidate, Department Of Sociology Harvard University Presentation for the Workshop on Spatial and Temporal Modeling, Center
CRP 608 Winter 10 Class presentation February 04, Senior Research Associate Kirwan Institute for the Study of Race and Ethnicity
 CRP 608 Winter 10 Class presentation February 04, 2010 SAMIR GAMBHIR SAMIR GAMBHIR Senior Research Associate Kirwan Institute for the Study of Race and Ethnicity Background Kirwan Institute Our work Using
Urban Studies June 1998 v35 n7 p1187(19) Page 1
 Page 1") Urban Studies June 1998 v35 n7 p1187(19) Page 1 by Katherine M. O Regan and John M. Quigley This paper synthesises a series of empirical analyses investigating the role of urban space in affecting minority
Urban Studies June 1998 v35 n7 p1187(19) Page 1 by Katherine M. O Regan and John M. Quigley This paper synthesises a series of empirical analyses investigating the role of urban space in affecting minority
Apéndice 1: Figuras y Tablas del Marco Teórico
 Apéndice 1: Figuras y Tablas del Marco Teórico FIGURA A.1.1 Manufacture poles and manufacture regions Poles: Share of employment in manufacture at least 12% and population of 250,000 or more. Regions:
Do the Causes of Poverty Vary by Neighborhood Type?
 Do the Causes of Poverty Vary by Neighborhood Type? Suburbs and the 2010 Census Conference Uday Kandula 1 and Brian Mikelbank 2 1 Ph.D. Candidate, Maxine Levin College of Urban Affairs Cleveland State
Death by Segregation: Does the dimension of racial segregation matter? 1
 Death by Segregation: Does the dimension of racial segregation matter? 1 Tse-Chuan Yang, Ph.D. Department of Sociology Center for Social and Demographic Analysis University at Albany, State University
Lecture (chapter 13): Association between variables measured at the interval-ratio level
: Association between variables measured at the interval-ratio level") Lecture (chapter 13): Association between variables measured at the interval-ratio level Ernesto F. L. Amaral April 9 11, 2018 Advanced Methods of Social Research (SOCI 420) Source: Healey, Joseph F. 2015.
Lecture (chapter 13): Association between variables measured at the interval-ratio level Ernesto F. L. Amaral April 9 11, 2018 Advanced Methods of Social Research (SOCI 420) Source: Healey, Joseph F. 2015.
DEVELOPING DECISION SUPPORT TOOLS FOR THE IMPLEMENTATION OF BICYCLE AND PEDESTRIAN SAFETY STRATEGIES
 DEVELOPING DECISION SUPPORT TOOLS FOR THE IMPLEMENTATION OF BICYCLE AND PEDESTRIAN SAFETY STRATEGIES Deo Chimba, PhD., P.E., PTOE Associate Professor Civil Engineering Department Tennessee State University
Module 10 Summative Assessment
 Module 10 Summative Assessment Activity In this activity you will use the three dimensions of vulnerability that you learned about in this module exposure, sensitivity, and adaptive capacity to assess
Demographic Data in ArcGIS. Harry J. Moore IV
 Demographic Data in ArcGIS Harry J. Moore IV Outline What is demographic data? Esri Demographic data - Real world examples with GIS - Redistricting - Emergency Preparedness - Economic Development Next
In matrix algebra notation, a linear model is written as
 DM3 Calculation of health disparity Indices Using Data Mining and the SAS Bridge to ESRI Mussie Tesfamicael, University of Louisville, Louisville, KY Abstract Socioeconomic indices are strongly believed
Integrating GIS into Food Access Analysis
 GIS Day at Kansas University Integrating GIS into Food Access Analysis Daoqin Tong School of Geography and Development Outline Introduction Research questions Method Results Discussion Introduction Food
Exploratory Spatial Data Analysis (ESDA)
") Exploratory Spatial Data Analysis (ESDA) VANGHR s method of ESDA follows a typical geospatial framework of selecting variables, exploring spatial patterns, and regression analysis. The primary software
Exploratory Spatial Data Analysis (ESDA) VANGHR s method of ESDA follows a typical geospatial framework of selecting variables, exploring spatial patterns, and regression analysis. The primary software
Spatial Trends of unpaid caregiving in Ireland
 Spatial Trends of unpaid caregiving in Ireland Stamatis Kalogirou 1,*, Ronan Foley 2 1. NCG Affiliate, Thoukididi 20, Drama, 66100, Greece; Tel: +30 6977 476776; Email: skalogirou@gmail.com; Web: http://www.gisc.gr.
Regional Performance Measures
 G Performance Measures Regional Performance Measures Introduction This appendix highlights the performance of the MTP/SCS for 2035. The performance of the Revenue Constrained network also is compared to
Regional Performance Measures
 G Performance Measures Regional Performance Measures Introduction This appendix highlights the performance of the MTP/SCS for 2035. The performance of the Revenue Constrained network also is compared to
2014 Planning Database (PDB)
") 2014 Planning Database (PDB) November 19, 2014 Barbara O Hare, Nancy Bates, Julia Coombs, Travis Pape, Chandra Erdman Office of Survey Analytics 1 Overview Tract and Block Group PDBs Useful for: Identifying
2014 Planning Database (PDB) November 19, 2014 Barbara O Hare, Nancy Bates, Julia Coombs, Travis Pape, Chandra Erdman Office of Survey Analytics 1 Overview Tract and Block Group PDBs Useful for: Identifying
 Table 1. Answers to income and consumption adequacy questions Percentage of responses: less than adequate more than adequate adequate Total income 68.7% 30.6% 0.7% Food consumption 46.6% 51.4% 2.0% Clothing
BUILDING SOUND AND COMPARABLE METRICS FOR SDGS: THE CONTRIBUTION OF THE OECD DATA AND TOOLS FOR CITIES AND REGIONS
 BUILDING SOUND AND COMPARABLE METRICS FOR SDGS: THE CONTRIBUTION OF THE OECD DATA AND TOOLS FOR CITIES AND REGIONS STATISTICAL CAPACITY BUILDING FOR MONITORING OF SUSTAINABLE DEVELOPMENT GOALS Lukas Kleine-Rueschkamp
(Department of Urban and Regional planning, Sun Yat-sen University, Guangzhou , China)
") DOI:10.13959/j.issn.1003-2398.2008.05.001 :1003-2398(2008)05-0061-06, (, 510275) RESIDENTIAL SEGREGATION OF FLOATING POPULATION AND DRIVING FORCES IN GUANGZHOU CITY YUAN Yuan, XU Xue-qiang (Department
DOI:10.13959/j.issn.1003-2398.2008.05.001 :1003-2398(2008)05-0061-06, (, 510275) RESIDENTIAL SEGREGATION OF FLOATING POPULATION AND DRIVING FORCES IN GUANGZHOU CITY YUAN Yuan, XU Xue-qiang (Department
Responding to Natural Hazards: The Effects of Disaster on Residential Location Decisions and Health Outcomes
 Responding to Natural Hazards: The Effects of Disaster on Residential Location Decisions and Health Outcomes James Price Department of Economics University of New Mexico April 6 th, 2012 1 Introduction
Migration Modelling using Global Population Projections
 Migration Modelling using Global Population Projections Bryan Jones CUNY Institute for Demographic Research Workshop on Data and Methods for Modelling Migration Associated with Climate Change 5 December
Geospatial Analysis of Job-Housing Mismatch Using ArcGIS and Python
 Geospatial Analysis of Job-Housing Mismatch Using ArcGIS and Python 2016 ESRI User Conference June 29, 2016 San Diego, CA Jung Seo, Frank Wen, Simon Choi and Tom Vo, Research & Analysis Southern California
CSISS Tools and Spatial Analysis Software
 CSISS Tools and Spatial Analysis Software June 5, 2006 Stephen A. Matthews Associate Professor of Sociology & Anthropology, Geography and Demography Director of the Geographic Information Analysis Core
Travel behavior of low-income residents: Studying two contrasting locations in the city of Chennai, India
 Travel behavior of low-income residents: Studying two contrasting locations in the city of Chennai, India Sumeeta Srinivasan Peter Rogers TRB Annual Meet, Washington D.C. January 2003 Environmental Systems,
ESTIMATE THE REGRESSION COEFFICIENTS OF VARIABLES SPL. REFERENCE TO FERTILITY
 ESTIMATE THE REGRESSION COEFFICIENTS OF VARIABLES SPL. REFERENCE TO FERTILITY *Poonam Kumari, # Dr. Mukesh Joshi Research Scholar, Dept. of Mathematics, CMJ University, Shillong, Meghalaya HOD Department
Guilty of committing ecological fallacy?
 GIS: Guilty of committing ecological fallacy? David W. Wong Professor Geography and GeoInformation Science George Mason University dwong2@gmu.edu Ecological Fallacy (EF) Many slightly different definitions
Links between socio-economic and ethnic segregation at different spatial scales: a comparison between The Netherlands and Belgium
 Links between socio-economic and ethnic segregation at different spatial scales: a comparison between The Netherlands and Belgium Bart Sleutjes₁ & Rafael Costa₂ ₁ Netherlands Interdisciplinary Demographic
BROOKINGS May
 Appendix 1. Technical Methodology This study combines detailed data on transit systems, demographics, and employment to determine the accessibility of jobs via transit within and across the country s 100
Agent Models and Demographic Research. Robert D. Mare December 7, 2007
 Agent Models and Demographic Research Robert D. Mare December 7, 2007 Agent Modeling vs. Business as Usual in Demographic Research Agent models are inherently more complex than standard multivariate models
Inclusion of Non-Street Addresses in Cancer Cluster Analysis
 Inclusion of Non-Street Addresses in Cancer Cluster Analysis Sue-Min Lai, Zhimin Shen, Darin Banks Kansas Cancer Registry University of Kansas Medical Center KCR (Kansas Cancer Registry) KCR: population-based
Impact of Metropolitan-level Built Environment on Travel Behavior
 Impact of Metropolitan-level Built Environment on Travel Behavior Arefeh Nasri 1 and Lei Zhang 2,* 1. Graduate Research Assistant; 2. Assistant Professor (*Corresponding Author) Department of Civil and
Population Research Center (PRC) Oregon Population Forecast Program
 Oregon Population Forecast Program") Population Research Center (PRC) Oregon Population Forecast Program 2013 Oregon League of Cities Conference Risa S. Proehl Jason R. Jurjevich, Ph.D. Population Research Center (PRC) Population Research
Population Research Center (PRC) Oregon Population Forecast Program 2013 Oregon League of Cities Conference Risa S. Proehl Jason R. Jurjevich, Ph.D. Population Research Center (PRC) Population Research
Globally Estimating the Population Characteristics of Small Geographic Areas. Tom Fitzwater
 Globally Estimating the Population Characteristics of Small Geographic Areas Tom Fitzwater U.S. Census Bureau Population Division What we know 2 Where do people live? Difficult to measure and quantify.
A Framework for the Study of Urban Health. Abdullah Baqui, DrPH, MPH, MBBS Johns Hopkins University
 This work is licensed under a Creative Commons Attribution-NonCommercial-ShareAlike License. Your use of this material constitutes acceptance of that license and the conditions of use of materials on this
Toxic Wastes and Race at Twenty:
 Chapter 3 Racial and Socioeconomic Disparities in the Distribution of Environmental Hazards: Assessing the Evidence Twenty Years after Toxic Wastes and Race* The publication in 1987 of the United Church
Modeling the Spatial Effects on Demand Estimation of Americans with Disabilities Act Paratransit Services
 Modeling the Spatial Effects on Demand Estimation of Americans with Disabilities Act Paratransit Services Pei-Fen Kuo, Chung-Wei Shen, and Luca Quadrifoglio A reliable method for predicting paratransit
Electronic Journal of Sociology (2007)
") Electronic Journal of Sociology (2007) ISSN: 1198 3655 Economic restructuring and socioeconomic outcomes in metropolitan and nonmetropolitan counties Don E. Albrecht Rural Sociology and Community Studies
Electronic Journal of Sociology (2007) ISSN: 1198 3655 Economic restructuring and socioeconomic outcomes in metropolitan and nonmetropolitan counties Don E. Albrecht Rural Sociology and Community Studies
AP Human Geography Free-response Questions
 AP Human Geography Free-response Questions 2000-2010 2000-preliminary test 1. A student concludes from maps of world languages and religions that Western Europe has greater cultural diversity than the
TUESDAYS AT APA PLANNING AND HEALTH. SAGAR SHAH, PhD AMERICAN PLANNING ASSOCIATION SEPTEMBER 2017 DISCUSSING THE ROLE OF FACTORS INFLUENCING HEALTH
 SAGAR SHAH, PhD sshah@planning.org AMERICAN PLANNING ASSOCIATION SEPTEMBER 2017 TUESDAYS AT APA PLANNING AND HEALTH DISCUSSING THE ROLE OF FACTORS INFLUENCING HEALTH Outline of the Presentation PLANNING
Application of Indirect Race/ Ethnicity Data in Quality Metric Analyses
 Background The fifteen wholly-owned health plans under WellPoint, Inc. (WellPoint) historically did not collect data in regard to the race/ethnicity of it members. In order to overcome this lack of data
Spatial Analysis 1. Introduction
 Spatial Analysis 1 Introduction Geo-referenced Data (not any data) x, y coordinates (e.g., lat., long.) ------------------------------------------------------ - Table of Data: Obs. # x y Variables -------------------------------------
The Cost of Transportation : Spatial Analysis of US Fuel Prices
 The Cost of Transportation : Spatial Analysis of US Fuel Prices J. Raimbault 1,2, A. Bergeaud 3 juste.raimbault@polytechnique.edu 1 UMR CNRS 8504 Géographie-cités 2 UMR-T IFSTTAR 9403 LVMT 3 Paris School
Spatial Regression Modeling
 Spatial Regression Modeling Paul Voss & Katherine Curtis The Center for Spatially Integrated Social Science Santa Barbara, CA July 12-17, 2009 Day 4 Plan for today Focus on spatial heterogeneity A bit
Understanding Your Community A Guide to Data
 Understanding Your Community A Guide to Data Alex Lea September 2013 Research and Insight Team LeicestershireCounty Council Understanding Geographies Important to understand the various geographies that
DO NOT CITE WITHOUT AUTHOR S PERMISSION:
 Study Context & Purpose Prior to the 2013-14 school year a Tennessee policy went into effect such that a teacher s level of effectiveness (LOE) and certification status determined their minimum number
Assessing Environmental Equity Related to Local Air Pollution in Tampa, FL
 Assessing Environmental Equity Related to Local Air Pollution in Tampa, FL Extended Abstract #466 Amy L. Stuart, Michelle Zeager, and Noreen D. Poor University of South Florida, 13201 Bruce B. Downs Blvd.,
Geozones: an area-based method for analysis of health outcomes
 Statistics Canada www.statcan.gc.ca Geozones: an area-based method for analysis of health outcomes CIQSS Montreal, Quebec October 19, 2012 Paul A. Peters, PhD Health Analysis Division, Statistics Canada
WHAT IS HETEROSKEDASTICITY AND WHY SHOULD WE CARE?
 1 WHAT IS HETEROSKEDASTICITY AND WHY SHOULD WE CARE? For concreteness, consider the following linear regression model for a quantitative outcome (y i ) determined by an intercept (β 1 ), a set of predictors
Urban GIS for Health Metrics
 Urban GIS for Health Metrics Dajun Dai Department of Geosciences, Georgia State University Atlanta, Georgia, United States Presented at International Conference on Urban Health, March 5 th, 2014 People,
Measuring Disaster Risk for Urban areas in Asia-Pacific
 Measuring Disaster Risk for Urban areas in Asia-Pacific Acknowledgement: Trevor Clifford, Intl Consultant 1 SDG 11 Make cities and human settlements inclusive, safe, resilient and sustainable 11.1: By
Secondary Towns and Poverty Reduction: Refocusing the Urbanization Agenda
 Secondary Towns and Poverty Reduction: Refocusing the Urbanization Agenda Luc Christiaensen and Ravi Kanbur World Bank Cornell Conference Washington, DC 18 19May, 2016 losure Authorized Public Disclosure
Dr Arulsivanathan Naidoo Statistics South Africa 18 October 2017
 ESRI User Conference 2017 Space Time Pattern Mining Analysis of Matric Pass Rates in Cape Town Schools Dr Arulsivanathan Naidoo Statistics South Africa 18 October 2017 Choose one of the following Leadership
Geographically weighted regression approach for origin-destination flows
 Geographically weighted regression approach for origin-destination flows Kazuki Tamesue 1 and Morito Tsutsumi 2 1 Graduate School of Information and Engineering, University of Tsukuba 1-1-1 Tennodai, Tsukuba,
Developing Spatial Data to Support Statistical Analysis of Education
 Developing Spatial Data to Support Statistical Analysis of Education Doug Geverdt National Center for Education Statistics Education Demographic and Geographic Estimates (EDGE) Program 2016 ESRI User Conference
APPENDIX V VALLEYWIDE REPORT
 APPENDIX V VALLEYWIDE REPORT Page Intentionally Left Blank 1.2 San Joaquin Valley Profile Geography The San Joaquin Valley is the southern portion of the Great Central Valley of California (Exhibit 1-1).
Everything is related to everything else, but near things are more related than distant things.
 SPATIAL ANALYSIS DR. TRIS ERYANDO, MA Everything is related to everything else, but near things are more related than distant things. (attributed to Tobler) WHAT IS SPATIAL DATA? 4 main types event data,
The System of Xiaokang Indicators: A Framework to Measure China's Progress
 Int. Statistical Inst.: Proc. 58th World Statistical Congress, 2011, Dublin (Session CPS020) p.6359 The System of Xiaokang Indicators: A Framework to Measure China's Progress Qingzhe Lv E-mail: lvqz@gj.stats.cn
The Rural Health Workforce. Policy Brief Series. Data and Issues for Policymakers in: Washington Wyoming Alaska Montana Idaho
 The Health Workforce Data and Issues for Policymakers in: Washington Wyoming Alaska Montana Idaho Policy Brief Series ISSUE #1: THE RURAL HEALTH WORKFORCE: CHALLENGES AND OPPORTUNITIES ISSUE #2: THE RURAL
The Church Demographic Specialists
 The Church Demographic Specialists Easy-to-Use Features Map-driven, Web-based Software An Integrated Suite of Information and Query Tools Providing An Insightful Window into the Communities You Serve Key
Spatial and Socioeconomic Analysis of Commuting Patterns in Southern California Using LODES, CTPP, and ACS PUMS
 Spatial and Socioeconomic Analysis of Commuting Patterns in Southern California Using LODES, CTPP, and ACS PUMS Census for Transportation Planning Subcommittee meeting TRB 95th Annual Meeting January 11,
SOCIO-DEMOGRAPHIC INDICATORS FOR REGIONAL POPULATION POLICIES
 SOCIO-DEMOGRAPHIC INDICATORS FOR REGIONAL POPULATION POLICIES A CANADIAN PERSPECTIVE Marc Termote Université de Montréal Potsdam, DART Conference, September 3, 2012 3 STEPS 1. Defining the problem 2. Identifying
Poverty and Hazard Linkages
 Poverty and Hazard Linkages Global Risk Identification Programme Proposal Development Coordination Meeting Friday, 19 May 2006 CIESIN Earth Institute Columbia University www.ciesin.columbia.edu Data Improvements