Agro Ecological Malaria Linkages in Uganda, A Spatial Probit Model:
|
|
|
- Clara Jenkins
- 5 years ago
- Views:
Transcription


1 Agro Ecological Malaria Linkages in Uganda, A Spatial Probit Model: IFPRI Project Title: Environmental management options and delivery mechanisms to reduce malaria transmission in Uganda Spatial Probit Research Team: Benjamin Wielgosz Timothy Thomas Edward Kato Thanks and Acknowledgment: This project is supported by the German Federal Ministry for Economic Cooperation and Development (BMZ) Deutsche Gesellschaft für Technische Zusammenarbeit (GTZ) GmbH.
2 Malaria Parasite Life Cycle

3 Ecology of Malaria

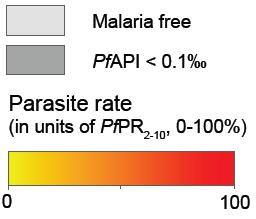
4 Malaria Atlas Project

5 Malaria is endemic in over 95% of the country, with the highest malaria transmission intensities in the world. Uganda as a Study Site UNHS 2005 Malaria Prevalence Uganda has the world s highest malaria incidence, with a rate of 478 cases per 1000 population per year & is the leading cause of morbidity and mortality in Uganda.


6 Self Reported Malaria Incidence in previous 30 days (UNHS 2005/06 Data)

7 Agro Ecological Linkages Identified in Literature Social Economic Status / Rural Development Land Use and Land Management Water Management Alternating Wet Dry Irrigation Wetland Cultivation Canal Based Irrigation Systems Rice Maize Cotton Pesticide Intensive Agriculture Agro Forestry Natural Ecology (Land Cover)


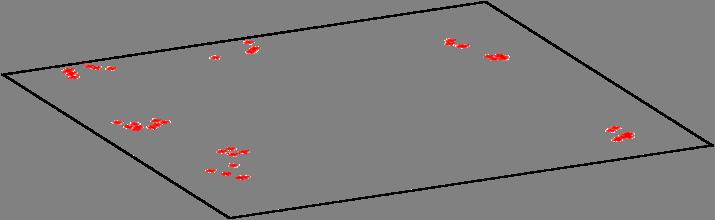
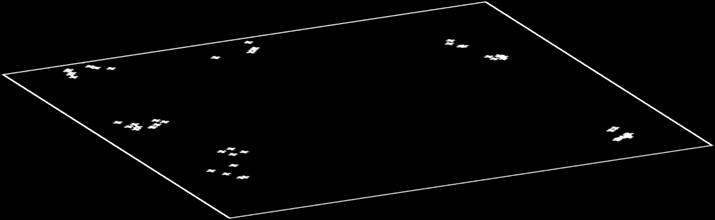
8 Spatial Auto Correlation: Household Coordinates Agricultural Parcel Coordinates, 3KM Neighborhood Land Cover Type within 3km
 Bayesian Spatial Probit uses a single global model, but accounts for spatial clustering within the coefficients and the error term.")
9 Binary Outcome Variable malaria is either true or false Probit or Logit James LeSage has described the mathematics for spatial dependency and spatial error in probit models. (available free on the webhttp:// econometrics.com/ ) Bayesian Spatial Probit uses a single global model, but accounts for spatial clustering within the coefficients and the error term. Spatial Effects: Clustering affects the coefficients and p values. Spatial Error: when the clustering arises in the error term
10 Moran s I: This test determined that the spatial variation in the correlations could not be random. Spatial Weights Matrix: We need a matrix which relates the individuals to their neighbors using the distance values. BUT we have a dataset of 41,139 potential neighbors that means our matrix has to store 1.7 billion values. At 8 bits per value, that requires 1.7 GB of memory just to store the matrix. To perform calculations, we need a Sparse Matrix which does not store values for individuals who are not neighbors. Unfortunately, ArcGIS does not use this matrix type which requires us to look into alternatives. Geographically Weighted Regression: GWR could be expanded so that variance in coefficients and p values could be mapped. But GWR can t be used for probit / logit models
 Probit Moran's Index: 0.039546 Moran's Index: 0.018786 Expected Index: 0.")
11 Spatial Auto- Correlation: The Moran s I test for spatial auto-correlation indicates that there are significant local clustering effects present in the coefficients evaluated in the global regressions. Global Moran's I Summary for Tobit Global Moran's I Summary for of Ln (HH Malaria Proportion) Probit Moran's Index: Moran's Index: Expected Index: Expected Index: Variance: Variance: z score: z score: p value: p value: Given the z score of 7.32, there is a less than 1% likelihood that this clustered pattern could be the result of random chance. Given the z score of 25.86, there is a less than 1% likelihood that this clustered pattern could be the result of random chance. This confirms that there is clustered local variation present in the data which can explain the weak coefficients in the global regressions. The spatial probit model may address localized contributors to transmission that cannot be detected with non-spatial

12 Timothy Thomas has programmed a sparse matrix tool and spatial probit using R and translated it for Matlab: Matlab had to be run on a 64 bit PC with 16 GB of memory to calculate the spatial weights matrix and model in about 12 hours using a 100 GB page file.
13 Results Individual Level Variables Household Level Variables Agricultural Parcel Level Variables (as an aggregation of cultivatedareas within 3km of household) Land Cover Types within 3km of Household Effects are relative to the "Cropland Natural Vegetation Mosaic Linear Probit Model Bayesian Probit Model (No Spatial Bayesian Probit Model (Spatial Lag Effects) and Error Effects) malaria Coef. z P > z Parameter_Est T TestParameter_Est T Test nodata gender months_resident_of age underfive highestgradecompleted ave_parent_ed hoursworked_last7days serious_disability bednet_lastnight itn_bednet hhh_gender urban totalhexp30d total_consumption_exp_ house_flat total_rooms natural_unimproved_watersource minutes_waiting_watersource chickens cattle pigs ave_parcel_size_ha pesticide maize_improved maize_local banana_improved banana_local coffee_improved coffee_local rice treecrops improved_pasture local_pasture gc14 Rainfed croplands gc40 Closed to open (>15%) broadleaved (evergreen or deciduous) forest gc50 Closed (>40%) broadleaved deciduous forest gc60 Open (15 40%) broadleaved deciduous forest gc70 Closed (>40%) needleleaved evergreen forest gc90 Open (15 40%) needleleaved (evergreen or deciduous) forest gc100 Closed to open (>15%) mixed broadleaved and needleleaved forest gc110 Mosaic grassland (20 50%) / forest or shrubland (50 70%) gc120 Mosaic grassland (50 70%) / forest or shrubland (20 50%) gc130 Closed to open (>15%) shrubland gc140 Closed to open (>15%) grassland, savannas (herbaceous vegetation) gc150 Sparse (<15%) vegetation gc160 Closed to open (>15%) broadleaved forest regularly flooded gc170 Closed (>40%) broadleaved forest permanently flooded gc180 Closed to open (>15%) herbaceous vegetation regularly flooded gc190 Artificial surfaces (Urban areas >50%) gc200 Bare areas gc210 Water bodies

14 Socio Economic Determinants Wealth and Education Wealthier households (as measured through consumption) are less at risk of malaria Wealthier households (as measured through size of home) are less at risk of malaria Better Educated Household member report less malaria Vulnerability within Households Female Headed Households are more likely to report malaria Children Under 5 are the most at risk family members The more elderly are more likely to report malaria Serious Disability Increases Malaria risk Longer resident household members report more malaria


15 Elimination of False Positives UNHS Variables: Women are more likely to report malaria (Female = 0, Male = 1) Longer working hours increase malaria risk Urban households were less at risk of malaria than rural households Pig Farmers were more likely to report malaria GlobCover 2005 Variables: Open Broadleafed Forests were associated with lower malaria reporting Closed to open (>15%) shrubland was eliminated as a possible determinant through spatial controls. Flooded Broadleafed Forests were associated with lower malaria reporting Bare Areas were associated with higher malaria reporting

16 Agro Ecological Relationships Water Collection as a task and longer waiting times at water collection sources is associated with higher malaria risk Chicken Farmers are less likely to report malaria Small holder household are more likely to report malaria Higher pesticide usage is associated with higher malaria levels: this could be in response to living in an insect friendly environment or due to increase resistance of mosquitos to pesticides reducing the efficacy of bednets. Cultivation of local banana varieties was associated with lower malaria reporting Open Water bodies were associated with lower malaria reporting.
 WARNING: Reverse Causality!")

17 Those using bednets are reporting more malaria (bednet use is a response to high malaria risk) Higher levels of health expenditure in the past month are associated with higher malaria risk (possibly in response to malaria episodes) WARNING: Reverse Causality! Higher pesticide usage is associated with higher malaria levels: this could be in response to living in an insect friendly environment or due to increase resistance of mosquitoes to pesticides reducing the efficacy of bednets. Open Water bodies were associated with lower malaria reporting.


18 Health GIS Lessons Learned 1. Binary Outcome Models need to be developed to the level of GWR for many health analyses 2. Models need to control for spatial effects & errors or they can lead to false conclusions, due to clustering effects. 3. Spiders Nelson and Jackson 2006.
19 ArcGIS Wish List: Add Spatial Probit or Binary Outcome GWR to increase statistical analysis options. Integrate sparse matrices to allow for larger & faster algebraic calculations. Lift Memory Constraints, particularly for the 64 bit environment to access continuous blocks of memory > 2GB.
Maggie M. Kovach. Department of Geography University of North Carolina at Chapel Hill
 Maggie M. Kovach Department of Geography University of North Carolina at Chapel Hill Rationale What is heat-related illness? Why is it important? Who is at risk for heat-related illness and death? Urban
Introduction to risk assessment
 Introduction to risk assessment Inception workshop of the project Strengthening the regional preparedness, prevention and response against lumpy skin disease in Belarus, Moldova and Ukraine (TCP/RER/3605)
Global Land Cover Mapping
 Global Land Cover Mapping and its application in SDGs Prof. Chen Jun 1, Dr. He Chaoying 2 1 National Geomatics Center of China (NGCC) 2 Ministry of Natural Resources, P.R.China May 30, 2018, Copenhagen
Urbanization, Land Cover, Weather, and Incidence Rates of Neuroinvasive West Nile Virus Infections In Illinois
 Urbanization, Land Cover, Weather, and Incidence Rates of Neuroinvasive West Nile Virus Infections In Illinois JUNE 23, 2016 H ANNAH MATZ KE Background Uganda 1937 United States -1999 New York Quickly
Extent. Level 1 and 2. October 2017
 Extent Level 1 and 2 October 2017 Overview: Extent account 1. Learning objectives 2. Review of Level 0 (5m) 3. Level 1 (Compilers): Concepts (15m) Group exercise and discussion (15m) 4. Level 2 (Data Providers)
Land Accounts - The Canadian Experience
 Land Accounts - The Canadian Experience Development of a Geospatial database to measure the effect of human activity on the environment Who is doing Land Accounts Statistics Canada (national) Component
Jun Tu. Department of Geography and Anthropology Kennesaw State University
 Examining Spatially Varying Relationships between Preterm Births and Ambient Air Pollution in Georgia using Geographically Weighted Logistic Regression Jun Tu Department of Geography and Anthropology Kennesaw
ESRI 2008 Health GIS Conference
 ESRI 2008 Health GIS Conference An Exploration of Geographically Weighted Regression on Spatial Non- Stationarity and Principal Component Extraction of Determinative Information from Robust Datasets A
Apéndice 1: Figuras y Tablas del Marco Teórico
 Apéndice 1: Figuras y Tablas del Marco Teórico FIGURA A.1.1 Manufacture poles and manufacture regions Poles: Share of employment in manufacture at least 12% and population of 250,000 or more. Regions:
Patrick Leinenkugel. German Aerospace Center (DLR) Vortrag > Autor > Dokumentname > Datum
 Vortrag > Autor > Dokumentname > Datum") Characterisation of land surface phenology and land cover for the Mekong Basin on the basis of multitemporal and multispectral satellite data from the MODIS Sensor Patrick Leinenkugel German Aerospace
Characterisation of land surface phenology and land cover for the Mekong Basin on the basis of multitemporal and multispectral satellite data from the MODIS Sensor Patrick Leinenkugel German Aerospace
1Department of Demography and Organization Studies, University of Texas at San Antonio, One UTSA Circle, San Antonio, TX
 Well, it depends on where you're born: A practical application of geographically weighted regression to the study of infant mortality in the U.S. P. Johnelle Sparks and Corey S. Sparks 1 Introduction Infant
Cluster Analysis using SaTScan
 Cluster Analysis using SaTScan Summary 1. Statistical methods for spatial epidemiology 2. Cluster Detection What is a cluster? Few issues 3. Spatial and spatio-temporal Scan Statistic Methods Probability
In matrix algebra notation, a linear model is written as
 DM3 Calculation of health disparity Indices Using Data Mining and the SAS Bridge to ESRI Mussie Tesfamicael, University of Louisville, Louisville, KY Abstract Socioeconomic indices are strongly believed
Most people used to live like this
 Urbanization Most people used to live like this Increasingly people live like this. For the first time in history, there are now more urban residents than rural residents. Land Cover & Land Use Land cover
Ecological Land Cover Classification For a Natural Resources Inventory in the Kansas City Region, USA
 Ecological Land Cover Classification For a Natural Resources Inventory in the Kansas City Region, USA by Applied Ecological Services, Inc. In cooperation with the Mid-America Regional Council 600 Broadway,
Exploring the Association Between Family Planning and Developing Telecommunications Infrastructure in Rural Peru
 Exploring the Association Between Family Planning and Developing Telecommunications Infrastructure in Rural Peru Heide Jackson, University of Wisconsin-Madison September 21, 2011 Abstract This paper explores
Assessing the Regional Vulnerability of Large Scale Mining in Ghana: An Application of Multi Criteria Analysis
 Assessing the Regional Vulnerability of Large Scale Mining in Ghana: An Application of Multi Criteria Analysis Mukesh Subedee, GISDE 14 Arun Poojary, ES&P 13 Clark University April 29, 2013 Ghana: A case
Bayesian Hierarchical Models
 Bayesian Hierarchical Models Gavin Shaddick, Millie Green, Matthew Thomas University of Bath 6 th - 9 th December 2016 1/ 34 APPLICATIONS OF BAYESIAN HIERARCHICAL MODELS 2/ 34 OUTLINE Spatial epidemiology
Data Visualization and Evaluation
 Data Visualization and Evaluation Juan Paulo Ramírez, Ph.D. University of Nebraska 5th Annual Environmental Evaluators Networking Forum June 2010 Purpose and Objectives Purpose Introduce to program evaluators
Land accounting in Québec: Pilot project for a sub-provincial area
 Land accounting in Québec: Pilot project for a sub-provincial area Stéphanie Uhde 8th meeting of the London Group on Environmental Accounting Ottawa, 2 October, 2012 Province of Québec Area: 1 667 441
Tracey Farrigan Research Geographer USDA-Economic Research Service
 Rural Poverty Symposium Federal Reserve Bank of Atlanta December 2-3, 2013 Tracey Farrigan Research Geographer USDA-Economic Research Service Justification Increasing demand for sub-county analysis Policy
ADePT Software platform for Automated Economic Analysis
 ADePT Software platform for Automated Economic Analysis Michael Lokshin, Zurab Sajaia and Sergiy Radyakin DECRG-PO The World Bank Step 1: Data and Output Step 2: Household variables Step 3: Individual
GIS in Locating and Explaining Conflict Hotspots in Nepal
 GIS in Locating and Explaining Conflict Hotspots in Nepal Lila Kumar Khatiwada Notre Dame Initiative for Global Development 1 Outline Brief background Use of GIS in conflict study Data source Findings
Measuring Poverty. Introduction
 Measuring Poverty Introduction To measure something, we need to provide answers to the following basic questions: 1. What are we going to measure? Poverty? So, what is poverty? 2. Who wants to measure
Socio-Economic Atlas of Tajikistan. The World Bank THE STATE STATISTICAL COMMITTEE OF THE REPUBLIC OF TAJIKISTAN
 Socio-Economic Atlas of Tajikistan The World Bank THE STATE STATISTICAL COMMITTEE OF THE REPUBLIC OF TAJIKISTAN 1) Background Why there is a need for socio economic atlas? Need for a better understanding
Poverty and Hazard Linkages
 Poverty and Hazard Linkages Global Risk Identification Programme Proposal Development Coordination Meeting Friday, 19 May 2006 CIESIN Earth Institute Columbia University www.ciesin.columbia.edu Data Improvements
Worldwide inventory of landscapes through segmentation of global land cover dataset
 Worldwide inventory of landscapes through segmentation of global land cover dataset J. Nowosad* 1 and T. F. Stepinski 1 1 University of Cincinnati, Cincinnati, OH, 45221, USA * Email: nowosad.jakub@gmail.com
Dataset Information: Land Cover. Title. Abstract. Supplemental. International Standards. Creation Date Last Update Data Type.
 Dataset Information: Land Cover Title Abstract Supplemental International Standards Land Cover The FAOSTAT Agri Environmental Indicators Land Cover domain contains data on area by land cover class, by
Pilot studies on the provision of harmonized land use/land cover statistics: Synergies between LUCAS and the national systems
 1 Pilot studies on the provision of harmonized land use/land cover statistics: Synergies between LUCAS and the national systems Norway Erik Engelien Division for Natural resources and Environmental Statistics,
 Table 1. Answers to income and consumption adequacy questions Percentage of responses: less than adequate more than adequate adequate Total income 68.7% 30.6% 0.7% Food consumption 46.6% 51.4% 2.0% Clothing
Geospatial Technologies for Resources Planning & Management
 Geospatial Technologies for Resources Planning & Management Lal Samarakoon, PhD Director, Geoinformatics Center Asian Institute of Technology, Thailand Content Geoinformatics for SDG Information Integration
Overlay Analysis II: Using Zonal and Extract Tools to Transfer Raster Values in ArcMap
 Overlay Analysis II: Using Zonal and Extract Tools to Transfer Raster Values in ArcMap Created by Patrick Florance and Jonathan Gale, Edited by Catherine Ressijac on March 26, 2018 If you have raster data
ESA-GLOBCOVER - A Global Land Cover Service at 300 m from ENVISAT MERIS Time Series
 October 15, 2008 (Jena Germany) ESA-GLOBCOVER - A Global Land Cover Service at 300 m from ENVISAT MERIS Time Series Defourny P.1, Bontemps S., Vancutsem C.1, Pekel J.F.1,, Vanbogaert E.1, Bicheron P.2,
Calculating Drive-time Buffers and Territories with Sparse Road Network
 Calculating Drive-time Buffers and Territories with Sparse Road Network Ran Tao 1, Jean-Claude Thill 1, James Walsh 1 Daniel Strandow 2, Michael Findley 3 1 University of North Carolina at Charlotte 2
GIS as a tool for rural livelihoods enhancement planning
 GIS as a tool for rural livelihoods enhancement planning (Case study of Alosylat region -Shareg Alnil-Sudan) Almojtaba M. H. Hassabo Federal Ministry of Agriculture Sudan A research submitted to the Development
Assessing Social Vulnerability to Biophysical Hazards. Dr. Jasmine Waddell
 Assessing Social Vulnerability to Biophysical Hazards Dr. Jasmine Waddell About the Project Built on a need to understand: The pre-disposition of the populations in the SE to adverse impacts from disaster
EAGLE concept, as part of the HELM vision
 EAGLE concept, as part of the HELM vision EAGLE working group Barbara Kosztra (Hungary), Stephan Arnold (Germany), Lena Hallin-Pihlatie & Elise Järvenpää (Finland) 16.06.2014 HELM / EAGLE Workshop - INSPIRE
ISO Canadian Drought Monitor Data Product Specifications
 ISO 19131 Canadian Drought Monitor Data Product Specifications Revision: A Page 1 of 14 Data product specifications: Canadian Drought Monitor - Table of Contents- 1. Overview... 3 1.1. Informal description...
MULTIPLE CHOICE. Choose the one alternative that best completes the statement or answers the question.
 Exam Name MULTIPLE CHOICE. Choose the one alternative that best completes the statement or answers the question. 1) One important feature of the world's population with the most significant future implications
Accounting Units for Ecosystem Accounts Paper prepared by Alessandra Alfieri, Daniel Clarke, and Ivo Havinga United Nations Statistics Division
 DEPARTMENT OF ECONOMIC AND SOCIAL AFFAIRS STATISTICS DIVISION UNITED NATIONS Expert Meeting on Ecosystem Accounts London, UK 5-7 December 2011 Accounting Units for Ecosystem Accounts Paper prepared by
Object Oriented Classification Using High-Resolution Satellite Images for HNV Farmland Identification. Shafique Matin and Stuart Green
 Object Oriented Classification Using High-Resolution Satellite Images for HNV Farmland Identification Shafique Matin and Stuart Green REDP, Teagasc Ashtown, Dublin, Ireland Correspondence: shafique.matin@teagasc.ie
BROOKINGS May
 Appendix 1. Technical Methodology This study combines detailed data on transit systems, demographics, and employment to determine the accessibility of jobs via transit within and across the country s 100
First steps toward a comparison of modelled thermal comfort during a heatwave in Melbourne, Australia
 First steps toward a comparison of modelled thermal comfort during a heatwave in Melbourne, Australia Stephanie Jacobs PhD supervisors: Ailie Gallant and Nigel Tapper Outline of talk Motivation for research
Modeling the Ecology of Urban Inequality in Space and Time
 Modeling the Ecology of Urban Inequality in Space and Time Corina Graif PhD Candidate, Department Of Sociology Harvard University Presentation for the Workshop on Spatial and Temporal Modeling, Center
Unit 3: Making Geographical Decisions. Do not return the Resource Booklet with the question paper
 Edexcel GCSE Geography B Unit 3: Making Geographical Decisions Sample Assessment Material Resource Booklet Paper 3F and 3H Paper Reference 5GB3F/01 5GB3H/01 Do not return the Resource Booklet with the
Georeferencing and Satellite Image Support: Lessons learned, Challenges and Opportunities
 Georeferencing and Satellite Image Support: Lessons learned, Challenges and Opportunities Shirish Ravan shirish.ravan@unoosa.org UN-SPIDER United Nations Office for Outer Space Affairs (UNOOSA) UN-SPIDER
Modeling the Change of Mangrove Forests in Irrawaddy Delta, South Myanmar
 International Journal of Sciences: Basic and Applied Research (IJSBAR) ISSN 2307-4531 (Print & Online) http://gssrr.org/index.php?journal=journalofbasicandapplied ---------------------------------------------------------------------------------------------------------------------------
Standardization of the land cover classes using FAO Land Cover Classification System (LCCS)
") Sofia, 17-18 September 2008, LPIS Workshop LPIS applications and quality 1 Standardization of the land cover classes using FAO Land Cover Classification System (LCCS) Pavel MILENOV Agriculture Unit, JRC
Sofia, 17-18 September 2008, LPIS Workshop LPIS applications and quality 1 Standardization of the land cover classes using FAO Land Cover Classification System (LCCS) Pavel MILENOV Agriculture Unit, JRC
Application of eigenvector-based spatial filtering approach to. a multinomial logit model for land use data
 Presented at the Seventh World Conference of the Spatial Econometrics Association, the Key Bridge Marriott Hotel, Washington, D.C., USA, July 10 12, 2013. Application of eigenvector-based spatial filtering
AGOG 485/585 /APLN 533 Spring Lecture 5: MODIS land cover product (MCD12Q1). Additional sources of MODIS data
. Additional sources of MODIS data") AGOG 485/585 /APLN 533 Spring 2019 Lecture 5: MODIS land cover product (MCD12Q1). Additional sources of MODIS data Outline Current status of land cover products Overview of the MCD12Q1 algorithm Mapping
AGOG 485/585 /APLN 533 Spring 2019 Lecture 5: MODIS land cover product (MCD12Q1). Additional sources of MODIS data Outline Current status of land cover products Overview of the MCD12Q1 algorithm Mapping
Geography Teach Yourself Series Topic 4: Global Distribution of Land Cover
 Geography Teach Yourself Series Topic 4: Global Distribution of Land Cover A: Level 14, 474 Flinders Street Melbourne VIC 3000 T: 1300 134 518 W: tssm.com.au E: info@tssm.com.au TSSM 2016 Page 1 of 7 Contents
Comparison of NASA AIRS and MODIS Land Surface Temperature and Infrared Emissivity Measurements from the EOS AQUA platform
 Comparison of NASA AIRS and MODIS Land Surface Temperature and Infrared Emissivity Measurements from the EOS AQUA platform Robert Knuteson, Hank Revercomb, Dave Tobin University of Wisconsin-Madison 16
Semester Project Final Report. Logan River Flood Plain Analysis Using ArcGIS, HEC-GeoRAS, and HEC-RAS
 Semester Project Final Report Logan River Flood Plain Analysis Using ArcGIS, HEC-GeoRAS, and HEC-RAS Kedric Curtis, Josh Hogge, Jordan Jarrett, Jared Justensen May 6, 2016 CEE 6190 GIS for Civil Engineers
Implementation of the NCEP operational GLDAS for the CFS land initialization
 Implementation of the NCEP operational GLDAS for the CFS land initialization Jesse Meng, Mickael Ek, Rongqian Yang NOAA/NCEP/EMC July 2012 1 Improving the Global Land Surface Climatology via improved Global
Data Requirements in Multidimensional Poverty Measurement
 Data Requirements in Multidimensional Poverty Measurement Oxford Poverty & Human Development Initiative (OPHI) University of Oxford Rabat, 4 June 2014 Limits of the current global MPI surveys: DHS, MICS
Poverty statistics in Mongolia
 HIGH-LEVEL SEMINAR ON HARMONISATION OF POVERTY STATISTICS IN CIS COUNTRIES SOCHI (RUSSIAN FEDERATION) Poverty statistics in Mongolia Oyunchimeg Dandar Director Population and Social Statistics Department,
Spatial Variation in Hospitalizations for Cardiometabolic Ambulatory Care Sensitive Conditions Across Canada
 Spatial Variation in Hospitalizations for Cardiometabolic Ambulatory Care Sensitive Conditions Across Canada CRDCN Conference November 14, 2017 Martin Cooke Alana Maltby Sarah Singh Piotr Wilk Today s
Towards Reliable Spatial Database of Informal Areas in Greater Cairo Region
 KEYWORDS informal areas, unreliable spatial data, spatial data collecting, capacity building SUMMARY The uncontrolled and rapid increase of Egypt s cities is a major problem of the country. More than the
Measuring and Monitoring SDGs in Portugal: Ratio of land consumption rate to population growth rate Mountain Green Cover Index
 Measuring and Monitoring SDGs in Portugal: 11.3.1Ratio of land consumption rate to population growth rate 15.4.2 Mountain Green Cover Index United Nations World Geospatial Information Congress João David
CLLD Cooperation OFFER
 Title of the proposed project (English) CLLD Cooperation OFFER PARKS PROTECTION III - Management, Protection and Economic Development in Protected Areas Type of project (select as many as you want) Cooperation
NATIONAL VEGETATION CLASSIFICATION STANDARD, VERSION 2 WORKING DRAFT
 NATIONAL VEGETATION CLASSIFICATION STANDARD, VERSION 2 WORKING DRAFT Subcommittee Federal Geographic Data Committee SUMMMARY NatureServe version 31 August 2006 INTRODUCTION The United States Federal Geographic
Afghan Profiles: Finding Structure in Survey Data to Better Understand the Human Terrain. Thomas E. Powell, Ph.D. Philip T. Eles, Ph.D.
 Afghan Profiles: Finding Structure in Survey Data to Better Understand the Human Terrain Thomas E. Powell, Ph.D. University of Amsterdam Faculty of Social and Behavioral Sciences t.e.powell@uva.nl Philip
We are IntechOpen, the world s leading publisher of Open Access books Built by scientists, for scientists. International authors and editors
 We are IntechOpen, the world s leading publisher of Open Access books Built by scientists, for scientists 3,500 108,000 1.7 M Open access books available International authors and editors Downloads Our
Models for Count and Binary Data. Poisson and Logistic GWR Models. 24/07/2008 GWR Workshop 1
 Models for Count and Binary Data Poisson and Logistic GWR Models 24/07/2008 GWR Workshop 1 Outline I: Modelling counts Poisson regression II: Modelling binary events Logistic Regression III: Poisson Regression
DROUGHT ASSESSMENT USING SATELLITE DERIVED METEOROLOGICAL PARAMETERS AND NDVI IN POTOHAR REGION
 DROUGHT ASSESSMENT USING SATELLITE DERIVED METEOROLOGICAL PARAMETERS AND NDVI IN POTOHAR REGION Researcher: Saad-ul-Haque Supervisor: Dr. Badar Ghauri Department of RS & GISc Institute of Space Technology
Are Travel Demand Forecasting Models Biased because of Uncorrected Spatial Autocorrelation? Frank Goetzke RESEARCH PAPER
 Are Travel Demand Forecasting Models Biased because of Uncorrected Spatial Autocorrelation? By Frank Goetzke RESEARCH PAPER 2003-10 Graduate Research Assistant Department of Economics College of Business
Social Vulnerability Index. Susan L. Cutter Department of Geography, University of South Carolina
 Social Vulnerability Index Susan L. Cutter Department of Geography, University of South Carolina scutter@sc.edu Great Lakes and St. Lawrence Cities Initiative Webinar December 3, 2014 Vulnerability The
Capabilities and Limitations of Land Cover and Satellite Data for Biomass Estimation in African Ecosystems Valerio Avitabile
 Capabilities and Limitations of Land Cover and Satellite Data for Biomass Estimation in African Ecosystems Valerio Avitabile Kaniyo Pabidi - Budongo Forest Reserve November 13th, 2008 Outline of the presentation
Land accounting perspective on water resources management
 European Water 60: 161-166, 2017. 2017 E.W. Publications Land accounting perspective on water resources management G.T. Paschos, G.E. Bariamis * and E.A. Baltas Department of Water Resources and Environmental
Running head: GEOGRAPHICALLY WEIGHTED REGRESSION 1. Geographically Weighted Regression. Chelsey-Ann Cu GEOB 479 L2A. University of British Columbia
 Running head: GEOGRAPHICALLY WEIGHTED REGRESSION 1 Geographically Weighted Regression Chelsey-Ann Cu 32482135 GEOB 479 L2A University of British Columbia Dr. Brian Klinkenberg 9 February 2018 GEOGRAPHICALLY
System of Environmental-Economic Accounting. Advancing the SEEA Experimental Ecosystem Accounting. Extent Account (Levels 1 and 2)
") Advancing the SEEA Experimental Ecosystem Accounting Extent Account (Levels 1 and 2) Overview: The Extent Account 1. Learning objectives 2. Review of Level 0 (5m) What is it? Why do we need it? What does
Advancing the SEEA Experimental Ecosystem Accounting Extent Account (Levels 1 and 2) Overview: The Extent Account 1. Learning objectives 2. Review of Level 0 (5m) What is it? Why do we need it? What does
Mapping the Route Identifying and Consulting with HS2 s Impacted Populations
 Tuesday 6 December 2016 Mapping the Route Identifying and Consulting with HS2 s Impacted Populations Carry Stephenson, Evelyn Robertson SYSTRA Michael Flynn HS2 Summary Study Context and Objectives Methodology
DEVELOPMENT OF GPS PHOTOS DATABASE FOR LAND USE AND LAND COVER APPLICATIONS
 DEVELOPMENT OF GPS PHOTOS DATABASE FOR LAND USE AND LAND COVER APPLICATIONS An Ngoc VAN and Wataru TAKEUCHI Institute of Industrial Science University of Tokyo 4-6-1 Komaba, Meguro-ku, Tokyo 153-8505 Japan
Linear Regression With Special Variables
 Linear Regression With Special Variables Junhui Qian December 21, 2014 Outline Standardized Scores Quadratic Terms Interaction Terms Binary Explanatory Variables Binary Choice Models Standardized Scores:
Abdolreza Ansari Amoli. Remote Sensing Department Iranian Space Agency
 Risk Assessment and Mapping Using Earth Observation Data In Iran Abdolreza Ansari Amoli Remote Sensing & GIS Expert Remote Sensing Department Iranian Space Agency Different Types of Disasters in Iran Epidemic
Spatial Discrete Choice Models
 Spatial Discrete Choice Models Professor William Greene Stern School of Business, New York University SPATIAL ECONOMETRICS ADVANCED INSTITUTE University of Rome May 23, 2011 Spatial Correlation Spatially
DROUGHT RISK EVALUATION USING REMOTE SENSING AND GIS : A CASE STUDY IN LOP BURI PROVINCE
 DROUGHT RISK EVALUATION USING REMOTE SENSING AND GIS : A CASE STUDY IN LOP BURI PROVINCE K. Prathumchai, Kiyoshi Honda, Kaew Nualchawee Asian Centre for Research on Remote Sensing STAR Program, Asian Institute
AN AGENT-BASED POPULATION MODEL FOR CHINA
 AN AGENT-BASED POPULATION MODEL FOR CHINA Zhongxin Chen 1,2,*, Einar Holm 3, Huajun Tang 1, 2, Kalle Mäkilä 3, Wenjuan 2, 3 Li, Shenghe Liu 4 1 Key Laboratory of Resource Remote Sensing and Digital Agriculture,
Addressing Corner Solution Effect for Child Mortality Status Measure: An Application of Tobit Model
 Addressing Corner Solution Effect for Child Mortality Status Measure: An Application of Tobit Model Hafiz M. Muddasar Jamil Shera & Irum Sajjad Dar College of Statistics and Actuarial Sciences, University
This report details analyses and methodologies used to examine and visualize the spatial and nonspatial
 Analysis Summary: Acute Myocardial Infarction and Social Determinants of Health Acute Myocardial Infarction Study Summary March 2014 Project Summary :: Purpose This report details analyses and methodologies
CORINE LAND COVER CROATIA
 CORINE LAND COVER CROATIA INTRO Primary condition in making decisions directed to land cover and natural resources management is presence of knowledge and high quality information about biosphere and its
Cross-Sensor Continuity Science Algorithm
 Cross-Sensor Continuity Science Algorithm - Long Term Vegetation Index and Phenology Workshop - Javzan Tsend-Ayush and Tomoaki Miura Department of Natural Resources and Environmental Management University
SEEA Experimental Ecosystem Accounting
 SEEA Experimental Ecosystem Accounting Sokol Vako United Nations Statistics Division Training for the worldwide implementation of the System of Environmental Economic Accounting 2012 - Central Framework
al steps utilized well as tables
 Global malaria mortality between 1980 and 2010: a systematic analysis WEBAPPENDIX Authors: Christopher J L Murray, Lisa C Rosenfeld, Stephen S Lim, Kathryn G Andrews, Kyle J Foreman, Diana Haring, Nancy
Towards a risk map of malaria for Sri Lanka
 assessing the options for control of malaria vectors through different water management practices in a natural stream that formed part of such a tank cascade system. The studies established conclusively
Land Cover Classification Mapping & its uses for Planning
 Land Cover Classification Mapping & its uses for Planning What is Land Cover Classification Mapping? Examples of an actual product Why use Land Cover Classification Mapping for planning? Possible uses
 CSAE WPS/2008-06 1998-2001 panel Mitch panel Mitch panel Mitch panel 1998-2001 panel 1998 1999 2001 Poverty 68.7% 74.1% 73.1% 70.6% 63.6% Extreme Poverty 28.6% 32.0% 34.5% 25.9% 25.4%
Role of GIS and Remote Sensing to Environment Statistics
 United Nations Economic Commission for Africa Role of GIS and Remote Sensing to Environment Dozie Ezigbalike Data Management Coordinator A Definition Environment statistics are statistics that describe
An Internet-based Agricultural Land Use Trends Visualization System (AgLuT)
") An Internet-based Agricultural Land Use Trends Visualization System (AgLuT) Second half yearly report 01-01-2001-06-30-2001 Prepared for Missouri Department of Natural Resources Missouri Department of
An Internet-based Agricultural Land Use Trends Visualization System (AgLuT) Second half yearly report 01-01-2001-06-30-2001 Prepared for Missouri Department of Natural Resources Missouri Department of
Introduction to Linear Regression Analysis
 Introduction to Linear Regression Analysis Samuel Nocito Lecture 1 March 2nd, 2018 Econometrics: What is it? Interaction of economic theory, observed data and statistical methods. The science of testing
Measuring Disaster Risk for Urban areas in Asia-Pacific
 Measuring Disaster Risk for Urban areas in Asia-Pacific Acknowledgement: Trevor Clifford, Intl Consultant 1 SDG 11 Make cities and human settlements inclusive, safe, resilient and sustainable 11.1: By
Lecture 1 Introduction to Multi-level Models
 Lecture 1 Introduction to Multi-level Models Course Website: http://www.biostat.jhsph.edu/~ejohnson/multilevel.htm All lecture materials extracted and further developed from the Multilevel Model course
Regional Training Workshop on Human Settlement Indicators
 Regional Training Workshop on Human Settlement Indicators Module 6 Indicator 11.7.1: Average share of the built-up area of cities that is open space for public use for all, by sex, age and persons with
THE GEOGRAPHICAL ANALYSIS OF THE TRANS-BOUNDARY TERRITORY (PRIMORSKII AND KHABAROVSKII KRAIS OF RUSSIA HEILONGJIANG PROVINCE OF CHINA)
") THE GEOGRAPHICAL ANALYSIS OF THE TRANS-BOUNDARY TERRITORY (PRIMORSKII AND KHABAROVSKII KRAIS OF RUSSIA HEILONGJIANG PROVINCE OF CHINA) MISHINA NATALIA V. Pacific Geographical Institute, Far Eastern Branch
THE GEOGRAPHICAL ANALYSIS OF THE TRANS-BOUNDARY TERRITORY (PRIMORSKII AND KHABAROVSKII KRAIS OF RUSSIA HEILONGJIANG PROVINCE OF CHINA) MISHINA NATALIA V. Pacific Geographical Institute, Far Eastern Branch
Welcome. C o n n e c t i n g
 Welcome C o n n e c t i n g YOU D i s c i p l i n e s Why is This Meeting......So Important Now? OUR WORLD Is Increasingly Challenged The Evidence Is Clear We Need Better Understanding and More Collaboration
Field Course Descriptions
 Field Course Descriptions Ph.D. Field Requirements 12 credit hours with 6 credit hours in each of two fields selected from the following fields. Each class can count towards only one field. Course descriptions
DATA DISAGGREGATION BY GEOGRAPHIC
 PROGRAM CYCLE ADS 201 Additional Help DATA DISAGGREGATION BY GEOGRAPHIC LOCATION Introduction This document provides supplemental guidance to ADS 201.3.5.7.G Indicator Disaggregation, and discusses concepts
Responding to Natural Hazards: The Effects of Disaster on Residential Location Decisions and Health Outcomes
 Responding to Natural Hazards: The Effects of Disaster on Residential Location Decisions and Health Outcomes James Price Department of Economics University of New Mexico April 6 th, 2012 1 Introduction
A PRIMER ON LINEAR REGRESSION
 A PRIMER ON LINEAR REGRESSION Marc F. Bellemare Introduction This set of lecture notes was written so as to allow you to understand the classical linear regression model, which is one of the most common
Land cover/land use mapping and cha Mongolian plateau using remote sens. Title. Author(s) Bagan, Hasi; Yamagata, Yoshiki. Citation Japan.
 Bagan, Hasi; Yamagata, Yoshiki. Citation Japan.") Title Land cover/land use mapping and cha Mongolian plateau using remote sens Author(s) Bagan, Hasi; Yamagata, Yoshiki International Symposium on "The Imp Citation Region Specific Systems". 6 Nove Japan.
Title Land cover/land use mapping and cha Mongolian plateau using remote sens Author(s) Bagan, Hasi; Yamagata, Yoshiki International Symposium on "The Imp Citation Region Specific Systems". 6 Nove Japan.