AGOG 485/585 /APLN 533 Spring Lecture 5: MODIS land cover product (MCD12Q1). Additional sources of MODIS data
|
|
|
- Sophie Scott
- 5 years ago
- Views:
Transcription
.")
1 AGOG 485/585 /APLN 533 Spring 2019 Lecture 5: MODIS land cover product (MCD12Q1). Additional sources of MODIS data
2 Outline Current status of land cover products Overview of the MCD12Q1 algorithm Mapping Global Urban Areas Reading : Textbook Chapter 20 Optional: Chapter 12 Check additional readings on the website
3 MODIS Global Land Cover Product Designed to provide information related to state and seasonal-to-decadal scale dynamics of global land cover There are two datasets: MODIS land cover type (MCD12Q1): 5 main layers in which land cover is mapped using several different classification systems MODIS land cover dynamics (MCD12Q2): 7 layers, to support studies of seasonal and interannual variation in land surface and ecosystem properties. A.K.A Global Vegetation Phenology product
4 MCD12Q1: Land Cover Types Layers depict different land cover classifications: International Geosphere-Biosphere classification, also provides the most likely alternative IGBP class. 14-class system developed at the University of Maryland 6-biome system used by the MODIS LAI/FAPAR algorithm: including broadleaf and cereal crops Biome classification proposed by Steve Running et al.: leaf type, leaf longevity, plant persistence Plant functional type classification described by Bonan et al. Classification confidence is also provided for each pixel.
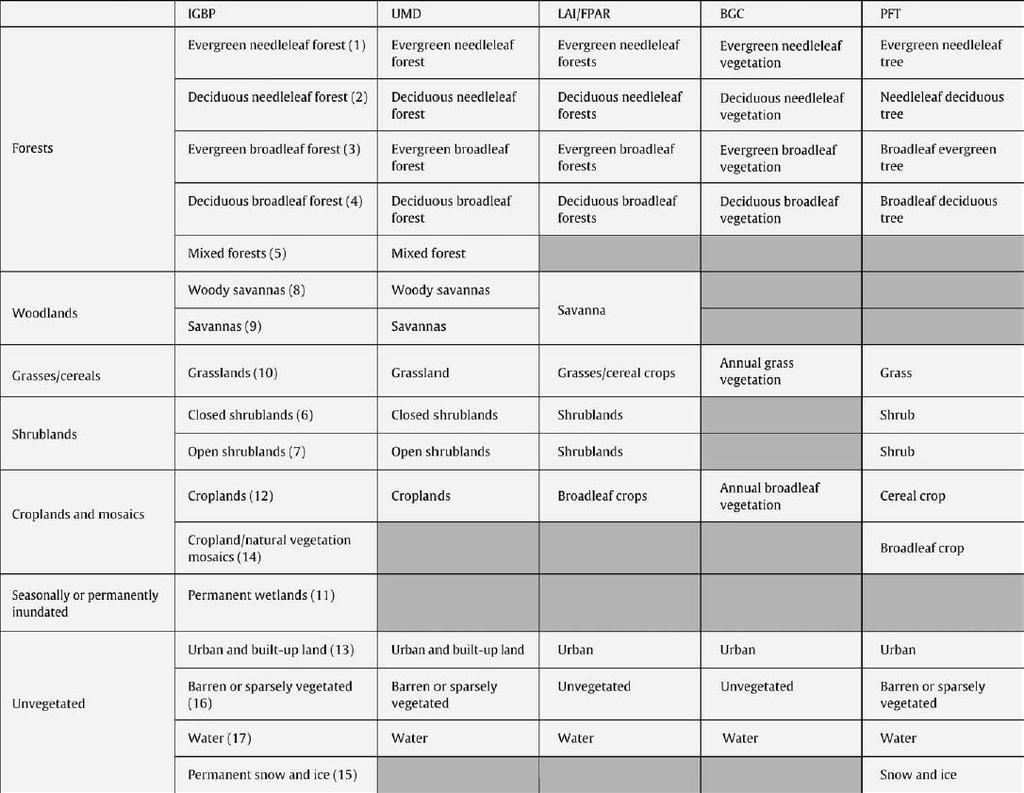
5 MCD12Q1 classifications
6 MCD12Q1: Algorithm Description (collection 4) Input data (242 bands, 1000m resolution): 16-day Nadir BRDF-Adjusted Reflectances (NBARs) assembled over one year of observations: 7 spectral bands, µm, similar to Landsat 16-day Enhanced Vegetation Index (EVI) Land Surface Temperature product (16-day maximum temp) All inputs are cloud-cleared and atmospherically corrected. Texture (maximum) images of the spectral band 1 USGS DEM topography (slope, aspect, gradient, elev) In addition, annual mean, minimum and maximum for each of the input features identified above.
7 MCD12Q1: Algorithm Description (collection 5.1) Input data (135 bands, 500m resolution): 32-day Nadir BRDF-Adjusted Reflectances (NBARs) assembled over one year of observations: 7 spectral bands, µm, similar to Landsat 32-day Enhanced Vegetation Index (EVI) Land Surface Temperature product (32-day average maximum temp) All inputs are cloud-cleared and atmospherically corrected. In addition, annual mean, minimum and maximum for each of the input features identified above. Collection 4 land cover

8 MCD12Q1: Flowchart
9 MCD12Q1: Algorithm Description At the global scale, many land covers reveal multimodal distributions. The MODIS land cover product employs a supervised decision tree classification algorithm called C4.5 C4.5 is a nonparametric classifier which makes no assumptions regarding the frequency distribution of the data being classified. Assumptions are violated for parametric classifiers that assume a frequency distribution: such as maximum likelihood classifiers.
10 MCD12Q1: Training data The MCD12Q1 algorithm relies heavily on a database of land cover exemplars for classification estimation. System for Terrestrial Ecosystem Parameterization (STEP): 2095 sites distributed globally Dynamic database, requires ongoing maintenance. Sites included in the database are derived from manual interpretation of Landsat TM data, augmented by ancillary map data, as available.

11 MCD12Q1: Training data
12 Decision Tree Classification Goal: optimal prediction of class labels from a set of feature values Basic approach: Supervised learning using training data Boosting (10 decisions trees): Ensemble classification developed in the machine learning community. It improves class discrimination by estimating multiple classifiers while forcing the classifier to focus on difficult classes. Final classification produced by an accuracy-weighted vote
13 Decision Tree Classification Tree Structure: Root node (all data), internal nodes and terminal or leaf nodes (predictions) Building the Decision Tree: Recursive partitioning of training data into successively more homogeneous subsets Multiple Leaf Nodes per Class Leaf nodes identify class assignment Sub-classes allocated individual leaves Internal nodes Root Leaf nodes

14 Land Cover Product, New England, 2001 Evergreen Needleleaf Forest Agriculture Agriculture/Natural Vegetation Mosaic Deciduous Broadleaf Forest Mixed Forest Urban 14 EOS IWG October 31, 2001 October 31, 2001

15 MCD12Q1: Algorithm Description Classification Confidence map Second Most-Likely Class
16 MCD12Q1: Land cover validation Validation Plan Utilizes Multiple Approaches Level 1: Comparison with existing data sources Examples: Global AVHRR land cover datasets: DISCover, UMD Humid Tropics: Landsat Pathfinder Forest Cover: FAO Forest Resources Assessment Western Europe: CORINE United States: USGS/EPA NLCD/MRLC
17 MCD12Q1: Land cover validation Level 2: Quantitative studies of output and training data Per-pixel confidence statistics Test site cross-comparisons Level 3: Sample-based statistical studies Random stratified sampling according to proper statistical principles Costly, but needed for making proper accuracy statements.
18 MCD12Q1: Confidence values by land cover type IGBP Class Confidence 1. Evergreen Needleleaf Evergreen Broadleaf Deciduous Needleleaf Deciduous Broadleaf Mixed Forest Closed Shrubland Open Shrubland Woody Savanna 64.0 IGBP Class Confidence 9. Savanna Grasslands Permanent Wetlands Cropland Cropland/Nat. Veg n Snow and Ice Barren 90.0 Overall Confidence 76.3
19 MCD12Q1: Confidence values by continent Region Confidence, percent Africa 79.4 Australia/Pacific 83.2 Eurasia 76.8 North America 71.9 South America 78.5 Overall Confidence 76.3
20 MCD12Q1: Cross validation with training sites Cross-Validation Procedure Hide 10% of training sites, classify with remaining 90%; repeat 10 times for 10 unique sets of all sites Provides confusion matrix based on unseen pixels where whole training site is unseen Not a stratified random sample, but a reasonable indication of within-class accuracy.

21 MCD12Q1: Confusion Matrix
22 MCD12Q1: Overall accuracies Proper accuracy statements require proper statistical sampling. AVHRR state of the art has been 60-70%, depending on class and region. MODIS accuracies are falling in the 70-80% range. Most mistakes are between similar classes. Land cover change should not be inferred from comparing successive land cover maps.
23 What about urban areas? Occupy less than 1% of terrestrial surface (<2% according to other accounts) Have significant effects on global environmental processes >50% of world s human population >70-80% of economic activities Major contributors to pollution What is urban area?
24 What about urban areas? Occupy less than 1% of terrestrial surface (<2% according to other accounts) Have significant effects on global environmental processes >50% of world s human population >70-80% of economic activities Major contributors to pollution What is urban area? Built environment (=impervious surfaces) occupies >50% within a pixel Vegetated pixels (>50% green, e.g. parks) are not urban Minimal mapping unit = contiguous patches of built-up land 1 km 2

25 What about urban areas? From Schneider et al 2010

26 Nighttime lights of the conterminous US Defense Meteorological Satellite Program (DMSP)
27 Methodology of mapping urban areas for the first version of global land cover (2003)


28 Examples of mapped urban areas (2003)
29 Mapping urban areas using 500m MODIS (Schneider et al 2010) Preliminary stratification of global urban areas into 16 quasihomogeneous strata = urban ecoregions Biome designation (climate and vegetation) Regional differences in urban topology (structure, organization, and historic development) Level of economic development (per capita Gross Domestic Product)

30 Urban ecoregions (Schneider et al 2010)

31 Urban ecoregions (Schneider et al 2010)
32 Mapping urban areas using 500m MODIS (Schneider et al 2010) Supervised classification with ensemble decision trees (C4.5 classifier) and boosting Trained by the same 2095 STEP sites plus 182 additional urban areas One-year time-series of 8-day 7-band MODIS NBAR product (~500 m) Auxiliary datasets (e.g DMSP nightlights) are not used
33 Mapping urban areas using 500m MODIS (Schneider et al 2010) C4.5 classifier is run twice: The first run utilizes all 2277 training areas Problematic areas are then refined using a posterior probabilities and Bayes Rule, where probabilities of being urban are estimated by subtracting probabilities of non-urban classes (primarily shrublands) derived from decision trees that do not use urban training areas (the second run) from one, i.e. P (urban) = 1 P(shrubland) Accuracy assessment uses 140 independent reference sites classified manually using Landsat imagery

34 Estimating posterior probabilities

35 Comparison of global maps
Cross-Sensor Continuity Science Algorithm
 Cross-Sensor Continuity Science Algorithm - Long Term Vegetation Index and Phenology Workshop - Javzan Tsend-Ayush and Tomoaki Miura Department of Natural Resources and Environmental Management University
Global land cover mapping from MODIS: algorithms and early results
 Remote Sensing of Environment 83 (2002) 287 302 www.elsevier.com/locate/rse Global land cover mapping from MODIS: algorithms and early results M.A. Friedl a, *, D.K. McIver a, J.C.F. Hodges a, X.Y. Zhang
Application and impacts of the GlobeLand30 land cover dataset on the Beijing Climate Center Climate Model
 IOP Conference Series: Earth and Environmental Science PAPER OPEN ACCESS Application and impacts of the GlobeLand30 land cover dataset on the Beijing Climate Center Climate Model To cite this article:
Patrick Leinenkugel. German Aerospace Center (DLR) Vortrag > Autor > Dokumentname > Datum
 Vortrag > Autor > Dokumentname > Datum") Characterisation of land surface phenology and land cover for the Mekong Basin on the basis of multitemporal and multispectral satellite data from the MODIS Sensor Patrick Leinenkugel German Aerospace
Characterisation of land surface phenology and land cover for the Mekong Basin on the basis of multitemporal and multispectral satellite data from the MODIS Sensor Patrick Leinenkugel German Aerospace
Biology and the hierarchies of life. finer scale. coarser scale. individual. populations. metapopulation. community. ecosystem. biome.
 Biology and the hierarchies of life finer scale individual populations metapopulation community ecosystem biome coarser scale biosphere 1 Communities: all species that live together in one place Eucalypt
Comparison of NASA AIRS and MODIS Land Surface Temperature and Infrared Emissivity Measurements from the EOS AQUA platform
 Comparison of NASA AIRS and MODIS Land Surface Temperature and Infrared Emissivity Measurements from the EOS AQUA platform Robert Knuteson, Hank Revercomb, Dave Tobin University of Wisconsin-Madison 16
Module 2.1 Monitoring activity data for forests using remote sensing
 Module 2.1 Monitoring activity data for forests using remote sensing Module developers: Frédéric Achard, European Commission (EC) Joint Research Centre (JRC) Jukka Miettinen, EC JRC Brice Mora, Wageningen
Implementation of the NCEP operational GLDAS for the CFS land initialization
 Implementation of the NCEP operational GLDAS for the CFS land initialization Jesse Meng, Mickael Ek, Rongqian Yang NOAA/NCEP/EMC July 2012 1 Improving the Global Land Surface Climatology via improved Global
Capabilities and Limitations of Land Cover and Satellite Data for Biomass Estimation in African Ecosystems Valerio Avitabile
 Capabilities and Limitations of Land Cover and Satellite Data for Biomass Estimation in African Ecosystems Valerio Avitabile Kaniyo Pabidi - Budongo Forest Reserve November 13th, 2008 Outline of the presentation
Comparison of NASA AIRS and MODIS Land Surface Temperature and Infrared Emissivity Measurements from the EOS AQUA platform
 Comparison of NASA AIRS and MODIS Land Surface Temperature and Infrared Emissivity Measurements from the EOS AQUA platform Robert Knuteson, Steve Ackerman, Hank Revercomb, Dave Tobin University of Wisconsin-Madison
LAND COVER CATEGORY DEFINITION BY IMAGE INVARIANTS FOR AUTOMATED CLASSIFICATION
 LAND COVER CATEGORY DEFINITION BY IMAGE INVARIANTS FOR AUTOMATED CLASSIFICATION Nguyen Dinh Duong Environmental Remote Sensing Laboratory Institute of Geography Hoang Quoc Viet Rd., Cau Giay, Hanoi, Vietnam
Extent. Level 1 and 2. October 2017
 Extent Level 1 and 2 October 2017 Overview: Extent account 1. Learning objectives 2. Review of Level 0 (5m) 3. Level 1 (Compilers): Concepts (15m) Group exercise and discussion (15m) 4. Level 2 (Data Providers)
Mongolian Academy of Sciences
 Mongolian Academy of Sciences Figure 5. Change of subsurface profile temperature at some observation well in Jakarta. Figure 6. Change of air temperature in Jakarta in the period of 100 years (KLH, BMG,
Geospatial technology for land cover analysis
 Home Articles Application Environment & Climate Conservation & monitoring Published in : Middle East & Africa Geospatial Digest November 2013 Lemenkova Polina Charles University in Prague, Faculty of Science,
ANALYSIS AND VALIDATION OF A METHODOLOGY TO EVALUATE LAND COVER CHANGE IN THE MEDITERRANEAN BASIN USING MULTITEMPORAL MODIS DATA
 PRESENT ENVIRONMENT AND SUSTAINABLE DEVELOPMENT, NR. 4, 2010 ANALYSIS AND VALIDATION OF A METHODOLOGY TO EVALUATE LAND COVER CHANGE IN THE MEDITERRANEAN BASIN USING MULTITEMPORAL MODIS DATA Mara Pilloni
Changes in Seasonal Albedo with Land Cover Class
 Name: Date: Changes in Seasonal Albedo with Land Cover Class Guiding question: How does albedo change over the seasons in different land cover classes? Introduction. Now that you have completed the Introduction
Inter-annual stability of land cover classification: explorations and improvements
 Boston University OpenBU Theses & Dissertations http://open.bu.edu Boston University Theses & Dissertations 2014 Inter-annual stability of land cover classification: explorations and improvements Abercrombie,
DEVELOPMENT OF GPS PHOTOS DATABASE FOR LAND USE AND LAND COVER APPLICATIONS
 DEVELOPMENT OF GPS PHOTOS DATABASE FOR LAND USE AND LAND COVER APPLICATIONS An Ngoc VAN and Wataru TAKEUCHI Institute of Industrial Science University of Tokyo 4-6-1 Komaba, Meguro-ku, Tokyo 153-8505 Japan
System of Environmental-Economic Accounting. Advancing the SEEA Experimental Ecosystem Accounting. Extent Account (Levels 1 and 2)
") Advancing the SEEA Experimental Ecosystem Accounting Extent Account (Levels 1 and 2) Overview: The Extent Account 1. Learning objectives 2. Review of Level 0 (5m) What is it? Why do we need it? What does
Advancing the SEEA Experimental Ecosystem Accounting Extent Account (Levels 1 and 2) Overview: The Extent Account 1. Learning objectives 2. Review of Level 0 (5m) What is it? Why do we need it? What does
Predicting ectotherm disease vector spread. - Benefits from multi-disciplinary approaches and directions forward
 Predicting ectotherm disease vector spread - Benefits from multi-disciplinary approaches and directions forward Naturwissenschaften Stephanie Margarete THOMAS, Carl BEIERKUHNLEIN, Department of Biogeography,
Methods review for the Global Land Cover 2000 initiative Presentation made by Frédéric Achard on November 30 th 2000
 Methods review for the Global Land Cover 2000 initiative Presentation made by Frédéric Achard on November 30 th 2000 1. Contents Objectives Specifications of the GLC-2000 exercise Strategy for the analysis
Overlay Analysis II: Using Zonal and Extract Tools to Transfer Raster Values in ArcMap
 Overlay Analysis II: Using Zonal and Extract Tools to Transfer Raster Values in ArcMap Created by Patrick Florance and Jonathan Gale, Edited by Catherine Ressijac on March 26, 2018 If you have raster data
Mapping forests in monsoon Asia with ALOS PALSAR 50-m mosaic images and MODIS
 1 Supplementary Information 2 3 Mapping forests in monsoon Asia with ALOS PALSAR 50-m mosaic images and MODIS imagery in 2010 4 5 6 7 8 9 10 11 Yuanwei Qin, Xiangming Xiao, Jinwei Dong, Geli Zhang, Partha
COMBINING ENUMERATION AREA MAPS AND SATELITE IMAGES (LAND COVER) FOR THE DEVELOPMENT OF AREA FRAME (MULTIPLE FRAMES) IN AN AFRICAN COUNTRY:
 FOR THE DEVELOPMENT OF AREA FRAME (MULTIPLE FRAMES) IN AN AFRICAN COUNTRY:") COMBINING ENUMERATION AREA MAPS AND SATELITE IMAGES (LAND COVER) FOR THE DEVELOPMENT OF AREA FRAME (MULTIPLE FRAMES) IN AN AFRICAN COUNTRY: PRELIMINARY LESSONS FROM THE EXPERIENCE OF ETHIOPIA BY ABERASH
COMBINING ENUMERATION AREA MAPS AND SATELITE IMAGES (LAND COVER) FOR THE DEVELOPMENT OF AREA FRAME (MULTIPLE FRAMES) IN AN AFRICAN COUNTRY: PRELIMINARY LESSONS FROM THE EXPERIENCE OF ETHIOPIA BY ABERASH
Lecture Topics. 1. Vegetation Indices 2. Global NDVI data sets 3. Analysis of temporal NDVI trends
 Lecture Topics 1. Vegetation Indices 2. Global NDVI data sets 3. Analysis of temporal NDVI trends Why use NDVI? Normalize external effects of sun angle, viewing angle, and atmospheric effects Normalize
Overview on Land Cover and Land Use Monitoring in Russia
 Russian Academy of Sciences Space Research Institute Overview on Land Cover and Land Use Monitoring in Russia Sergey Bartalev Joint NASA LCLUC Science Team Meeting and GOFC-GOLD/NERIN, NEESPI Workshop
Dynamic Land Cover Dataset Product Description
 Dynamic Land Cover Dataset Product Description V1.0 27 May 2014 D2014-40362 Unclassified Table of Contents Document History... 3 A Summary Description... 4 Sheet A.1 Definition and Usage... 4 Sheet A.2
Using VIIRS Land Surface Temperature to Evaluate NCEP North American Mesoscale Model (NAM) Forecast
 Forecast") Using VIIRS Land Surface Temperature to Evaluate NCEP North American Mesoscale Model (NAM) Forecast Zhuo Wang (University of Maryland) Yunyue Yu (NOAA/NESDIS/STAR) Peng Yu (University of Maryland) Yuling
Using VIIRS Land Surface Temperature to Evaluate NCEP North American Mesoscale Model (NAM) Forecast Zhuo Wang (University of Maryland) Yunyue Yu (NOAA/NESDIS/STAR) Peng Yu (University of Maryland) Yuling
An Automated Object-Oriented Satellite Image Classification Method Integrating the FAO Land Cover Classification System (LCCS).
.") An Automated Object-Oriented Satellite Image Classification Method Integrating the FAO Land Cover Classification System (LCCS). Ruvimbo Gamanya Sibanda Prof. Dr. Philippe De Maeyer Prof. Dr. Morgan De
An Automated Object-Oriented Satellite Image Classification Method Integrating the FAO Land Cover Classification System (LCCS). Ruvimbo Gamanya Sibanda Prof. Dr. Philippe De Maeyer Prof. Dr. Morgan De
Land accounting in Québec: Pilot project for a sub-provincial area
 Land accounting in Québec: Pilot project for a sub-provincial area Stéphanie Uhde 8th meeting of the London Group on Environmental Accounting Ottawa, 2 October, 2012 Province of Québec Area: 1 667 441
USING HYPERSPECTRAL IMAGERY
 USING HYPERSPECTRAL IMAGERY AND LIDAR DATA TO DETECT PLANT INVASIONS 2016 ESRI CANADA SCHOLARSHIP APPLICATION CURTIS CHANCE M.SC. CANDIDATE FACULTY OF FORESTRY UNIVERSITY OF BRITISH COLUMBIA CURTIS.CHANCE@ALUMNI.UBC.CA
ESA-GLOBCOVER - A Global Land Cover Service at 300 m from ENVISAT MERIS Time Series
 October 15, 2008 (Jena Germany) ESA-GLOBCOVER - A Global Land Cover Service at 300 m from ENVISAT MERIS Time Series Defourny P.1, Bontemps S., Vancutsem C.1, Pekel J.F.1,, Vanbogaert E.1, Bicheron P.2,
CHAPTER 1 THE UNITED STATES 2001 NATIONAL LAND COVER DATABASE
 CHAPTER 1 THE UNITED STATES 2001 NATIONAL LAND COVER DATABASE Collin Homer*, Jon Dewitz, Joyce Fry, and Nazmul Hossain *U.S. Geological Survey (USGS) Center for Earth Resources Observation and Science
Deriving Landcover Information over Siberia using MERIS and MODIS data
 Deriving Landcover Information over Siberia using MERIS and data Dr Laine Skinner (1) and Dr Adrian Luckman (1) (1) University of Wales Swansea, Singleton Park, SA2 8PP Swansea, UK. gglskinn@swan.ac.uk
An Internet-based Agricultural Land Use Trends Visualization System (AgLuT)
") An Internet-based Agricultural Land Use Trends Visualization System (AgLuT) Second half yearly report 01-01-2001-06-30-2001 Prepared for Missouri Department of Natural Resources Missouri Department of
An Internet-based Agricultural Land Use Trends Visualization System (AgLuT) Second half yearly report 01-01-2001-06-30-2001 Prepared for Missouri Department of Natural Resources Missouri Department of
Data Fusion and Multi-Resolution Data
 Data Fusion and Multi-Resolution Data Nature.com www.museevirtuel-virtualmuseum.ca www.srs.fs.usda.gov Meredith Gartner 3/7/14 Data fusion and multi-resolution data Dark and Bram MAUP and raster data Hilker
Image classification. Mário Caetano. September 4th, 2007 Lecture D2L4
 Image classification Mário Caetano September 4th, 2007 Lecture D2L4 Goals 1 From data to information: presentation of different mapping approaches 2 Most common problems in image classification and how
Permanent Ice and Snow
 Soil Moisture Active Passive (SMAP) Ancillary Data Report Permanent Ice and Snow Preliminary, v.1 SMAP Science Document no. 048 Kyle McDonald, E. Podest, E. Njoku Jet Propulsion Laboratory California Institute
First steps toward a comparison of modelled thermal comfort during a heatwave in Melbourne, Australia
 First steps toward a comparison of modelled thermal comfort during a heatwave in Melbourne, Australia Stephanie Jacobs PhD supervisors: Ailie Gallant and Nigel Tapper Outline of talk Motivation for research
Global land cover mapping GLCNMO and data sharing system CEReS Gaia
 Global land cover mapping GLCNMO and data sharing system CEReS Gaia Ryutaro Tateishi Center for Environmental Remote Sensing(CEReS) Chiba University E-mail: tateishi@faculty.chiba-u.jp Production of 500
Global Biogeography. Natural Vegetation. Structure and Life-Forms of Plants. Terrestrial Ecosystems-The Biomes
 Global Biogeography Natural Vegetation Structure and Life-Forms of Plants Terrestrial Ecosystems-The Biomes Natural Vegetation natural vegetation is the plant cover that develops with little or no human
Impact of land cover uncertainties on estimates of biospheric carbon fluxes
 Click Here for Full Article GLOBAL BIOGEOCHEMICAL CYCLES, VOL. 22,, doi:10.1029/2007gb003097, 2008 Impact of land cover uncertainties on estimates of biospheric carbon fluxes T. Quaife, 1,2 S. Quegan,
8.2 GLOBALLY DESCRIBING THE CURRENT DAY LAND SURFACE AND HISTORICAL LAND COVER CHANGE IN CCSM 3.0 USING AVHRR AND MODIS DATA AT FINE SCALES
 8.2 GLOBALLY DESCRIBING THE CURRENT DAY LAND SURFACE AND HISTORICAL LAND COVER CHANGE IN CCSM 3.0 USING AVHRR AND MODIS DATA AT FINE SCALES Peter J. Lawrence * Cooperative Institute for Research in Environmental
Chapter 7 Part III: Biomes
 Chapter 7 Part III: Biomes Biomes Biome: the major types of terrestrial ecosystems determined primarily by climate 2 main factors: Temperature and precipitation Depends on latitude or altitude; proximity
Earth s Major Terrerstrial Biomes. *Wetlands (found all over Earth)
") Biomes Biome: the major types of terrestrial ecosystems determined primarily by climate 2 main factors: Depends on ; proximity to ocean; and air and ocean circulation patterns Similar traits of plants
Biomes Biome: the major types of terrestrial ecosystems determined primarily by climate 2 main factors: Depends on ; proximity to ocean; and air and ocean circulation patterns Similar traits of plants
VIC Hydrology Model Training Workshop Part II: Building a model
 VIC Hydrology Model Training Workshop Part II: Building a model 11-12 Oct 2011 Centro de Cambio Global Pontificia Universidad Católica de Chile Ed Maurer Civil Engineering Department Santa Clara University
Development of high resolution land surface parameters for the Community Land Model
 doi:10.5194/gmd-5-1341-2012 Author(s) 2012. CC Attribution 3.0 License. Geoscientific Model Development Development of high resolution land surface parameters for the Community Land Model Y. Ke 1,2, L.
Defense Meteorological Satellite Program. Sprawl. Sprawl Highlights
 Sprawl Sprawl Highlights file://d:\index.html README for data files included on this CD-ROM Page 1 of 2 README for data files included on this CD-ROM ****************************************************************************
Effects of Land Use on Climate and Water Resources
 Effects of Land Use on Climate and Water Resources Principal Investigator: Gordon B. Bonan National Center for Atmospheric Research 1850 Table Mesa Drive, P.O. Box 3000 Boulder, CO 80307-3000 E-mail: bonan@ucar.edu
Soil Moisture Prediction and Assimilation
 Soil Moisture Prediction and Assimilation Analysis and Prediction in Agricultural Landscapes Saskatoon, June 19-20, 2007 STEPHANE BELAIR Meteorological Research Division Prediction and Assimilation Atmospheric
Land Cover Mapping in Support of LAI and FAPAR Retrievals from EOS-MODIS and MISR: Classification Methods and Sensitivities to Errors
 Land Cover Mapping in Support of LAI and FAPAR Retrievals from EOS-MODIS and MISR: Classification Methods and Sensitivities to Errors A. Lotsch, Y. Tian, M.A. Friedl, and R.B. Myneni Department of Geography,
Leveraging Sentinel-1 time-series data for mapping agricultural land cover and land use in the tropics
 Leveraging Sentinel-1 time-series data for mapping agricultural land cover and land use in the tropics Caitlin Kontgis caitlin@descarteslabs.com @caitlinkontgis Descartes Labs Overview What is Descartes
LAND USE MAPPING AND MONITORING IN THE NETHERLANDS (LGN5)
") LAND USE MAPPING AND MONITORING IN THE NETHERLANDS (LGN5) Hazeu, Gerard W. Wageningen University and Research Centre - Alterra, Centre for Geo-Information, The Netherlands; gerard.hazeu@wur.nl ABSTRACT
LAND USE MAPPING AND MONITORING IN THE NETHERLANDS (LGN5) Hazeu, Gerard W. Wageningen University and Research Centre - Alterra, Centre for Geo-Information, The Netherlands; gerard.hazeu@wur.nl ABSTRACT
Remote Sensing products and global datasets. Joint Research Centre, European Commission
 Remote Sensing products and global datasets Joint Research Centre, European Commission Setting the stage. Needs and requirements for integrated approach(es) for land degradation assessment. in Special
Chapter 52: An Introduction to Ecology and the Biosphere
 AP Biology Guided Reading Name Chapter 52: An Introduction to Ecology and the Biosphere Overview 1. What is ecology? 2. Study Figure 52.2. It shows the different levels of the biological hierarchy studied
ISO Land Cover for Agricultural Regions of Canada, Circa 2000 Data Product Specification. Revision: A
 ISO 19131 Land Cover for Agricultural Regions of Canada, Circa 2000 Data Product Specification Revision: A Data specification: Land Cover for Agricultural Regions, circa 2000 Table of Contents 1. OVERVIEW...
Geo-spatial Statistics with Globalland30
 UN International Workshop on Integrating Geospatial and Statistical Information Geo-spatial Statistics with Globalland30 Jun Chen 1,2 Lijun Chen 1, Ran Li 1 1 National Geomatics Center, China 2 International
Land Accounting. Sub-regional Workshop on Environment Statistics for South and South-West Asian Countries. Michael Bordt ESCAP
 Land Accounting Michael Bordt ESCAP bordt@un.org Sub-regional Workshop on Environment Statistics for South and South-West Asian Countries Feb. 6-8, 2017 Bangkok, Thailand Overview: Land Accounting Learning
High resolution wetland mapping I.
 High resolution wetland mapping I. Based on the teaching material developed by Steve Kas, GeoVille for WOIS Product Group #5 Dr. Zoltán Vekerdy and János Grósz z.vekerdy@utwente.nl vekerdy.zoltan@mkk.szie.hu
IMPROVING REMOTE SENSING-DERIVED LAND USE/LAND COVER CLASSIFICATION WITH THE AID OF SPATIAL INFORMATION
 IMPROVING REMOTE SENSING-DERIVED LAND USE/LAND COVER CLASSIFICATION WITH THE AID OF SPATIAL INFORMATION Yingchun Zhou1, Sunil Narumalani1, Dennis E. Jelinski2 Department of Geography, University of Nebraska,
West meets East: Monitoring and modeling urbanization in China Land Cover-Land Use Change Program Science Team Meeting April 3, 2012
 West meets East: Monitoring and modeling urbanization in China Land Cover-Land Use Change Program Science Team Meeting April 3, 2012 Annemarie Schneider Center for Sustainability and the Global Environment,
Preparation of LULC map from GE images for GIS based Urban Hydrological Modeling
 International Conference on Modeling Tools for Sustainable Water Resources Management Department of Civil Engineering, Indian Institute of Technology Hyderabad: 28-29 December 2014 Abstract Preparation
GLOBAL/CONTINENTAL LAND COVER MAPPING AND MONITORING
 GLOBAL/CONTINENTAL LAND COVER MAPPING AND MONITORING Ryutaro Tateishi, Cheng Gang Wen, and Jong-Geol Park Center for Environmental Remote Sensing (CEReS), Chiba University 1-33 Yayoi-cho Inage-ku Chiba
Utility of National Spatial Data for Conservation Design Projects
 Utility of National Spatial Data for Conservation Design Projects Steve Williams Biodiversity and Spatial Information Center North Carolina State University PIF CDW St. Louis, MO April 11, 2006 Types of
Name Date Class. well as the inland, found near the Tropics. 4. In the, or the regions near the Equator, you may find a lush
 WATER, CLIMATE, AND VEGETATION Vocabulary Activity DIRECTIONS: Fill in the Blanks Select a term from below to complete each of the following sentences. CHAPTER 1. The constant movement of water, a process
Worldwide inventory of landscapes through segmentation of global land cover dataset
 Worldwide inventory of landscapes through segmentation of global land cover dataset J. Nowosad* 1 and T. F. Stepinski 1 1 University of Cincinnati, Cincinnati, OH, 45221, USA * Email: nowosad.jakub@gmail.com
Introduction to risk assessment
 Introduction to risk assessment Inception workshop of the project Strengthening the regional preparedness, prevention and response against lumpy skin disease in Belarus, Moldova and Ukraine (TCP/RER/3605)
Land cover/land use mapping and cha Mongolian plateau using remote sens. Title. Author(s) Bagan, Hasi; Yamagata, Yoshiki. Citation Japan.
 Bagan, Hasi; Yamagata, Yoshiki. Citation Japan.") Title Land cover/land use mapping and cha Mongolian plateau using remote sens Author(s) Bagan, Hasi; Yamagata, Yoshiki International Symposium on "The Imp Citation Region Specific Systems". 6 Nove Japan.
Title Land cover/land use mapping and cha Mongolian plateau using remote sens Author(s) Bagan, Hasi; Yamagata, Yoshiki International Symposium on "The Imp Citation Region Specific Systems". 6 Nove Japan.
CH. 3: Climate and Vegetation
 CH. 3: Climate and Vegetation GROUP WORK RUBRIC Score of 50 (5): Superior - 100% A 5 is superior work, and has completed all requirements of the assignments, it is in order and its presentation is almost
Urban remote sensing: from local to global and back
 Urban remote sensing: from local to global and back Paolo Gamba University of Pavia, Italy A few words about Pavia Historical University (1361) in a nice town slide 3 Geoscience and Remote Sensing Society
forest tropical jungle swamp marsh prairie savanna pampas Different Ecosystems (rainforest)
") Different Ecosystems forest A region of land that is covered with many trees and shrubs. tropical jungle (rainforest) swamp A region with dense trees and a variety of plant life. It has a tropical climate.
Different Ecosystems forest A region of land that is covered with many trees and shrubs. tropical jungle (rainforest) swamp A region with dense trees and a variety of plant life. It has a tropical climate.
Vegetation Remote Sensing
 Vegetation Remote Sensing Huade Guan Prepared for Remote Sensing class Earth & Environmental Science University of Texas at San Antonio November 2, 2005 Outline Why do we study vegetation remote sensing?
Landuse and Landcover change analysis in Selaiyur village, Tambaram taluk, Chennai
 Landuse and Landcover change analysis in Selaiyur village, Tambaram taluk, Chennai K. Ilayaraja Department of Civil Engineering BIST, Bharath University Selaiyur, Chennai 73 ABSTRACT The synoptic picture
BIODIVERSITY CONSERVATION HABITAT ANALYSIS
 BIODIVERSITY CONSERVATION HABITAT ANALYSIS A GIS Comparison of Greater Vancouver Regional Habitat Mapping with Township of Langley Local Habitat Mapping Preface This report was made possible through the
Biomes and Ecosystems
 Name Biomes and Ecosystems Date How do Earth s biomes and ecosystems differ? Before You Read Before you read the chapter, think about what you know about biomes and ecosystems Record your thoughts in the
DETECTING HUMAN ACTIVITIES IN THE ARCTIC OCEAN BY CONSTRUCTING AND ANALYZING SUPER-RESOLUTION IMAGES FROM MODIS DATA INTRODUCTION
 DETECTING HUMAN ACTIVITIES IN THE ARCTIC OCEAN BY CONSTRUCTING AND ANALYZING SUPER-RESOLUTION IMAGES FROM MODIS DATA Shizhi Chen and YingLi Tian Department of Electrical Engineering The City College of
The role of soil moisture in influencing climate and terrestrial ecosystem processes
 1of 18 The role of soil moisture in influencing climate and terrestrial ecosystem processes Vivek Arora Canadian Centre for Climate Modelling and Analysis Meteorological Service of Canada Outline 2of 18
Yan Chen, Sunny Sun-Mack, and Robert F. Arduini Science Application International Corporation, Hampton, VA USA 23666
 5.6 CLEAR-SKY AND SURFACE NARROWBAND ALBEDO VARIATIONS DERIVED FROM VIRS AND MODIS DATA Yan Chen, Sunny Sun-Mack, and Robert F. Arduini Science Application International Corporation, Hampton, VA USA 23666
CHAPTER-7 INTERFEROMETRIC ANALYSIS OF SPACEBORNE ENVISAT-ASAR DATA FOR VEGETATION CLASSIFICATION
 147 CHAPTER-7 INTERFEROMETRIC ANALYSIS OF SPACEBORNE ENVISAT-ASAR DATA FOR VEGETATION CLASSIFICATION 7.1 INTRODUCTION: Interferometric synthetic aperture radar (InSAR) is a rapidly evolving SAR remote
Greening of Arctic: Knowledge and Uncertainties
 Greening of Arctic: Knowledge and Uncertainties Jiong Jia, Hesong Wang Chinese Academy of Science jiong@tea.ac.cn Howie Epstein Skip Walker Moscow, January 28, 2008 Global Warming and Its Impact IMPACTS
Sensitivity of AERSURFACE Results to Study Area and Location. Paper 2009-A-127-AWMA
 Sensitivity of AERSURFACE Results to Study Area and Location Paper 2009-A-127-AWMA Prepared by: Anthony J. Schroeder, CCM Senior Consultant George J. Schewe, CCM, QEP Principal Consultant Trinity Consultants
Regionalization of the IGBP Global Land Cover Map for Western Africa (Ghana, Togo and Benin)
") Regionalization of the IGBP Global Land Cover Map for Western Africa (Ghana, Togo and Benin) G. Menz Remote Sensing Research Group, Department of Geography, University of Bonn, Germany M. Bethke Remote
Regionalization of the IGBP Global Land Cover Map for Western Africa (Ghana, Togo and Benin) G. Menz Remote Sensing Research Group, Department of Geography, University of Bonn, Germany M. Bethke Remote
NESDIS Global Automated Satellite Snow Product: Current Status and Recent Results Peter Romanov
 NESDIS Global Automated Satellite Snow Product: Current Status and Recent Results Peter Romanov NOAA-CREST, City University of New York (CUNY) Center for Satellite Applications and Research (STAR), NOAA/NESDIS
Meteorology. Chapter 15 Worksheet 1
 Chapter 15 Worksheet 1 Meteorology Name: Circle the letter that corresponds to the correct answer 1) The Tropic of Cancer and the Arctic Circle are examples of locations determined by: a) measuring systems.
REMOTE SENSING ACTIVITIES. Caiti Steele
 REMOTE SENSING ACTIVITIES Caiti Steele REMOTE SENSING ACTIVITIES Remote sensing of biomass: Field Validation of Biomass Retrieved from Landsat for Rangeland Assessment and Monitoring (Browning et al.,
Measuring and Monitoring SDGs in Portugal: Ratio of land consumption rate to population growth rate Mountain Green Cover Index
 Measuring and Monitoring SDGs in Portugal: 11.3.1Ratio of land consumption rate to population growth rate 15.4.2 Mountain Green Cover Index United Nations World Geospatial Information Congress João David
3 Temperate and Polar Zones
 CHAPTER 3 3 Temperate and Polar Zones SECTION Climate BEFORE YOU READ After you read this section, you should be able to answer these questions: What biomes are found in the temperate zone? What biomes
Dataset Information: Land Cover. Title. Abstract. Supplemental. International Standards. Creation Date Last Update Data Type.
 Dataset Information: Land Cover Title Abstract Supplemental International Standards Land Cover The FAOSTAT Agri Environmental Indicators Land Cover domain contains data on area by land cover class, by
Evaluating Urban Vegetation Cover Using LiDAR and High Resolution Imagery
 Evaluating Urban Vegetation Cover Using LiDAR and High Resolution Imagery Y.A. Ayad and D. C. Mendez Clarion University of Pennsylvania Abstract One of the key planning factors in urban and built up environments
VCS MODULE VMD0018 METHODS TO DETERMINE STRATIFICATION
 VMD0018: Version 1.0 VCS MODULE VMD0018 METHODS TO DETERMINE STRATIFICATION Version 1.0 16 November 2012 Document Prepared by: The Earth Partners LLC. Table of Contents 1 SOURCES... 2 2 SUMMARY DESCRIPTION
4/18/2006 Olga N. Krankina, OSU
 (Northern Eurasia Landcover Dynamics Analysis) Monitoring and validating the distribution and change in land cover across Northern Eurasia Objectives Characterize land cover and its change across boreal
GLOBAL LAND COVER CLASSIFICATION BASED ON MICROWAVE POLARIZATION AND GRADIENT RATIO (MPGR)
") GLOBAL LAND COVER CLASSIFICATION BASED ON MICROWAVE POLARIZATION AND GRADIENT RATIO (MPGR) Mukesh, BOORI 1, Ralph, FERRARO 2 1 National Research Council (NRC) USA: Visiting Scientist 2 NOAA/NESDIS/STAR/
GLOBAL LAND COVER CLASSIFICATION BASED ON MICROWAVE POLARIZATION AND GRADIENT RATIO (MPGR) Mukesh, BOORI 1, Ralph, FERRARO 2 1 National Research Council (NRC) USA: Visiting Scientist 2 NOAA/NESDIS/STAR/
SUPPLEMENTARY INFORMATION
 SUPPLEMENTARY INFORMATION Radiative forcing and albedo feedback from the northern hemisphere cryosphere between 1979 and 2008 M. G. Flanner 1 *, K. M. Shell 2, M. Barlage 3, D. K. Perovich 4, & M. A. Tschudi
A Statistical Framework for Analysing Big Data Global Conference on Big Data for Official Statistics October, 2015 by S Tam, Chief
 A Statistical Framework for Analysing Big Data Global Conference on Big Data for Official Statistics 20-22 October, 2015 by S Tam, Chief Methodologist Australian Bureau of Statistics 1 Big Data (BD) Issues
How does the physical environment influence communities and ecosystems? Hoodoos in Cappadocia, Turkey
 Biomes of the World How does the physical environment influence communities and ecosystems? Hoodoos in Cappadocia, Turkey ecosystems are shaped by: abiotic factors climate/weather space Rainfall Soil air
Calculating Drive-time Buffers and Territories with Sparse Road Network
 Calculating Drive-time Buffers and Territories with Sparse Road Network Ran Tao 1, Jean-Claude Thill 1, James Walsh 1 Daniel Strandow 2, Michael Findley 3 1 University of North Carolina at Charlotte 2
Sensitivity of FIA Volume Estimates to Changes in Stratum Weights and Number of Strata. Data. Methods. James A. Westfall and Michael Hoppus 1
 Sensitivity of FIA Volume Estimates to Changes in Stratum Weights and Number of Strata James A. Westfall and Michael Hoppus 1 Abstract. In the Northeast region, the USDA Forest Service Forest Inventory
Climate Change and Vegetation Phenology
 Climate Change and Vegetation Phenology Climate Change In the Northeastern US mean annual temperature increased 0.7 C over 30 years (0.26 C per decade) Expected another 2-6 C over next century (Ollinger,
Land Surface Processes and Land Use Change. Lex Comber
 Land Surface Processes and Land Use Change Lex Comber ajc36@le.ac.uk Land Surface Processes and Land Use Change Geographic objects in GIS databases Detecting land use change using multitemporal imaging
New Land Cover & Land Use Data for the Chesapeake Bay Watershed
 New Land Cover & Land Use Data for the Chesapeake Bay Watershed Why? The Chesapeake Bay Program (CBP) partnership is in the process of improving and refining the Phase 6 suite of models used to inform