COMBINING ENUMERATION AREA MAPS AND SATELITE IMAGES (LAND COVER) FOR THE DEVELOPMENT OF AREA FRAME (MULTIPLE FRAMES) IN AN AFRICAN COUNTRY:
|
|
|
- Shauna McGee
- 6 years ago
- Views:
Transcription
1 COMBINING ENUMERATION AREA MAPS AND SATELITE IMAGES (LAND COVER) FOR THE DEVELOPMENT OF AREA FRAME (MULTIPLE FRAMES) IN AN AFRICAN COUNTRY: PRELIMINARY LESSONS FROM THE EXPERIENCE OF ETHIOPIA BY ABERASH TARIKU ABAYE NATIONAL STATISTICAL DATA QUALITY DIRECTORATE DIRECTOR CENTRAL STATISTICAL AGENCY ADDIS ABABA ETHIOPIA OCTOBER 2010 ADDIS ABABA
2 TABLE OF CONTENT 1. Introduction land cover classification 5 3. Creating the sampling frame in area frame survey using EA maps and land cover map Sample size and sample selection Training of field staff and field organization Data collection in the selected segments Estimation Validation of the area frame result Conclusion and recommendations Appendixes. 24 2
3 Acronyms CSA EA LCCS PPS PSU SSU Central Statistical Agency Enumeration Area Land Cover Classification Systems Probability Proportional to Size primary Sampling Unit Secondary Sampling Unit 3
4 1. Introduction CSA has been conducting Annual Agricultural Surveys for more than three decades. List frame approach is used in an integrated annual agricultural survey to collect agricultural data and area and production is estimated for Cereal, Pulses, Oilseeds, Vegetables, Root Crops, Fruit Crops and Other crops. Population and Housing Census is used as a frame for National Integrated Household Surveys. The recent population and housing census was conducted in This frame is list of enumeration areas delineated during the population census cartographic work. The enumeration areas are geo referenced. In the list frame approach stratified random sampling with Zones as strata, EAs as PSUs and households as SSUs is implemented. The PSUs are selected with pps systematic sampling size being the number of households from census. Once the PSUs are selected, households with in the PSU are listed and a sample Households (SSUs) is selected with systematic sampling. To see the feasibility of area frame and to compare the result with that of list frame and to come up with justifiable conclusion, CSA conducted a pilot survey for area frame in west shoa zone of the Oromiya region in 2008/09. A full scale pilot in area frame approach was followed in all zones of Oromia Region in By incorporating different comments, improvements and also additional variables, CSA is planning to conduct pilot survey for area frame in 2010/11. In the area frame the observation units are territorial subdivisions instead of list of holders/holdings as in the list frame. In area frame survey the sampling units are defined on a cartographic representation of the surveyed territory. The units of an area frame can be points, transects (straight lines of a certain length) or pieces of territory often named segments. CSA used segments as units of area frame. To develop the frame in the area frame approach, the digitized EA map from census cartographic work is overlaid on land cover map. The percent crop land for each EA is then 4
5 estimated using the land cover data. The EAs are stratified in to four stratas based on crop land intensity. Sample EAs are selected by PPS, size being number of segments in the EA and the sampled EA will be divided in to segments of size 40 hectare. Two segments from each sampled EA are selected systematically. The data for all fields with in the sampled segment will then be collected. 2. Land cover classification Land cover is the observed physical cover of the earth s surface. It is the physical material at the surface of the earth including grass, trees, bare ground, water, vegetation and artificial structure. In the land cover classification, the land is stratified in to land cover categories. The objective of Ethiopia Land Cover mapping activity is to carry out the national land cover data base using satellite images. Land cover is critical for sustainable management of natural resources, environmental protection, food security and also to provide core data for monitoring and modeling. CSA in collaboration with mapping agency, Ministry of Agriculture and Rural Development and Information Network Security Agency (INSA) are working on the land cover classification. This activity is funded by EU and FAO gives technical support. Operational subjects are handled by CSA, EU, and FAO where as the technical committee is organized from CSA, MOARD, EMA, INSA, EU, FAO and WFP. 5


6 The land cover activity is expected to produce a land cover data base which will provide a standardized, multipurpose product useful for environmental and agricultural purposes. In addition to the major out put of producing land cover data base for the country, the land cover classification will help to prepare base line for area frame. Satellite imagery, appropriate soft ware and predefined legend are required for the land cover classification. In CSA Ethiopia, spot 5 satellite imagery and MADCAT soft ware are used for land cover classification and appropriate legend for Ethiopia is prepared and used for the land cover classification. Intensive training on the land cover activities was given by FAO. The land cover data production activities include 1. Preliminary steps Ancillary data collection Spot index generation Spot mosaicking Segmentation Preliminary legend set up 2 interpretation preliminary interpretation field works photo keys definition 6

7 supervision Edge matching process Final interpretation Final legend set up 3. GIS activity Data base processing o Merge, dissolve, topology check, generalize, smoothing, simplifying...etc. o Data base finalization SPOT image 5 m resolution used for land cover classification 7
8 In the land cover classification, once the other preparatory activities are done, the image segmentation activities will follow. This image segmentation is based on a region merging technique of the division of image in to spatially continuous and spectrally homogeneous regions or objects. Segmentation is done using definiens soft ware. This segmentation is an activity of generating a polygon segments from spot 5 imagery based on spectral value of each pixel. 8

9 Example of image segmentation for the LCCS in Ethiopia using definiens
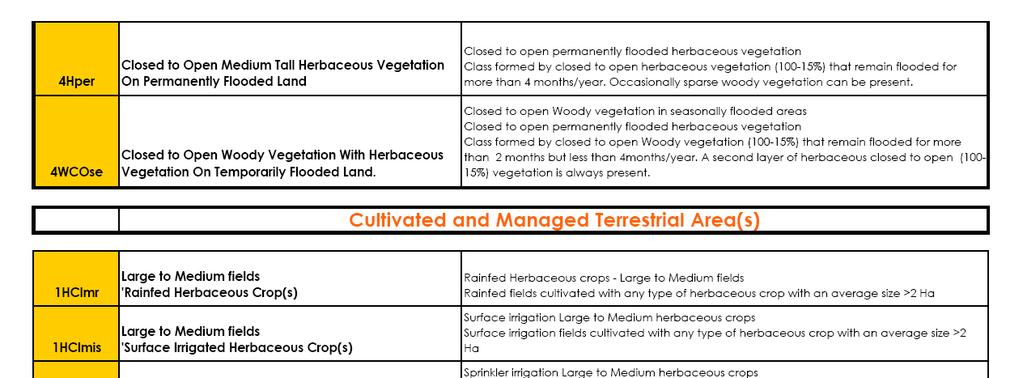
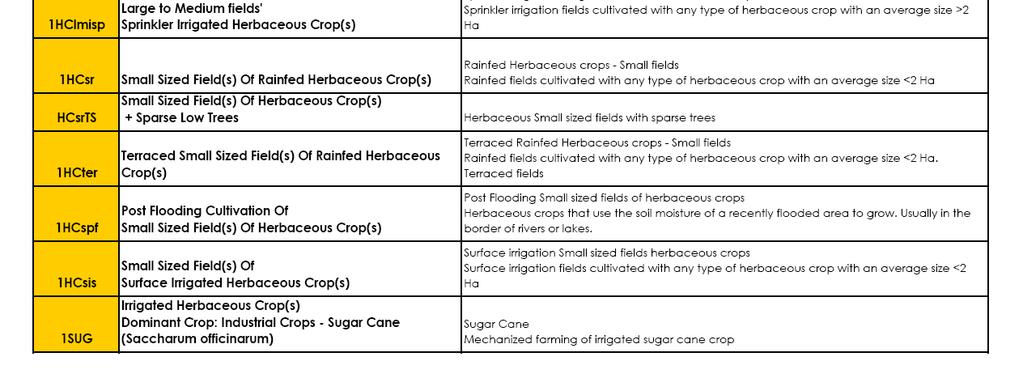
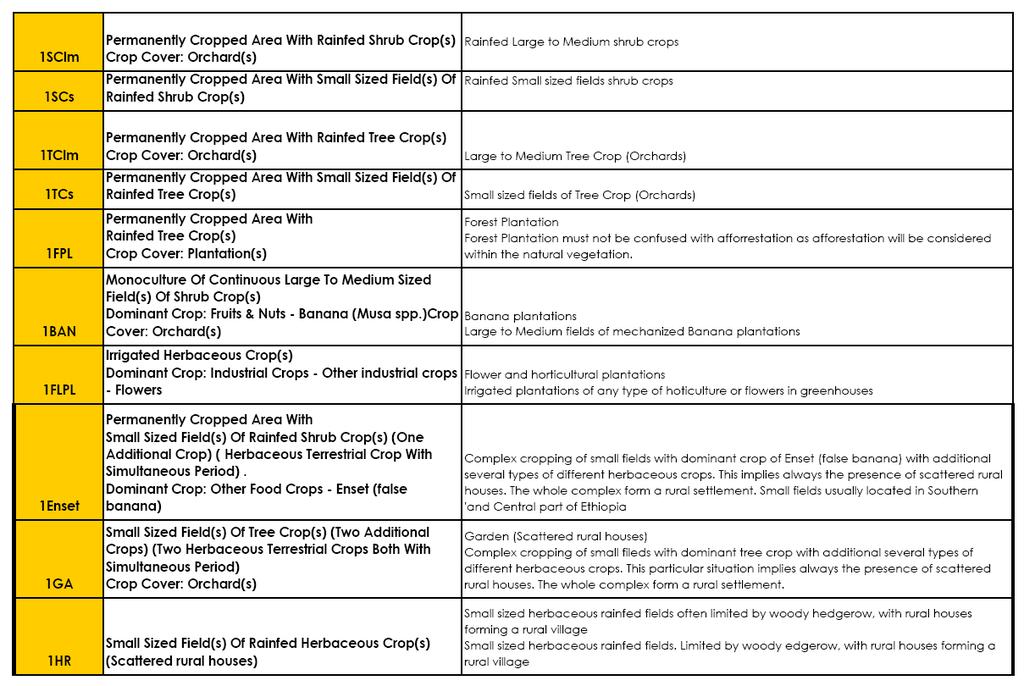
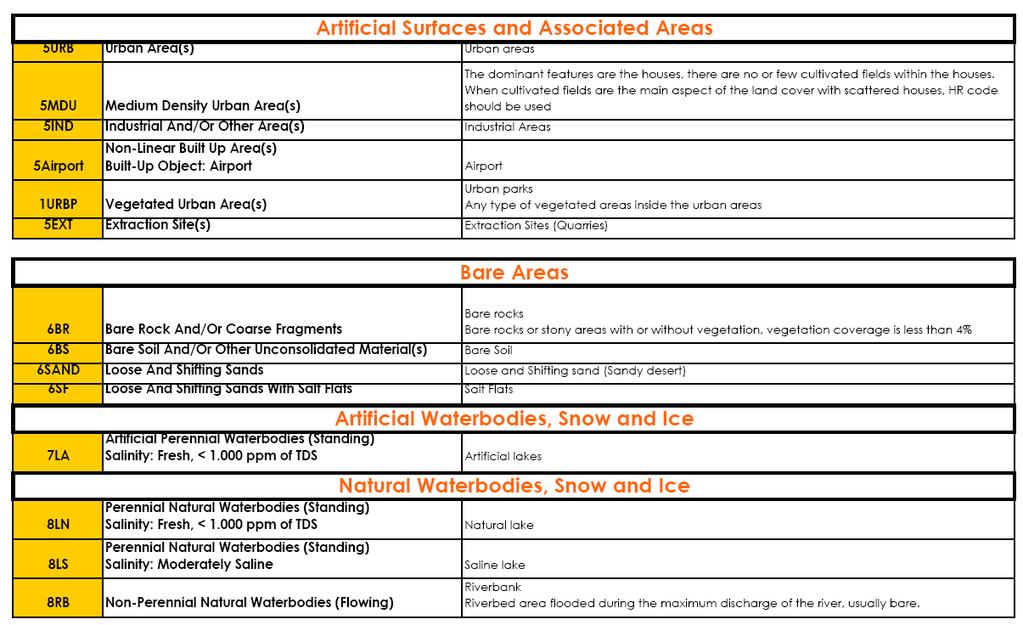
10 Based on the land cover classification system (LCCS) developed by FAO to prepare a legend, appropriate legend for Ethiopia is developed and used for the land cover classification. The land cover classification system (LCCS) which is used to prepare the legend is a comprehensive methodology for description, characterization, classification and comparison of most land cover features identified any where in the world, at any scale or level of detail. It is a basis for comparative classification. LCCS is created in response to a need for a harmonized and standardized collection and reporting on the status of land cover. The legend prepared for Ethiopia has the following classes. Natural and semi natural vegetation/ terrestrial and aquatic Cultivated areas/ terrestrial and aquatic Artificial surfaces and associated areas Classes bare areas Artificial and natural water bodies 15 classes 19 classes 6 classes 4 classes 6 classes The detail legend is given in appendix I
 soft ware is used for image processing.")

11 In this land cover activity MAD CAT (Mapping Device and Change analysis tool) soft ware is used for image processing. MAD CAT has multiple window editing environments. The interpretation in the LCCS is done by visual interpretation mechanism. 11

12 Dissolving activity will be conducted to minimize the number of polygons by merging adjacent polygons which have the same LCCS class. 12

13 After the interpretation work of each tile is completed, the independent shape files will be merged in to mosaics. 13
14 3. Creating the sampling frame in Area frame survey using EA maps and land cover map The basic steps in Area Frame Survey are creating the sampling frame for the study area, Stratify the area frame, define the sampling units, allocate and select the samples. Estimation and validation should be done after data collection. The first step in the area frame survey is frame development. Two inputs, enumeration area maps and land cover map, are used to develop area frame. The EAs which are the PSUs were delineated for the purpose of Population and Housing Census. The criteria to delineate an EA were to have households in rural areas. Topo-sheet was used as a base map and the GPS readings for the EA corners (turning points) were plotted on the toposheet and then the EA map was traced from the topo- sheet. The enumeration areas are geo referenced. To develop a frame in the area frame, CSA digitized EA map obtained from census cartographic work is overlaid on the land cover map..

15 174 EAs in one wereda are overlaid on the Land Cover database LCCS

16 The second step is to estimate the percent crop land (crop intensity) for each EA. The percent crop land for each EA is calculated using the interpreted imagery and appropriate soft ware. Percent crop land Values are shown in EAs
17 Stratification is done by forming groups of similar EAs with respect to crop intensity. The four strata s created based on crop intensity are Stratum I Crop intensity 75% or more Stratum II Crop intensity 50 to 74% Stratum III - Crop intensity 25 to 49% Stratum IV - Crop intensity less than 25% Enumeration areas classified in to stratum based on the percent crop land from land cover 0 TO TO TO AND ABOVE
18 Allocated numbers of EA from each stratum are selected by PPS and the sampled EAs are divided to segments of size 40 hectare. These segments are treated as SSU. The formation of the segments is based on 40 hectare area and clear identifiable physical boundaries as much as possible. Two segments are selected systematically from each EA for data collection. An EA which is subdivided into seven, 40 hectare SSUs 18
 shown above. 19")
19 Segment number 2 selected for the EA ( PSU) shown above. 19
20 4. Sample size and sample selection Enumeration areas are the primary sampling units (PSU) for the area frame. They are delineated during the population census cartographic work. These EAs are geo referenced. Once the EA is divided in to 40 hectare segments, the segments are considered as secondary sampling units (SSU). The Sample size for the oromiya region Area Frame was 215 PSUs (EAs) and 430 SSUs (segments - 2 segments per EA). This sample size was determined based on the precision and sample size in west shoa area frame pilot. These 215 EAs were allocated to the 17 zones proportional to the cultivated area from the report of the integrated survey. Within each zone allocation of the sample to each stratum was done on the basis of cultivated area from LCCS. EAs in each stratum are selected by PPS, size being number of segments. Two segments from each selected PSU (EA) are selected systematically. 5. Training of field staff and field organization Enumerators and supervisors were trained on data collection. The training includes both class room training and field practices. The class room training includes i) How to use segment map to identify and delineate a segment ii) How to use GPS iii) How to list fields with in a segment iv) How to measure fields by GPS v) How to fill forms on agricultural practices 20
21 6. Data collection in the selected segments Segments are cluster of fields (land uses). A segment map for each segment Is prepared and used for delineation in the field. Closed segment approach is used in this pilot to collect data. That is all the fields (land use) with in the selected segment are listed and questionnaire is filled in for each field. The first activity to be done by the enumerator in the data collection is to identify the segment boundary using segment map and GPS coordinates. GPS is used to delineate a segment and to measure all the fields with in the selected segment. For all the fields listed, their area is measured by GPS twice (clock wise and anti clock wise) and the result is filled in the form. The size of the segment which is around 40 hectare is used as an indirect control for data collection. Commercial farms should be treated separately and an independent survey is conducted for them. The frame with list of commercial farms is collected and a separate commercial farm survey using the list frame approach is conducted. Hence, multiple frame approach which is a combination of area frame and list frame for the private farms and commercial farms will be implemented. 7. Estimation Estimate of Total Yˆ h in each stratum is given by Yˆ = h nea i= 1 nhi W j= 1 hi Y hij The weight for each segment is calculated as M N sh hi W hi = = neamseanhi n M ea sh n hi The variance for the estimates in each stratum is calculated as 21
22 Var( Y h ) = nea n 1 ea nea i= 1 Y hi Y n h h 2 V ( Y ) = l h= 1 var( Y h ) 8. Validation of the area frame result To validate the result of the area frame, the estimate is compared with the list frame result. The comparison shows that the estimate for the area covered by different crops in area frame approach is higher than list frame result. Different activities were done to identify possible sources of the difference. These include Checking the methodology used in both approaches by estimating the number of households in both approach and comparing with the population census result Checking the list of crops covered in both approaches Estimating number of fields in both approaches Checking crop wise average area per field in both approaches Checking the multiplier for zones /stratum with abnormal weight Evaluating the adjustments made for non responding segments Evaluating the treatment of commercial farms in the area frame approach 9. Conclusion and recommendations The methodology used for both area frame and list frame follows standard procedure. The estimate of average field size and number of fields in both methods needs to be checked in the coming area frame survey 22
23 For zones with high nomadic population and the less cropland stratum, care should be taken in sampling and estimation. For the coming area frame survey areas with less than 2 percent cropland are excluded from the frame in these nomadic zones. In the area frame data some segments with area significantly greater than 40 was observed. One of the reasons for this was the case of segment boundaries dissecting a field. A clear instruction to include only part of the field with in the segment boundary should be written in the manual. Intensive and organized supervision also needs to be done and a control over around 40 hectare should also be done.. When commercial farms are observed in the segment, their data should be collected in a separate list frame approach. This was one of the sources for over estimation in the area frame survey. By accommodating all the recommendations above and also by adding crop cutting activity, the area frame data collection will be repeated in October 2010 in oromiya region. 23


24 Appendix 1 Ethiopia Legend AeA Ethiopia Legend 24
25 25
26 26
27 27
SEASONAL AGRICULTURE SURVEY (SAS) The Overview of the Multiple Frame Sample Survey in Rwanda
 The Overview of the Multiple Frame Sample Survey in Rwanda") SEASONAL AGRICULTURE SURVEY (SAS) The Overview of the Multiple Frame Sample Survey in Rwanda Sébastien MANZI Director of Economic Statistics December 16, 2013 National Institute of Statistics of Rwanda
SEASONAL AGRICULTURE SURVEY (SAS) The Overview of the Multiple Frame Sample Survey in Rwanda Sébastien MANZI Director of Economic Statistics December 16, 2013 National Institute of Statistics of Rwanda
Presented to Sub-regional workshop on integration of administrative data, big data and geospatial information for the compilation of SDG indicators
 Presented to Sub-regional workshop on integration of administrative data, big data and geospatial information for the compilation of SDG indicators 23-25 April,2018 Addis Ababa, Ethiopia By: Deogratius
IDENTIFYING THE MOST APPROPRIATE MASTER FRAME FOR AN INTEGRATED SURVEY
 IDENTIFYING THE MOST APPROPRIATE MASTER FRAME FOR AN INTEGRATED SURVEY IDENTIFYING THE MOST APPROPRIATE AREA FRAME, LIST FRAME AND MULTIPLE FRAME FOR SPECIFIC LANDSCAPE TYPES, TAKING INTO ACCOUNT THE KIND
LUCAS: A possible scheme for a master sampling frame. J. Gallego, MARS AGRI4CAST
 LUCAS: A possible scheme for a master sampling frame. J. Gallego, MARS AGRI4CAST Area frames of square segments Square segments on a classified image 2/16 Sampling farms through points farm a farm b farm
Directorate E: Sectoral and regional statistics Unit E-4: Regional statistics and geographical information LUCAS 2018.
 EUROPEAN COMMISSION EUROSTAT Directorate E: Sectoral and regional statistics Unit E-4: Regional statistics and geographical information Doc. WG/LCU 52 LUCAS 2018 Eurostat Unit E4 Working Group for Land
VALIDATING A SURVEY ESTIMATE - A COMPARISON OF THE GUYANA RURAL FARM HOUSEHOLD SURVEY AND INDEPENDENT RICE DATA
 VALIDATING A SURVEY ESTIMATE - A COMPARISON OF THE GUYANA RURAL FARM HOUSEHOLD SURVEY AND INDEPENDENT RICE DATA David J. Megill, U.S. Bureau of the Census I. Background While attempting to validate survey
Preparing the GEOGRAPHY for the 2011 Population Census of South Africa
 Preparing the GEOGRAPHY for the 2011 Population Census of South Africa Sharthi Laldaparsad Statistics South Africa; E-mail: sharthil@statssa.gov.za Abstract: Statistics South Africa (Stats SA) s Geography
Use of administrative registers for strengthening the geostatistical framework of the Census of Agriculture in Mexico
 Use of administrative registers for strengthening the geostatistical framework of the Census of Agriculture in Mexico Susana Pérez INEGI, Dirección de Censos y Encuestas Agropecuarias. Avenida José María
Module 2.1 Monitoring activity data for forests using remote sensing
 Module 2.1 Monitoring activity data for forests using remote sensing Module developers: Frédéric Achard, European Commission (EC) Joint Research Centre (JRC) Jukka Miettinen, EC JRC Brice Mora, Wageningen
GEOGRAPHIC INFORMATION SYSTEMS Session 8
 GEOGRAPHIC INFORMATION SYSTEMS Session 8 Introduction Geography underpins all activities associated with a census Census geography is essential to plan and manage fieldwork as well as to report results
Use of Geospatial Data: Philippine Statistics Authority 1
 Use of Geospatial Data: Philippine Statistics Authority 1 1 Presentation by Lisa Grace S. Bersales at the UNSC 2016 side event on Geospatial information and earth observations: supporting official statistics
AGOG 485/585 /APLN 533 Spring Lecture 5: MODIS land cover product (MCD12Q1). Additional sources of MODIS data
. Additional sources of MODIS data") AGOG 485/585 /APLN 533 Spring 2019 Lecture 5: MODIS land cover product (MCD12Q1). Additional sources of MODIS data Outline Current status of land cover products Overview of the MCD12Q1 algorithm Mapping
AGOG 485/585 /APLN 533 Spring 2019 Lecture 5: MODIS land cover product (MCD12Q1). Additional sources of MODIS data Outline Current status of land cover products Overview of the MCD12Q1 algorithm Mapping
An Automated Object-Oriented Satellite Image Classification Method Integrating the FAO Land Cover Classification System (LCCS).
.") An Automated Object-Oriented Satellite Image Classification Method Integrating the FAO Land Cover Classification System (LCCS). Ruvimbo Gamanya Sibanda Prof. Dr. Philippe De Maeyer Prof. Dr. Morgan De
An Automated Object-Oriented Satellite Image Classification Method Integrating the FAO Land Cover Classification System (LCCS). Ruvimbo Gamanya Sibanda Prof. Dr. Philippe De Maeyer Prof. Dr. Morgan De
Sampling: What you don t know can hurt you. Juan Muñoz
 Sampling: What you don t know can hurt you Juan Muñoz Outline of presentation Basic concepts Scientific Sampling Simple Random Sampling Sampling Errors and Confidence Intervals Sampling error and sample
CURRENT AND FUTURE ACTIVITIES TO IMPROVE STRATIFICATION FOR SEASONAL AGRICULTURE SURVEYS IN RWANDA
 CURRENT AND FUTURE ACTIVITIES TO IMPROVE STRATIFICATION FOR SEASONAL AGRICULTURE SURVEYS IN RWANDA Roselyne Ishimwe 1 *, Sebastian Manzi 1 National Institute of Statistics of Rwanda (NISR) *Email: Corresponding
Capabilities and Limitations of Land Cover and Satellite Data for Biomass Estimation in African Ecosystems Valerio Avitabile
 Capabilities and Limitations of Land Cover and Satellite Data for Biomass Estimation in African Ecosystems Valerio Avitabile Kaniyo Pabidi - Budongo Forest Reserve November 13th, 2008 Outline of the presentation
Yaneev Golombek, GISP. Merrick/McLaughlin. ESRI International User. July 9, Engineering Architecture Design-Build Surveying GeoSpatial Solutions
 Yaneev Golombek, GISP GIS July Presentation 9, 2013 for Merrick/McLaughlin Conference Water ESRI International User July 9, 2013 Engineering Architecture Design-Build Surveying GeoSpatial Solutions Purpose
Possible links between a sample of VHR images and LUCAS
 EUROPEAN COMMISSION EUROSTAT Directorate E: Sectoral and regional statistics Unit E-1: Farms, agro-environment and rural development CPSA/LCU/08 Original: EN (available in EN) WORKING PARTY "LAND COVER/USE
Pilot studies on the provision of harmonized land use/land cover statistics: Synergies between LUCAS and the national systems
 1 Pilot studies on the provision of harmonized land use/land cover statistics: Synergies between LUCAS and the national systems Norway Erik Engelien Division for Natural resources and Environmental Statistics,
Census Undertaking in Pastoral Areas and Application of New Technologies in the 2007 Population and Housing Census
 Census Undertaking in Pastoral Areas and Application of New Technologies in the 2007 Population and Housing Census By: Yakob Mudesir Seid & Samia Zekaria Gutu Central Statistical Agency of Ethiopia Abstract
Brazil Paper for the. Second Preparatory Meeting of the Proposed United Nations Committee of Experts on Global Geographic Information Management
 Brazil Paper for the Second Preparatory Meeting of the Proposed United Nations Committee of Experts on Global Geographic Information Management on Data Integration Introduction The quick development of
VCS MODULE VMD0018 METHODS TO DETERMINE STRATIFICATION
 VMD0018: Version 1.0 VCS MODULE VMD0018 METHODS TO DETERMINE STRATIFICATION Version 1.0 16 November 2012 Document Prepared by: The Earth Partners LLC. Table of Contents 1 SOURCES... 2 2 SUMMARY DESCRIPTION
The Use of Random Geographic Cluster Sampling to Survey Pastoralists. Kristen Himelein, World Bank Addis Ababa, Ethiopia January 23, 2013
 The Use of Random Geographic Cluster Sampling to Survey Pastoralists Kristen Himelein, World Bank Addis Ababa, Ethiopia January 23, 2013 Paper This presentation is based on the paper by Kristen Himelein
NATIONAL MAPPING EFFORTS: THE PHILIPPINES
 NATIONAL MAPPING EFFORTS: THE PHILIPPINES Dr. RIJALDIA N. SANTOS DENR National Mapping and Resource Information Authority (NAMRIA) May 30, 2018 Land Cover/Land Use Changes (LC/LUC) and Its Impacts on Environment
Use of GIS/GPS in Support of the Philippines 2020 Census of Population and Housing
 Use of GIS/GPS in Support of the Philippines 2020 Census of Population and Housing Regional Workshop on the Use of Electronic Data Collection Technology in Population and Housing Censuses UN ESCAP, Bangkok
Summary and Statistical Report of the 2007 Population and Housing Census Results 1
 Summary and Statistical Report of the 2007 Population and Housing Census Results 1 2 Summary and Statistical Report of the 2007 Population and Housing Census Results This document was printed by United
Sensitivity of FIA Volume Estimates to Changes in Stratum Weights and Number of Strata. Data. Methods. James A. Westfall and Michael Hoppus 1
 Sensitivity of FIA Volume Estimates to Changes in Stratum Weights and Number of Strata James A. Westfall and Michael Hoppus 1 Abstract. In the Northeast region, the USDA Forest Service Forest Inventory
LUCAS: current product and its evolutions
 LUCAS: current product and its evolutions Workshop Land Use and Land Cover products: challenges and opportunities Brussels 15 Nov 2017 Eurostat E4: estat-dl-lucas@ec.europa.eu Contents 1) The context 2)
Séminaire de l'umr Economie Publique. Spatial Disaggregation of Agricultural. Raja Chakir. February 21th Spatial Disaggregation.
 Séminaire de l'umr Economie Publique : An : An February 21th 2006 Outline : An 1 2 3 4 : An The latest reform the Common Policy (CAP) aims to encourage environmentally friendly farming practices in order
GDDS2: GIS AND SMALL AREA STATISTICS. Page 1 of 6
 GDDS2: GIS AD SMALL AREA STATISTICS GDDS2: CHECKLIST Ghana GHAA: AEXURE C Background ame of country Ghana Size of population 21m % of population in urban App 60% Size of country (sq km) 238533 sqkm Geographical
KNOWLEDGE-BASED CLASSIFICATION OF LAND COVER FOR THE QUALITY ASSESSEMENT OF GIS DATABASE. Israel -
 KNOWLEDGE-BASED CLASSIFICATION OF LAND COVER FOR THE QUALITY ASSESSEMENT OF GIS DATABASE Ammatzia Peled a,*, Michael Gilichinsky b a University of Haifa, Department of Geography and Environmental Studies,
Part 7: Glossary Overview
 Part 7: Glossary Overview In this Part This Part covers the following topic Topic See Page 7-1-1 Introduction This section provides an alphabetical list of all the terms used in a STEPS surveillance with
CHAPTER 1 THE UNITED STATES 2001 NATIONAL LAND COVER DATABASE
 CHAPTER 1 THE UNITED STATES 2001 NATIONAL LAND COVER DATABASE Collin Homer*, Jon Dewitz, Joyce Fry, and Nazmul Hossain *U.S. Geological Survey (USGS) Center for Earth Resources Observation and Science
New LPIS data and their quality control in Macedonia. Pavel TROJACEK & Adam ZLOTY EKOTOXA s.r.o.
 New LPIS data and their quality control 15th GeoCAP Conference, Taormina, Italy 18 20 November 2009 Outline of the presentation Intro: About Macedonia 1. Design of LPIS 2. LPIS methodology 3. New spatial
Validation and verification of land cover data Selected challenges from European and national environmental land monitoring
 Validation and verification of land cover data Selected challenges from European and national environmental land monitoring Gergely Maucha head, Environmental Applications of Remote Sensing Institute of
Extent. Level 1 and 2. October 2017
 Extent Level 1 and 2 October 2017 Overview: Extent account 1. Learning objectives 2. Review of Level 0 (5m) 3. Level 1 (Compilers): Concepts (15m) Group exercise and discussion (15m) 4. Level 2 (Data Providers)
Uganda - National Panel Survey
 Microdata Library Uganda - National Panel Survey 2013-2014 Uganda Bureau of Statistics - Government of Uganda Report generated on: June 7, 2017 Visit our data catalog at: http://microdata.worldbank.org
Coalfields Limited. Based on Satellite Data for the Year Central Coalfields Limited Ranchi, Jharkhand. Submitted to:
 Land Restoration / Reclamation Monitoring of less than 5 m cu. m. (Coal + OB) Capacity Open Cast Coal Mines of Central Coalfields Limited Based on Satellite Data for the Year 2011. N URIMARI (BIRSA) OCP,CCL
ISO Land Cover for Agricultural Regions of Canada, Circa 2000 Data Product Specification. Revision: A
 ISO 19131 Land Cover for Agricultural Regions of Canada, Circa 2000 Data Product Specification Revision: A Data specification: Land Cover for Agricultural Regions, circa 2000 Table of Contents 1. OVERVIEW...
IMPROVING REMOTE SENSING-DERIVED LAND USE/LAND COVER CLASSIFICATION WITH THE AID OF SPATIAL INFORMATION
 IMPROVING REMOTE SENSING-DERIVED LAND USE/LAND COVER CLASSIFICATION WITH THE AID OF SPATIAL INFORMATION Yingchun Zhou1, Sunil Narumalani1, Dennis E. Jelinski2 Department of Geography, University of Nebraska,
DATA SOURCES AND INPUT IN GIS. By Prof. A. Balasubramanian Centre for Advanced Studies in Earth Science, University of Mysore, Mysore
 DATA SOURCES AND INPUT IN GIS By Prof. A. Balasubramanian Centre for Advanced Studies in Earth Science, University of Mysore, Mysore 1 1. GIS stands for 'Geographic Information System'. It is a computer-based
Land accounting in Québec: Pilot project for a sub-provincial area
 Land accounting in Québec: Pilot project for a sub-provincial area Stéphanie Uhde 8th meeting of the London Group on Environmental Accounting Ottawa, 2 October, 2012 Province of Québec Area: 1 667 441
Introduction to Sample Survey
 Introduction to Sample Survey Girish Kumar Jha gjha_eco@iari.res.in Indian Agricultural Research Institute, New Delhi-12 INTRODUCTION Statistics is defined as a science which deals with collection, compilation,
Digitization in a Census
 Topics Connectivity of Geographic Data Sketch Maps Data Organization and Geodatabases Managing a Digitization Project Quality and Control Topology Metadata 1 Topics (continued) Interactive Selection Snapping
GPS and GIS use in Soil Mapping of The Sugarcane Industry. Lancelot H. White. Sugar Industry Research Institute
 73 rd Annual Jamaican Association of Sugar Technologists Conference 1 GPS and GIS use in Soil Mapping of The Sugarcane Industry By Lancelot H. White Sugar Industry Research Institute Presentation Outline
How to Develop Master Sampling Frames using Dot Sampling Method and Google Earth
 How to Develop Master Sampling Frames using Dot Sampling Method and Google Earth Issei Jinguji. Agricultural statistics. JICA expert. Project for Capacity Development for the ASDP Monitoring and Evaluation
Evaluating Urban Vegetation Cover Using LiDAR and High Resolution Imagery
 Evaluating Urban Vegetation Cover Using LiDAR and High Resolution Imagery Y.A. Ayad and D. C. Mendez Clarion University of Pennsylvania Abstract One of the key planning factors in urban and built up environments
The Road to Data in Baltimore
 Creating a parcel level database from high resolution imagery By Austin Troy and Weiqi Zhou University of Vermont, Rubenstein School of Natural Resources State and local planning agencies are increasingly
Object Oriented Classification Using High-Resolution Satellite Images for HNV Farmland Identification. Shafique Matin and Stuart Green
 Object Oriented Classification Using High-Resolution Satellite Images for HNV Farmland Identification Shafique Matin and Stuart Green REDP, Teagasc Ashtown, Dublin, Ireland Correspondence: shafique.matin@teagasc.ie
Habitats habitat concept, identification, methodology for habitat mapping, organization of mapping
 Habitats habitat concept, identification, methodology for habitat mapping, organization of mapping Rastislav Lasák & Ján Šeffer Training Implementation of Habitats Directive - Habitats and Plants 1 What
Facilitating Survey Sampling in Low- and Middle-Income Contexts Through Satellite Maps and Basic Mobile Computing Technology
 Facilitating Survey Sampling in Low- and Middle-Income Contexts Through Satellite Maps and Basic Mobile Computing Technology 6 th European Survey Association Conference Survey Research in Developing Countries
MANUAL ON THE BSES: LAND USE/LAND COVER
 6. Environment Protection, Management and Engagement 2. Environmental Resources and their Use 5. Human Habitat and Environmental Health 1. Environmental Conditions and Quality 4. Disasters and Extreme
Crowdsourcing approach for large scale mapping of built-up land
 Crowdsourcing approach for large scale mapping of built-up land Kavinda Gunasekara Kavinda@ait.asia Geoinformatics Center Asian Institute of Technology, Thailand. Regional expert workshop on land accounting
NR402 GIS Applications in Natural Resources. Lesson 9: Scale and Accuracy
 NR402 GIS Applications in Natural Resources Lesson 9: Scale and Accuracy 1 Map scale Map scale specifies the amount of reduction between the real world and the map The map scale specifies how much the
A GIS based Land Capability Classification of Guang Watershed, Highlands of Ethiopia
 A GIS based Land Capability Classification of Guang Watershed, Highlands of Ethiopia Gizachew Ayalew 1 & Tiringo Yilak 2 1 Amhara Design and Supervision Works Enterprise (ADSWE), Bahir Dar, Ethiopia 2
Training on national land cover classification systems. Toward the integration of forest and other land use mapping activities.
 Training on national land cover classification systems Toward the integration of forest and other land use mapping activities. Guiana Shield 9 to 13 March 2015, Paramaribo, Suriname Background Sustainable
Formalizing the Concepts: Simple Random Sampling. Juan Muñoz Kristen Himelein March 2012
 Formalizing the Concepts: Simple Random Sampling Juan Muñoz Kristen Himelein March 2012 Purpose of sampling To study a portion of the population through observations at the level of the units selected,
Syllabus Reminders. Geographic Information Systems. Components of GIS. Lecture 1 Outline. Lecture 1 Introduction to Geographic Information Systems
 Syllabus Reminders Geographic Information s Lecture Introduction to Geographic Information s. Class Info: www.saigis.com/class/ 2. Office T / TH (8:00-9:30 a.m.) and (2:30 3:30pm) or Appt 3. Email: burgerpr@unk.edu
Sample size and Sampling strategy
 Sample size and Sampling strategy Dr. Abdul Sattar Programme Officer, Assessment & Analysis Do you agree that Sample should be a certain proportion of population??? Formula for sample N = p 1 p Z2 C 2
Submitted to: Central Coalfields Limited Ranchi, Jharkhand. Ashoka & Piparwar OCPs, CCL
 Land Restoration / Reclamation Monitoring of more than 5 million cu. m. (Coal + OB) Capacity Open Cast Coal Mines of Central Coalfields Limited Based on Satellite Data for the Year 2013 Ashoka & Piparwar
Land accounting perspective on water resources management
 European Water 60: 161-166, 2017. 2017 E.W. Publications Land accounting perspective on water resources management G.T. Paschos, G.E. Bariamis * and E.A. Baltas Department of Water Resources and Environmental
VERY HIGH RESOLUTION SATELLITE DATA FOR CADASTRAL MAPPING
 132 Romuald Kaczynski, Michal Kedzierski Military University of Technology, Warsaw, Poland VERY HIGH RESOLUTION SATELLITE DATA FOR CADASTRAL MAPPING Kaczynski Romuald, Kedzierski Michal, 2013 В статье
Geospatial Data, Services, and Products. National Surveying, mapping and geospatial conference
 Geospatial Data, Services, and Products Federal Programs -- USDA NRCS National Surveying, mapping and geospatial conference March 15, 2016 NRCS Applications using Geosaptial Products & Services Field
Urban Tree Canopy Assessment Purcellville, Virginia
 GLOBAL ECOSYSTEM CENTER www.systemecology.org Urban Tree Canopy Assessment Purcellville, Virginia Table of Contents 1. Project Background 2. Project Goal 3. Assessment Procedure 4. Economic Benefits 5.
Submitted to Central Coalfields Limited BHURKUNDA OCP, CCL
 Land Restoration / Reclamation Monitoring of Open Cast Coal Mines of Central Coalfields Limited producing less than 5 m cu m. (Coal+ OB) based on Satellite Data for the Year 2013 BHURKUNDA OCP, CCL Submitted
DEVELOPMENT OF DIGITAL CARTOGRAPHIC DATABASE FOR MANAGING THE ENVIRONMENT AND NATURAL RESOURCES IN THE REPUBLIC OF SERBIA
 DEVELOPMENT OF DIGITAL CARTOGRAPHIC BASE FOR MANAGING THE ENVIRONMENT AND NATURAL RESOURCES IN THE REPUBLIC OF SERBIA Dragutin Protic, Ivan Nestorov Institute for Geodesy, Faculty of Civil Engineering,
Formalizing the Concepts: Simple Random Sampling. Juan Muñoz Kristen Himelein March 2013
 Formalizing the Concepts: Simple Random Sampling Juan Muñoz Kristen Himelein March 2013 Purpose of sampling To study a portion of the population through observations at the level of the units selected,
Improving rural statistics. Defining rural territories and key indicators of rural development
 Improving rural statistics Defining rural territories and key indicators of rural development Improving rural statistics Improving Rural Statistics In 2016, the Global Strategy to improve Agricultural
CENSUS MAPPING WITH GIS IN NAMIBIA. BY Mrs. Ottilie Mwazi Central Bureau of Statistics Tel: October 2007
 CENSUS MAPPING WITH GIS IN NAMIBIA BY Mrs. Ottilie Mwazi Central Bureau of Statistics E-mail: omwazi@npc.gov.na Tel: + 264 61 283 4060 October 2007 Content of Presentation HISTORICAL BACKGROUND OF CENSUS
LAND COVER CATEGORY DEFINITION BY IMAGE INVARIANTS FOR AUTOMATED CLASSIFICATION
 LAND COVER CATEGORY DEFINITION BY IMAGE INVARIANTS FOR AUTOMATED CLASSIFICATION Nguyen Dinh Duong Environmental Remote Sensing Laboratory Institute of Geography Hoang Quoc Viet Rd., Cau Giay, Hanoi, Vietnam
Airborne Multi-Spectral Minefield Survey
 Dirk-Jan de Lange, Eric den Breejen TNO Defence, Security and Safety Oude Waalsdorperweg 63 PO BOX 96864 2509 JG The Hague THE NETHERLANDS Phone +31 70 3740857 delange@fel.tno.nl ABSTRACT The availability
An Internet-based Agricultural Land Use Trends Visualization System (AgLuT)
") An Internet-based Agricultural Land Use Trends Visualization System (AgLuT) Prepared for Missouri Department of Natural Resources Missouri Department of Conservation 07-01-2000-12-31-2001 Submitted by
An Internet-based Agricultural Land Use Trends Visualization System (AgLuT) Prepared for Missouri Department of Natural Resources Missouri Department of Conservation 07-01-2000-12-31-2001 Submitted by
Site Selection & Monitoring Plot Delineation
 Site Selection & Monitoring Plot Delineation Overview Site selection and delineation of monitoring plots within those sites is the first step in broad scale monitoring of monarch butterfly populations
New Land Cover & Land Use Data for the Chesapeake Bay Watershed
 New Land Cover & Land Use Data for the Chesapeake Bay Watershed Why? The Chesapeake Bay Program (CBP) partnership is in the process of improving and refining the Phase 6 suite of models used to inform
System of Environmental-Economic Accounting. Advancing the SEEA Experimental Ecosystem Accounting. Extent Account (Levels 1 and 2)
") Advancing the SEEA Experimental Ecosystem Accounting Extent Account (Levels 1 and 2) Overview: The Extent Account 1. Learning objectives 2. Review of Level 0 (5m) What is it? Why do we need it? What does
Advancing the SEEA Experimental Ecosystem Accounting Extent Account (Levels 1 and 2) Overview: The Extent Account 1. Learning objectives 2. Review of Level 0 (5m) What is it? Why do we need it? What does
Abstract. TECHNOFAME- A Journal of Multidisciplinary Advance Research. Vol.2 No. 2, (2013) Received: Feb.2013; Accepted Oct.
 Received: Feb.2013; Accepted Oct.") Vol.2 No. 2, 83-87 (2013) Received: Feb.2013; Accepted Oct. 2013 Landuse Pattern Analysis Using Remote Sensing: A Case Study of Morar Block, of Gwalior District, M.P. Subhash Thakur 1 Akhilesh Singh 2
Vol.2 No. 2, 83-87 (2013) Received: Feb.2013; Accepted Oct. 2013 Landuse Pattern Analysis Using Remote Sensing: A Case Study of Morar Block, of Gwalior District, M.P. Subhash Thakur 1 Akhilesh Singh 2
Programme. MC : Byron Anangwe. Morning Session
 Programme MC : Byron Anangwe Morning Session DAY 2 Summary MC : Byron Anangwe The USGS global land cover mapping initiative Land use and land cover mapping at the Joint Research Centre Alan Belward FAO
Deriving Uncertainty of Area Estimates from Satellite Imagery using Fuzzy Land-cover Classification
 International Journal of Information and Computation Technology. ISSN 0974-2239 Volume 3, Number 10 (2013), pp. 1059-1066 International Research Publications House http://www. irphouse.com /ijict.htm Deriving
Spanish national plan for land observation: new collaborative production system in Europe
 ADVANCE UNEDITED VERSION UNITED NATIONS E/CONF.103/5/Add.1 Economic and Social Affairs 9 July 2013 Tenth United Nations Regional Cartographic Conference for the Americas New York, 19-23, August 2013 Item
AN INVESTIGATION OF AUTOMATIC CHANGE DETECTION FOR TOPOGRAPHIC MAP UPDATING
 AN INVESTIGATION OF AUTOMATIC CHANGE DETECTION FOR TOPOGRAPHIC MAP UPDATING Patricia Duncan 1 & Julian Smit 2 1 The Chief Directorate: National Geospatial Information, Department of Rural Development and
Chesapeake Bay Remote Sensing Pilot Executive Briefing
 Chesapeake Bay Remote Sensing Pilot Executive Briefing Introduction In his Executive Order 13506 in May 2009, President Obama stated The Chesapeake Bay is a national treasure constituting the largest estuary
THE QUALITY CONTROL OF VECTOR MAP DATA
 THE QUALITY CONTROL OF VECTOR MAP DATA Wu Fanghua Liu Pingzhi Jincheng Xi an Research Institute of Surveying and Mapping (P.R.China ShanXi Xi an Middle 1 Yanta Road 710054) (e-mail :wufh999@yahoo.com.cn)
Introduction to Survey Data Analysis
 Introduction to Survey Data Analysis JULY 2011 Afsaneh Yazdani Preface Learning from Data Four-step process by which we can learn from data: 1. Defining the Problem 2. Collecting the Data 3. Summarizing
1. Introduction. S.S. Patil 1, Sachidananda 1, U.B. Angadi 2, and D.K. Prabhuraj 3
 Cloud Publications International Journal of Advanced Remote Sensing and GIS 2014, Volume 3, Issue 1, pp. 525-531, Article ID Tech-249 ISSN 2320-0243 Research Article Open Access Machine Learning Technique
CHANGE DETECTION USING REMOTE SENSING- LAND COVER CHANGE ANALYSIS OF THE TEBA CATCHMENT IN SPAIN (A CASE STUDY)
") CHANGE DETECTION USING REMOTE SENSING- LAND COVER CHANGE ANALYSIS OF THE TEBA CATCHMENT IN SPAIN (A CASE STUDY) Sharda Singh, Professor & Programme Director CENTRE FOR GEO-INFORMATICS RESEARCH AND TRAINING
CHANGE DETECTION USING REMOTE SENSING- LAND COVER CHANGE ANALYSIS OF THE TEBA CATCHMENT IN SPAIN (A CASE STUDY) Sharda Singh, Professor & Programme Director CENTRE FOR GEO-INFORMATICS RESEARCH AND TRAINING
A Comprehensive Inventory of the Number of Modified Stream Channels in the State of Minnesota. Data, Information and Knowledge Management.
 A Comprehensive Inventory of the Number of Modified Stream Channels in the State of Minnesota Data, Information and Knowledge Management Glenn Skuta Environmental Analysis and Outcomes Division Minnesota
Understanding and Measuring Urban Expansion
 VOLUME 1: AREAS AND DENSITIES 21 CHAPTER 3 Understanding and Measuring Urban Expansion THE CLASSIFICATION OF SATELLITE IMAGERY The maps of the urban extent of cities in the global sample were created using
Environmental Impact Assessment Land Use and Land Cover CISMHE 7.1 INTRODUCTION
 7 LAND USE AND LAND COVER 7.1 INTRODUCTION The knowledge of land use and land cover is important for many planning and management activities as it is considered an essential element for modeling and understanding
7.1 INTRODUCTION 7.2 OBJECTIVE
 7 LAND USE AND LAND COVER 7.1 INTRODUCTION The knowledge of land use and land cover is important for many planning and management activities as it is considered as an essential element for modeling and
Spatial Disaggregation of Land Cover and Cropping Information: Current Results and Further steps
 CAPRI CAPRI Spatial Disaggregation of Land Cover and Cropping Information: Current Results and Further steps Renate Koeble, Adrian Leip (Joint Research Centre) Markus Kempen (Universitaet Bonn) JRC-AL
Land Cover and Land use in Environment Statistics
 UNITED NATIONS STATISTICS DIVISION (UNSD) Workshop on Environment Statistics in support of the implementation of the Framework for the Development of Environment Statistics (FDES 2013) Balaclava, Mauritius
Combining Geospatial and Statistical Data for Analysis & Dissemination
 Combining Geospatial and Statistical Data for Analysis & Dissemination (with Special Reference to Qatar Census 2010) Presentation by Mansoor Al Malki, Director of IT Department Qatar Statistics Authority
These modules are covered with a brief information and practical in ArcGIS Software and open source software also like QGIS, ILWIS.
 Online GIS Training and training modules covered are: 1. ArcGIS, Analysis, Fundamentals and Implementation 2. ArcGIS Web Data Sharing 3. ArcGIS for Desktop 4. ArcGIS for Server These modules are covered
GIS ADMINISTRATOR / WEB DEVELOPER EVANSVILLE-VANDERBURGH COUNTY AREA PLAN COMMISSION
 GIS ADMINISTRATOR / WEB DEVELOPER EVANSVILLE-VANDERBURGH COUNTY AREA PLAN COMMISSION SALARY RANGE INITIATION $43,277 SIX MONTHS $45,367 POSITION GRADE PAT VI The Evansville-Vanderburgh County Area Plan
Denis White NSI Technical Services Corporation 200 SW 35th St. Corvallis, Oregon 97333
 POLYGON OVERLAY TO SUPPORT POINT SAMPLE MAPPING: THE NATIONAL RESOURCES INVENTORY Denis White NSI Technical Services Corporation 200 SW 35th St. Corvallis, Oregon 97333 Margaret Maizel ' American Farmland
Wetland Mapping. Wetland Mapping in the United States. State Wetland Losses 53% in Lower US. Matthew J. Gray University of Tennessee
 Wetland Mapping Caribbean Matthew J. Gray University of Tennessee Wetland Mapping in the United States Shaw and Fredine (1956) National Wetlands Inventory U.S. Fish and Wildlife Service is the principle
CORINE LAND COVER CROATIA
 CORINE LAND COVER CROATIA INTRO Primary condition in making decisions directed to land cover and natural resources management is presence of knowledge and high quality information about biosphere and its
DATA DISAGGREGATION BY GEOGRAPHIC
 PROGRAM CYCLE ADS 201 Additional Help DATA DISAGGREGATION BY GEOGRAPHIC LOCATION Introduction This document provides supplemental guidance to ADS 201.3.5.7.G Indicator Disaggregation, and discusses concepts
Common geographies for dissemination of SDG Indicators
 5 th High Level Forum on United Nations GGIM, Mexico 2017 Common geographies for dissemination of SDG Indicators Understanding statistical and geodetic division of territory Janusz Dygaszewicz Central
Advanced Methods for Agricultural and Agroenvironmental. Emily Berg, Zhengyuan Zhu, Sarah Nusser, and Wayne Fuller
 Advanced Methods for Agricultural and Agroenvironmental Monitoring Emily Berg, Zhengyuan Zhu, Sarah Nusser, and Wayne Fuller Outline 1. Introduction to the National Resources Inventory 2. Hierarchical