ADePT Software platform for Automated Economic Analysis
|
|
|
- Junior Wheeler
- 5 years ago
- Views:
Transcription
1 ADePT Software platform for Automated Economic Analysis Michael Lokshin, Zurab Sajaia and Sergiy Radyakin DECRG-PO The World Bank

2 Step 1: Data and Output

3 Step 2: Household variables

4 Step 3: Individual variable

5 Step 4: Tables and Graphs
6 Why automate? To free resources for more meaningful and interesting tasks. Minimize human errors. Significantly speed-up production of basic results. Produce print-ready tables/graphs/reports Easily introduce new cutting-edge techniques and methods of poverty analysis. The automation tools could be used as valuable research instruments, tools for sensitivity analysis and educational tools. Might be helpful in situation of limited data access Simple checking of previous reports/results 6
7 ADePT Poverty: Tables and Graphs Tables and graphs are selected based on PA from: Bulgaria, Bangladesh, Honduras, Georgia, Jordan, Mongolia, Nepal, Sri Lanka, Ukraine The program automatically generates the list of tables/graphs that could be produced based on the defined variables. Three versions of each table: actual table, table with standard errors, table with frequencies in each cell. Users can apply IF conditions and change titles of the tables/graphs. ADePT was tested on datasets from Georgia, Jordan, Serbia, Ukraine, Montenegro, Russia, Romania, Lesotho, Gambia. 7
8 ADePT Poverty: Data and Variables Accepts individual-level data in STATA format One or more years (8 years tested so far) of data Required variables: Household ID Consumption aggregate: per person or per equivalent adult Poverty line: up to two lines, numbers or variables Urban-rural indicator Optional variables: Regions Weights Land-ownership Income Relation to the head Age Gender Education Employment Status More could be added 8
9 ADePT Poverty: Checks and filters All variables are checked: Correct type of variables Correct values (e.g., gender has only 2 values). Presence of a variable in all data files. Variable consistency over the years of data All the constructed variables are generated automatically: household size, shares of different age/gender groups, etc. The program produces a report with basic statistics on all variables and a list of errors, warnings and notes about the variables used in the analysis Control for influential outliers in terms of values or observations. 9
10 ADePT Poverty: Tables and Graphs Report on variables in every dataset Report on possible errors in variables, inconsistencies between the datasets, other warnings and notes Overall Poverty, Expenditure Inequality Decompositions of poverty changes Poverty profiles by socio-demographic categories Consumption regressions Poverty simulations Sensitivity analysis 10
11 ADePT Poverty: Save time and money Time Saving (tabulations only, no data cleaning) Qualified consultant will spend on average 2 weeks (10 days) to construct all the tables produced by ADePT. The typical PA would require 5-6 runs on these tables. Total time saving is about 8 weeks or 40 days to do the work that ADePT could finish in several hours (on a good day) Conservative estimates of the Cost Saving from using ADePT: $12,000 per PA or $180,000 for 15 PA a year (average over the last 8 years). 11

12 Table 2.1 Original Table 2.1 with Standard Errors Table 2.1 Frequencies
13 ADePT Poverty: Testimonials (Romania) We sent the available variables needed to use the program, and the results were sent to us via within 10 minutes. Tables and graphs are extremely useful and provide a wide range of cuts on the data. Is there any chance to share the application with us? The outputs save a lot of time and some of them are really impressive 13
14 ADePT Poverty : Testimonials (Russia) I write to express our appreciation and thanks for this superb tool that you've developed. We have been working this past week at the ROSSTAT premises in Moscow on updating the earlier Russia PA analysis with HBS data, and, thanks to the prototype, have been able to make very good progress with the work in a very short amount of time. Note: We were informed that this analysis took almost an hour to complete as the dataset contained more than 1,000,000 observations. 14
15 ADePT Poverty: Testimonials Ukraine and Montenegro Ukraine: Thank you so much for sending me the Ukraine Poverty profile. This was very helpful. In fact, it was just-in-time delivery, since I am rewriting the Poverty Update for a final review meeting. Montenegro: Thanks a lot for running ADePT on Montenegrin data. It's a great (and super-fast :-)) tool for any preliminary assessment of the poverty situation in any country, and it frees a lot of time for the researcher. 15
16 ADePT Labor Automated analysis of the Labor Market conditions in the low- and middle-income countries Developed jointly with PREMPR and with inputs from HDNSP Based on Guide for Assessing Labor Market Conditions in Developing Countries" by PREMPR, HDNSP, and HDNED Generates about 40 tables with indicators for assessing the static and dynamic labor market conditions. 16

17
18 ADePT Labor Can be used with LSMS, LFS, or any individual-level dataset Extensive set of data controls and filters Testing stage in PREMPR Nicaragua, Rwanda, Madagascar, Brazil 18
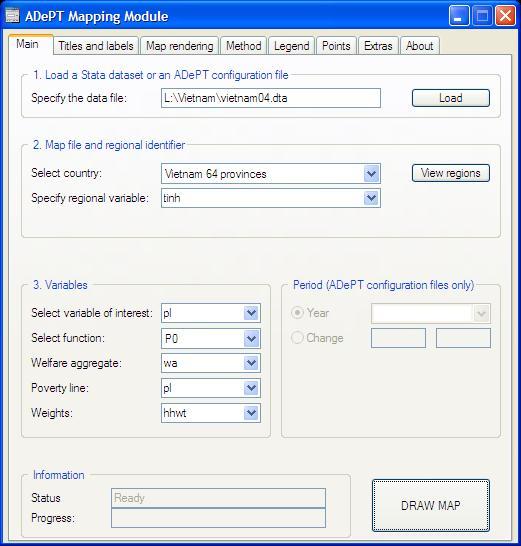
19 ADePT MAPS Output any economic indicator on a geographical country maps by combining GIS files of geographic information with the userprovided datasets Maps could be produced using any microlevel dataset LSMS, DHS, LFS Simple, three-step setup. Produces printready, high quality maps. Ability to build maps interactively India, Bangladesh, Afghanistan, Ukraine, Russia, Georgia 19
20
21 21 ADePT MAPS ADePT MAPS Adilabad Agra Ahmadaba Ahmadnag Aizawl Ajmer Akola Alappuzha Aligarh Allahabad Almora Alwar Ambala GIS GIS Data Data GIS_Regions DATA_regions Legend [0.00,0.06] (0.06,0.11] (0.11,0.15] (0.15,0.17] (0.17,0.22] (0.22,0.27] (0.27,0.35] (0.35,0.46] (0.46,0.74] 200 km Vietnam Labor EDU Health Gender Poverty
22 ADePT: The roadmap ADePT Poverty: Public Release June 2007 ADePT MAPS: Public Release October 2007 Public Release November 2007 ADePT Labor: ADePT Gender: ADePT EDU: Public Release February 2008 Development stage ADePT HEALTH: Development stage ADePT PLINES: Development stage Set of tools to simplify the construction of consumption aggregates. 22
Measuring Poverty. Introduction
 Measuring Poverty Introduction To measure something, we need to provide answers to the following basic questions: 1. What are we going to measure? Poverty? So, what is poverty? 2. Who wants to measure
Geospatial Technologies for Resources Planning & Management
 Geospatial Technologies for Resources Planning & Management Lal Samarakoon, PhD Director, Geoinformatics Center Asian Institute of Technology, Thailand Content Geoinformatics for SDG Information Integration
Poverty statistics in Mongolia
 HIGH-LEVEL SEMINAR ON HARMONISATION OF POVERTY STATISTICS IN CIS COUNTRIES SOCHI (RUSSIAN FEDERATION) Poverty statistics in Mongolia Oyunchimeg Dandar Director Population and Social Statistics Department,
Using American Factfinder
 Using American Factfinder What is American Factfinder? American Factfinder is a search engine that provides access to the population, housing and economic data collected by the U.S. Census Bureau. It can
Socio-Economic Atlas of Tajikistan. The World Bank THE STATE STATISTICAL COMMITTEE OF THE REPUBLIC OF TAJIKISTAN
 Socio-Economic Atlas of Tajikistan The World Bank THE STATE STATISTICAL COMMITTEE OF THE REPUBLIC OF TAJIKISTAN 1) Background Why there is a need for socio economic atlas? Need for a better understanding
Chapter 9: Looking Beyond Poverty: The Development Continuum
 Chapter 9: Looking Beyond Poverty: The Development Continuum Using measures such as Gross Domestic Product (GDP), Gross National Income (GNI), and more recently the Human Development Index (HDI), various
Understanding China Census Data with GIS By Shuming Bao and Susan Haynie China Data Center, University of Michigan
 Understanding China Census Data with GIS By Shuming Bao and Susan Haynie China Data Center, University of Michigan The Census data for China provides comprehensive demographic and business information
An Internet-Based Integrated Resource Management System (IRMS)
") An Internet-Based Integrated Resource Management System (IRMS) Third Quarter Report, Year II 4/1/2000 6/30/2000 Prepared for Missouri Department of Natural Resources Missouri Department of Conservation
An Internet-Based Integrated Resource Management System (IRMS) Third Quarter Report, Year II 4/1/2000 6/30/2000 Prepared for Missouri Department of Natural Resources Missouri Department of Conservation
Apéndice 1: Figuras y Tablas del Marco Teórico
 Apéndice 1: Figuras y Tablas del Marco Teórico FIGURA A.1.1 Manufacture poles and manufacture regions Poles: Share of employment in manufacture at least 12% and population of 250,000 or more. Regions:
Supplementary Appendix for. Version: February 3, 2014
 Supplementary Appendix for When Do Governments Resort to Election Violence? Version: February 3, 2014 This appendix provides supplementary information not included in the published draft. Supplementary
Impact Evaluation of Rural Road Projects. Dominique van de Walle World Bank
 Impact Evaluation of Rural Road Projects Dominique van de Walle World Bank Introduction General consensus that roads are good for development & living standards A sizeable share of development aid and
ReCAP Status Review of the Updated Rural Access Index (RAI) Stephen Vincent, Principal Investigator
 Stephen Vincent, Principal Investigator") ReCAP Status Review of the Updated Rural Access Index (RAI) Stephen Vincent, Principal Investigator Establishment of RAI in 2005/2006 2006 Definition of the RAI Note by Peter Roberts Dated September 2005
ReCAP Status Review of the Updated Rural Access Index (RAI) Stephen Vincent, Principal Investigator Establishment of RAI in 2005/2006 2006 Definition of the RAI Note by Peter Roberts Dated September 2005
Finding Poverty in Satellite Images
 Finding Poverty in Satellite Images Neal Jean Stanford University Department of Electrical Engineering nealjean@stanford.edu Rachel Luo Stanford University Department of Electrical Engineering rsluo@stanford.edu
Data Requirements in Multidimensional Poverty Measurement
 Data Requirements in Multidimensional Poverty Measurement Oxford Poverty & Human Development Initiative (OPHI) University of Oxford Rabat, 4 June 2014 Limits of the current global MPI surveys: DHS, MICS
Agro Ecological Malaria Linkages in Uganda, A Spatial Probit Model:
 Agro Ecological Malaria Linkages in Uganda, A Spatial Probit Model: IFPRI Project Title: Environmental management options and delivery mechanisms to reduce malaria transmission in Uganda Spatial Probit
Overview of Technical Advisory Missions
 Expert Group Meeting (EGM) on Georeferenced Information Systems for Disaster Risk Management (Geo-DRM) and sustaining the Community of Practice (COP) 23-25 April 2014 Bangkok Overview of Technical Advisory
Module 1b: Inequalities and inequities in health and health care utilization
 Module 1b: Inequalities and inequities in health and health care utilization Decomposition, standardization, and inequity This presentation was prepared by Adam Wagstaff and Caryn Bredenkamp 1 The basic
Census Transportation Planning Products (CTPP)
") Census Transportation Planning Products (CTPP) Penelope Weinberger CTPP Program Manager - AASHTO September 15, 2010 1 What is the CTPP Program Today? The CTPP is an umbrella program of data products, custom
Census Transportation Planning Products (CTPP) Penelope Weinberger CTPP Program Manager - AASHTO September 15, 2010 1 What is the CTPP Program Today? The CTPP is an umbrella program of data products, custom
Publication Date: 15 Jan 2015 Effective Date: 12 Jan 2015 Addendum 6 to the CRI Technical Report (Version: 2014, Update 1)
") Publication Date: 15 Jan 2015 Effective Date: 12 Jan 2015 This document updates the Technical Report (Version: 2014, Update 1) and details (1) Replacement of interest rates, (2) CRI coverage expansion,
Publication Date: 15 Jan 2015 Effective Date: 12 Jan 2015 This document updates the Technical Report (Version: 2014, Update 1) and details (1) Replacement of interest rates, (2) CRI coverage expansion,
Demographic Data in ArcGIS. Harry J. Moore IV
 Demographic Data in ArcGIS Harry J. Moore IV Outline What is demographic data? Esri Demographic data - Real world examples with GIS - Redistricting - Emergency Preparedness - Economic Development Next
An Introduction to China and US Map Library. Shuming Bao Spatial Data Center & China Data Center University of Michigan
 An Introduction to China and US Map Library Shuming Bao Spatial Data Center & China Data Center University of Michigan Current Spatial Data Services http://chinadataonline.org China Geo-Explorer http://chinageoexplorer.org
International Student Enrollment Fall 2018 By CIP Code, Country of Citizenship, and Education Level Harpur College of Arts and Sciences
 International Student Enrollment Fall 2018 By CIP Code, Country of Citizenship, and Education Level Harpur College of Arts and Sciences CIP Code Description Citizenship Graduate Undergrad Total 00.0000
AUTOMATED METERED WATER CONSUMPTION ANALYSIS
 AUTOMATED METERED WATER CONSUMPTION ANALYSIS Shane Zhong 1, Nick Turich 1, Patrick Hayde 1 1. Treatment and Network Planning, SA Water, Adelaide, SA, Australia ABSTRACT Water utilities collect and store
Market access and rural poverty in Tanzania
 Market access and rural poverty in Tanzania Nicholas Minot International Food Policy Research Institute 2033 K St. NW Washington, D.C., U.S.A. Phone: +1 202 862-8199 Email: n.minot@cgiar.org Contributed
Globally Estimating the Population Characteristics of Small Geographic Areas. Tom Fitzwater
 Globally Estimating the Population Characteristics of Small Geographic Areas Tom Fitzwater U.S. Census Bureau Population Division What we know 2 Where do people live? Difficult to measure and quantify.
Introduction to time-use surveys
 Regional seminar on time-use surveys Introduction to time-use surveys Kingstown, Saint Vincent and the Grenadines 10-11 December 2014 Iliana Vaca Lucía Scuro Division of Gender Affairs WHAT IS TIME? Measured
Final report for the Expert Group on the Integration of Statistical and Geospatial Information, May 2015
 Final report for the Expert Group on the Integration of Statistical and Geospatial Information, May 2015 Global geographic classification and geocoding practices Executive summary This final report was
Statistics Division 3 November EXPERT GROUP MEETING on METHODS FOR CONDUCTING TIME-USE SURVEYS
 UNITED NATIONS SECRETARIAT ESA/STAT/AC.79/23 Statistics Division 3 November 2000 English only EXPERT GROUP MEETING on METHODS FOR CONDUCTING TIME-USE SURVEYS Report of the meeting held in New York, 23-27
GIS as a tool for rural livelihoods enhancement planning
 GIS as a tool for rural livelihoods enhancement planning (Case study of Alosylat region -Shareg Alnil-Sudan) Almojtaba M. H. Hassabo Federal Ministry of Agriculture Sudan A research submitted to the Development
Taking into account sampling design in DAD. Population SAMPLING DESIGN AND DAD
 Taking into account sampling design in DAD SAMPLING DESIGN AND DAD With version 4.2 and higher of DAD, the Sampling Design (SD) of the database can be specified in order to calculate the correct asymptotic
ESCAP Promotes Geo-referenced Information System for Disaster Risk Management in Asia and the Pacific
 Third High Level Forum on UNGGIM 22-24 October 2014 Beijing, China ESCAP Promotes Geo-referenced Information System for Disaster Risk Management in Asia and the Pacific Keran Wang Space Applications Section,
Asia. JigsawGeo. Free Printable Maps for Geography Education. Try our geography games for the ipod Touch or iphone.
 Free Printable Maps for Geography Education Map with region names shown Map without names, for coloring or quizzes Map with coordinate system, for location practice Answer key for coordinate system quiz
User Guide. Affirmatively Furthering Fair Housing Data and Mapping Tool. U.S. Department of Housing and Urban Development
 User Guide Affirmatively Furthering Fair Housing Data and Mapping Tool U.S. Department of Housing and Urban Development December, 2015 1 Table of Contents 1. Getting Started... 5 1.1 Software Version...
European Regional and Urban Statistics
 European Regional and Urban Statistics Dr. Berthold Feldmann berthold.feldmann@ec.europa.eu Eurostat Structure of the talk Regional statistics in the EU The tasks of Eurostat Regional statistics Urban
Temperature and Income: Online Appendices
 Temperature and Income: Online Appendices Melissa Dell Massachusetts Institute of Technology Benjamin F. Jones Northwestern University and NBER Benjamin A. Olken Massachusetts Institute of Technology and
Medical GIS: New Uses of Mapping Technology in Public Health. Peter Hayward, PhD Department of Geography SUNY College at Oneonta
 Medical GIS: New Uses of Mapping Technology in Public Health Peter Hayward, PhD Department of Geography SUNY College at Oneonta Invited research seminar presentation at Bassett Healthcare. Cooperstown,
Government Size and Economic Growth: A new Framework and Some Evidence from Cross-Section and Time-Series Data
 1 Government Size and Economic Growth: A new Framework and Some Evidence from Cross-Section and Time-Series Data Original Paper by Rati Ram (1986) Replication and Extension by Nicolas Lopez ECON 5341 The
The Church Demographic Specialists
 The Church Demographic Specialists Easy-to-Use Features Map-driven, Web-based Software An Integrated Suite of Information and Query Tools Providing An Insightful Window into the Communities You Serve Key
There is great variation in urban-rural. poverty. differentials globally, but, at a national scale, urban dwellers are generally better off.
 Integration of Poverty and Remote Sensing Data Alex de Sherbinin Socioeconomic Data and Applications Center (SEDAC) CIESIN, The Earth Institute at Columbia University Expert Group Meeting on Slum Identification
The determinants of transport modal choice in Bodensee-Alpenrhein region
 The determinants of transport modal choice in Bodensee-Alpenrhein region Seyedeh Ashrafi University of Vienna Energie Innovation, February 2018 Modal choice is a decision process to choose between different
Development and Implementation of the Haiti and Dominican Republic Flash Flood Guidance (HDRFFG) System. Introduction to the Global FFG System
 System. Introduction to the Global FFG System") Development and Implementation of the Haiti and Dominican Republic Flash Flood Guidance (HDRFFG) System Introduction to the Global FFG System 1 Definition of the Problem Flash Flood is: a flood of short
Development and Implementation of the Haiti and Dominican Republic Flash Flood Guidance (HDRFFG) System Introduction to the Global FFG System 1 Definition of the Problem Flash Flood is: a flood of short
Data Collection. Lecture Notes in Transportation Systems Engineering. Prof. Tom V. Mathew. 1 Overview 1
 Data Collection Lecture Notes in Transportation Systems Engineering Prof. Tom V. Mathew Contents 1 Overview 1 2 Survey design 2 2.1 Information needed................................. 2 2.2 Study area.....................................
Overview of the global FFGS
 Overview of the global FFGS 1 Definition of the Problem While there are several types of floods, flash floods are the most dangerous. Flash Flood is: a flood of short duration with a relatively high peak
Session 2.1: Terminology, Concepts and Definitions
 Second Regional Training Course on Sampling Methods for Producing Core Data Items for Agricultural and Rural Statistics Module 2: Review of Basics of Sampling Methods Session 2.1: Terminology, Concepts
Second Steering Committee Meeting of the Central Asia Region Flash Flood Guidance (CARFFG) System. Overview of the Global FFG System
 System. Overview of the Global FFG System") Second Steering Committee Meeting of the Central Asia Region Flash Flood Guidance (CARFFG) System Overview of the Global FFG System 1 Impacts of Hydro-meteorological Hazards Total number of reported hydro-meteorological
Second Steering Committee Meeting of the Central Asia Region Flash Flood Guidance (CARFFG) System Overview of the Global FFG System 1 Impacts of Hydro-meteorological Hazards Total number of reported hydro-meteorological
APPLICATION OF THE COUNTRY PRODUCT DUMMY METHOD TO CONSTRUCT SPATIAL AND TEMPORAL PRICE INDICES FOR SRI LANKA
 APPLICATION OF THE COUNTRY PRODUCT DUMMY METHOD TO CONSTRUCT SPATIAL AND TEMPORAL PRICE INDICES FOR SRI LANKA Sri Lanka Journal of Economic Research Volume 2 (1) June 2014: 38-52 Sri Lanka Forum of University
NEW CONCEPTS - SOIL SURVEY OF THE FUTURE
 NEW CONCEPTS - SOIL SURVEY OF THE FUTURE The new process of doing soil surveys by Major Land Resource Areas (MLRA) highlights this section. Special emphasis is given to an overview of the National Soil
Population Research Center (PRC) Oregon Population Forecast Program
 Oregon Population Forecast Program") Population Research Center (PRC) Oregon Population Forecast Program 2013 Oregon League of Cities Conference Risa S. Proehl Jason R. Jurjevich, Ph.D. Population Research Center (PRC) Population Research
Population Research Center (PRC) Oregon Population Forecast Program 2013 Oregon League of Cities Conference Risa S. Proehl Jason R. Jurjevich, Ph.D. Population Research Center (PRC) Population Research
MEANING AND MEASURES OF DEVELOPMENT
 MEANING AND MEASURES OF DEVELOPMENT PROFESSOR RODDY FOX RODDY.FOX@HV.SE 1 Outcomes of this Module Demonstrate a reasoned understanding of spatial variations at the global scale of selected development
BRIDGING THE GEOSPATIAL DIGITAL DIVIDE: WORLD BANK-UNGGIM PARTNERSHIP
 BRIDGING THE GEOSPATIAL DIGITAL DIVIDE: WORLD BANK-UNGGIM PARTNERSHIP 5 TH HIGH LEVEL FORUM ON UNITED NATIONS GLOBAL GEOSPATIAL INFORMATION MANAGEMENT Mexico City, Mexico 28-30 November 2017 Kathrine Kelm
Disaster Management & Recovery Framework: The Surveyors Response
 Disaster Management & Recovery Framework: The Surveyors Response Greg Scott Inter-Regional Advisor Global Geospatial Information Management United Nations Statistics Division Department of Economic and
THE FUTURE OF FORECASTING AT METROPOLITAN COUNCIL. CTS Research Conference May 23, 2012
 THE FUTURE OF FORECASTING AT METROPOLITAN COUNCIL CTS Research Conference May 23, 2012 Metropolitan Council forecasts Regional planning agency and MPO for Twin Cities metropolitan area Operates regional
GIS and Demography. John R. Weeks Professor of Geography and Director International Population Center
 GIS and Demography John R. Weeks Professor of Geography and Director International Population Center Introduction to Spatial Pattern Analysis in a GIS Environment Center for Spatially Integrated Social
In matrix algebra notation, a linear model is written as
 DM3 Calculation of health disparity Indices Using Data Mining and the SAS Bridge to ESRI Mussie Tesfamicael, University of Louisville, Louisville, KY Abstract Socioeconomic indices are strongly believed
Natural Resource Management Indicators for the Least Developed Countries
 Natural Resource Management Indicators for the Least Developed Countries Alex de Sherbinin CIESIN, Columbia University 24 June 2005 Millennium Challenge Corporation workshop Brookings Institution Washington,
Multi-dimensional Human Development Measures : Trade-offs and Inequality
 Multi-dimensional Human Development Measures : Trade-offs and Inequality presented by Jaya Krishnakumar University of Geneva UNDP Workshop on Measuring Human Development June 14, 2013 GIZ, Eschborn, Frankfurt
Trip Generation Model Development for Albany
 Trip Generation Model Development for Albany Hui (Clare) Yu Department for Planning and Infrastructure Email: hui.yu@dpi.wa.gov.au and Peter Lawrence Department for Planning and Infrastructure Email: lawrence.peter@dpi.wa.gov.au
8 th Meeting of IAEG-SDGs 5 8 November 2018, Stockholm, Sweden. Meetings. Report
 Meetings 8 th Meeting of IAEG-SDGs Between April 2018 and November 2018, the Working Group on Geospatial Information of the IAEG- SDGs held two online meetings; presented a report to the United Nations
Spatial Organization of Data and Data Extraction from Maptitude
 Spatial Organization of Data and Data Extraction from Maptitude N. P. Taliceo Geospatial Information Sciences The University of Texas at Dallas UT Dallas GIS Workshop Richardson, TX March 30 31, 2018 1/
Neighborhood social characteristics and chronic disease outcomes: does the geographic scale of neighborhood matter? Malia Jones
 Neighborhood social characteristics and chronic disease outcomes: does the geographic scale of neighborhood matter? Malia Jones Prepared for consideration for PAA 2013 Short Abstract Empirical research
GINA Children. II Global Index for humanitarian Needs Assessment (GINA 2004) Sheet N V V VI VIII IX X XI XII XII HDR2003 HDR 2003 UNDP
 Sheet N V V VI VIII IX X XI XII XII HDR2003 HDR 2003 UNDP") Human UNICEF Index Index Natural 2003 GDP per Total as % of Total Rate HDI HPI Disasters Conflicts capita Population population 5 1 Congo, Democratic Republic of the 2,80000 3 3 1 3 3 3 3 3 3 3 2 Burundi
Human UNICEF Index Index Natural 2003 GDP per Total as % of Total Rate HDI HPI Disasters Conflicts capita Population population 5 1 Congo, Democratic Republic of the 2,80000 3 3 1 3 3 3 3 3 3 3 2 Burundi
Speakers: Jeff Price, Federal Transit Administration Linda Young, Center for Neighborhood Technology Sofia Becker, Center for Neighborhood Technology
 Speakers: Jeff Price, Federal Transit Administration Linda Young, Center for Neighborhood Technology Sofia Becker, Center for Neighborhood Technology Peter Haas, Center for Neighborhood Technology Craig
AFFH-T User Guide September 2017 AFFH-T User Guide U.S. Department of Housing and Urban Development
 AFFH-T User Guide Affirmatively Furthering Fair Housing Data and Mapping Tool v. 4.1 U.S. Department of Housing and Urban Development September 2017 Version 4.1 ❿ September 2017 Page 1 Document History
Unit Two: Development & Globalization
 Unit Objectives Unit Two: Development & Globalization Students gain an understanding of the definitions of and differences in less economically developed countries and more economically developed countries
Controls on Exports of Green List Waste to non-oecd Countries an Update.
 Controls on Exports of Green List Waste to non-oecd Countries an Update. The current regulation (1418/2007/EC) providing control measures for the export of green list waste came into force on 29 November
emerge Network: CERC Survey Survey Sampling Data Preparation
 emerge Network: CERC Survey Survey Sampling Data Preparation Overview The entire patient population does not use inpatient and outpatient clinic services at the same rate, nor are racial and ethnic subpopulations
RELEASE OF THE GLOBAL MAP DATA SET VERSION 1.
 RELEASE OF THE GLOBAL MAP DATA SET VERSION 1 K. Nakagawa a, S. Kajikawa a, H.fujimura a, S. Sakabe b a Geographical Survey Institute, 1 Kitasato Tsukuba Ibaraki 305-0811, Japan (k-nakagawa, kajikawa, hfu)@gsi.go.jp
Techniques for Science Teachers: Using GIS in Science Classrooms.
 Techniques for Science Teachers: Using GIS in Science Classrooms. After ESRI, 2008 GIS A Geographic Information System A collection of computer hardware, software, and geographic data used together for
Foundation Geospatial Information to serve National and Global Priorities
 Foundation Geospatial Information to serve National and Global Priorities Greg Scott Inter-Regional Advisor Global Geospatial Information Management United Nations Statistics Division UN-GGIM: A global
CONSTRUCTING THE POVERTY AND OPPORTUNITIES/PUBLIC SERVICES MAPS INFORMATION MANAGEMENT. Background: Brazil Without Extreme Poverty Plan
 INFORMATION MANAGEMENT CONSTRUCTING THE POVERTY AND OPPORTUNITIES/PUBLIC SERVICES MAPS Background: Brazil Without Extreme Poverty Plan The Brazil Without Extreme Poverty Plan (BSM), designed to overcome
Migration Modelling using Global Population Projections
 Migration Modelling using Global Population Projections Bryan Jones CUNY Institute for Demographic Research Workshop on Data and Methods for Modelling Migration Associated with Climate Change 5 December
Crowdsourcing approach for large scale mapping of built-up land
 Crowdsourcing approach for large scale mapping of built-up land Kavinda Gunasekara Kavinda@ait.asia Geoinformatics Center Asian Institute of Technology, Thailand. Regional expert workshop on land accounting
University of Oklahoma, Norman Campus International Student Report Fall 2014
 International Student Report Fall 2014 Prepared by Institutional Research & Reporting June 2015 http://www.ou.edu/content/irr/data-center/annual-reports.html International Student Report Notes and Definitions
Frontier and Remote (FAR) Area Codes: A Preliminary View of Upcoming Changes John Cromartie Economic Research Service, USDA
 Area Codes: A Preliminary View of Upcoming Changes John Cromartie Economic Research Service, USDA") National Center for Frontier Communities webinar, January 27, 2015 Frontier and Remote (FAR) Area Codes: A Preliminary View of Upcoming Changes John Cromartie Economic Research Service, USDA The views
National Center for Frontier Communities webinar, January 27, 2015 Frontier and Remote (FAR) Area Codes: A Preliminary View of Upcoming Changes John Cromartie Economic Research Service, USDA The views
How GIS can be used for improvement of literacy and CE programmes
 How GIS can be used for improvement of literacy and CE programmes Training Workshop for Myanmar Literacy Resource Center (MLRC) ( Yangon, Myanmar, 11 20 October 2000 ) Presented by U THEIN HTUT GEOCOMP
Using the Budget Features in Quicken 2008
 Using the Budget Features in Quicken 2008 Quicken budgets can be used to summarize expected income and expenses for planning purposes. The budget can later be used in comparisons to actual income and expenses
Country of Citizenship, College-Wide - All Students, Fall 2014
 Country of Citizenship, College-Wide - All Students, Fall 2014-49,552 (72%) students were U.S. Citizens in Fall 2014. - MDC's non-citizen students come from at least 167 countries and speak approximately
Study Guide Unit 6 Economics and Development
 Name Period Study Guide Unit 6 Economics and Development When you are asked to sketch maps, please put a key so that you can remember what the colors mean! Chapter 9: Development How does the author introduce
Spatial Disparities in the Distribution of Parks and Green Spaces in the United States
 March 11 th, 2012 Active Living Research Conference Spatial Disparities in the Distribution of Parks and Green Spaces in the United States Ming Wen, Ph.D., University of Utah Xingyou Zhang, Ph.D., CDC
How is Your Health? Using SAS Macros, ODS Graphics, and GIS Mapping to Monitor Neighborhood and Small-Area Health Outcomes
 Paper 3214-2015 How is Your Health? Using SAS Macros, ODS Graphics, and GIS Mapping to Monitor Neighborhood and Small-Area Health Outcomes Roshni Shah, Santa Clara County Public Health Department ABSTRACT
MIGRATION BETWEEN EASTERN PARTNERS (BELARUS, GEORGIA, UKRAINE, MOLDOVA) AND THE VISEGRAD COUNTRIES
 AND THE VISEGRAD COUNTRIES") MIGRATION BETWEEN EASTERN PARTNERS (BELARUS, GEORGIA, UKRAINE, MOLDOVA) AND THE VISEGRAD COUNTRIES E.A. ANTIPOVA DOCTOR OF GEOGRAPHICAL SCIENCES, FULL PROFESSOR antipovaekaterina@gmail.com L. V. FAKEYEVA
MIGRATION BETWEEN EASTERN PARTNERS (BELARUS, GEORGIA, UKRAINE, MOLDOVA) AND THE VISEGRAD COUNTRIES E.A. ANTIPOVA DOCTOR OF GEOGRAPHICAL SCIENCES, FULL PROFESSOR antipovaekaterina@gmail.com L. V. FAKEYEVA
Secondary Towns and Poverty Reduction: Refocusing the Urbanization Agenda
 Secondary Towns and Poverty Reduction: Refocusing the Urbanization Agenda Luc Christiaensen and Ravi Kanbur World Bank Cornell Conference Washington, DC 18 19May, 2016 losure Authorized Public Disclosure
BROOKINGS May
 Appendix 1. Technical Methodology This study combines detailed data on transit systems, demographics, and employment to determine the accessibility of jobs via transit within and across the country s 100
BUILDING SOUND AND COMPARABLE METRICS FOR SDGS: THE CONTRIBUTION OF THE OECD DATA AND TOOLS FOR CITIES AND REGIONS
 BUILDING SOUND AND COMPARABLE METRICS FOR SDGS: THE CONTRIBUTION OF THE OECD DATA AND TOOLS FOR CITIES AND REGIONS STATISTICAL CAPACITY BUILDING FOR MONITORING OF SUSTAINABLE DEVELOPMENT GOALS Lukas Kleine-Rueschkamp
Working with Census Operations Case Study from KSA
 Working with Census Operations Case Study from KSA International Workshop on Integrating Geospatial and Statistical Information Beijing 9 12 June 2014 Abdullah M.Alhamlan Kingdom of Saudi Arabia Central
The TransPacific agreement A good thing for VietNam?
 The TransPacific agreement A good thing for VietNam? Jean Louis Brillet, France For presentation at the LINK 2014 Conference New York, 22nd 24th October, 2014 Advertisement!!! The model uses EViews The
Application of Indirect Race/ Ethnicity Data in Quality Metric Analyses
 Background The fifteen wholly-owned health plans under WellPoint, Inc. (WellPoint) historically did not collect data in regard to the race/ethnicity of it members. In order to overcome this lack of data
Mapping the Future: Energizing Datadriven
 Mapping the Future: Energizing Datadriven Policy Making and Investment in Renewable Energy Anthony Lopez Manager Geospatial Data Science National Renewable Energy Laboratory June 6, 2016 Outline Context
THE GLOBAL INDICATOR FRAMEWORK: NEW AND INNOVATIVE METHODS FOR DISAGGREGATIN BY GEOLOCATION
 Parallel Session: Measuring and Monitoring the SDGs: THE GLOBAL INDICATOR FRAMEWORK: NEW AND INNOVATIVE METHODS FOR DISAGGREGATIN BY GEOLOCATION from global to regional to national panorama 8 th Meeting
emerge Network: CERC Survey Survey Sampling Data Preparation
 emerge Network: CERC Survey Survey Sampling Data Preparation Overview The entire patient population does not use inpatient and outpatient clinic services at the same rate, nor are racial and ethnic subpopulations
2016 New Ward Boundaries Guidance on calculating statistics for the new 2016 wards
 2016 New Ward Boundaries Page 1 Performance, Information and Intelligence 2016 New Ward Boundaries Guidance on calculating statistics for the new 2016 wards Briefing Note Version 2 - March 2016 2016 New
National assessment on member s readiness to produce indicators
 Inter-Agency and Expert Group on the Sustainable Development Goal Indicators WORKING GROUP ON GEOSPATIAL INFORMATION Fifth expert meeting 5 and 8 December 2018 8 th Meeting of IAEG-SDGs 5 8 November 2018,
THE DATA REVOLUTION HAS BEGUN On the front lines with geospatial data and tools
 THE DATA REVOLUTION HAS BEGUN On the front lines with geospatial data and tools Slidedoc of presentation for MEASURE Evaluation End of Project Meeting Washington DC May 22, 2014 John Spencer Geospatial
Structural Change, Demographic Transition and Fertility Di erence
 Structural Change, Demographic Transition and Fertility Di erence T. Terry Cheung February 14, 2017 T. Terry Cheung () Structural Change and Fertility February 14, 2017 1 / 35 Question Question: The force
Geography for Life. Course Overview
 Geography for Life Description In Geography for Life students will explore the world around them. Using the six essential elements established by the National Geographic Society students will be able to
Qatar Statistical Geospatial Integration
 Qatar Statistical Geospatial Integration A Presentation by the Ministry of Development Planning & Statistics (MDPS), State of Qatar http://www.mdps.gov.qa (Fourth UN-GGIM Arab States Committee Meeting,
USING MAPS TO SUPPORT TOBACCO EVALUATION: An Overview of ArcGIS and Tableau
 USING MAPS TO SUPPORT TOBACCO EVALUATION: An Overview of ArcGIS and Tableau Lindsay Kephart, MPH MA Tobacco Cessation and Prevention Program (MTCP) Massachusetts Department of Public Health Overview GIS
 Table 1. Answers to income and consumption adequacy questions Percentage of responses: less than adequate more than adequate adequate Total income 68.7% 30.6% 0.7% Food consumption 46.6% 51.4% 2.0% Clothing
About the Authors Geography and Tourism: The Attraction of Place p. 1 The Elements of Geography p. 2 Themes of Geography p. 4 Location: The Where of
 Preface p. ix About the Authors p. xi Geography and Tourism: The Attraction of Place p. 1 The Elements of Geography p. 2 Themes of Geography p. 4 Location: The Where of Geography p. 4 Place and Space:
Maps, Graphs and Metrics: How Local Agencies Put Data to Work. Vivien Deparday Manager of the Community Information and Mapping System June 20, 2012
 Maps, Graphs and Metrics: How Local Agencies Put Data to Work Vivien Deparday Manager of the Community Information and Mapping System June 20, 2012 Social Planning Council of Ottawa Small non-profit organization