How is Your Health? Using SAS Macros, ODS Graphics, and GIS Mapping to Monitor Neighborhood and Small-Area Health Outcomes
|
|
|
- Jason Welch
- 5 years ago
- Views:
Transcription
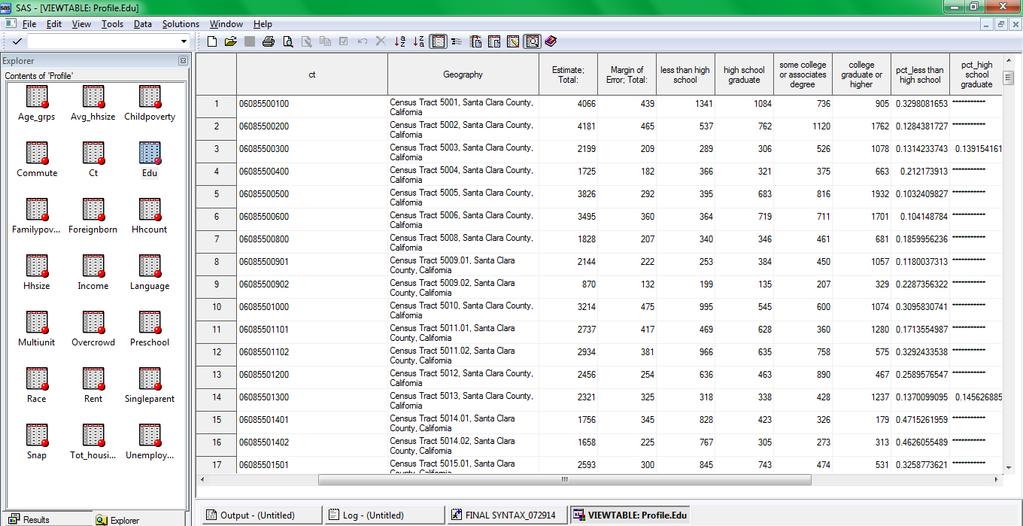
1 Paper How is Your Health? Using SAS Macros, ODS Graphics, and GIS Mapping to Monitor Neighborhood and Small-Area Health Outcomes Roshni Shah, Santa Clara County Public Health Department ABSTRACT With the constant need to inform researchers about neighborhood health data, the Santa Clara County Health Department created socio-demographic and health profiles for 109 neighborhoods in the county. Data was pulled from many public and county data sets, compiled, analyzed, and automated using SAS. With over 60 indicators and 109 profiles, an efficient set of macros was used to automate the calculation of percentages, rates, and mean statistics for all of the indicators. Macros were also used to automate individual census tracts into pre-decided neighborhoods to avoid data entry errors. Simple SQL procedures were used to calculate and format percentages within the macros, and output was pushed out using Output Delivery System (ODS) Graphics. This output was exported to Microsoft Excel, which was used to create a sortable database for end users to compare cities and/or neighborhoods. Finally, the automated SAS output was used to map the demographic data using geographic information system (GIS) software at three geographies: city, neighborhood, and census tract. This presentation describes the use of simple macros and SAS procedures to reduce resources and time spent on checking data for quality assurance purposes. It also highlights the simple use of ODS Graphics to export data to an Excel file, which was used to mail merge the data into 109 unique profiles. The presentation is aimed at introductory SAS users at local and state health departments who might be interested in finding an efficient way to run and present health statistics given limited staff and resources. INTRODUCTION The environment where individuals work, live, and play affects their health and well-being, and hence public health agencies are designing various geographically targeted interventions which require data for small geographic areas. As the demand for meaningful data on small area geographies has increased, local health departments and other public health agencies need efficient and simple ways to provide small area data that are easy to access and can be updated on a regular basis. This paper discusses the data automation process for a neighborhood profile tool created to access subcounty data and inform interventions, support program planning and address resources disparities in Santa Clara County, California. Santa Clara County is a diverse community with 15 cities and nearly 2 million residents, and though the county has one of the highest median household incomes in California, many disparities exist in different parts of the county. The Santa Clara County Neighborhood Profiles provide data for 109 neighborhoods countywide. Most neighborhoods are in San Jose, the largest city in the county, with nearly 1 million residents; all other cities have fewer than 10 neighborhoods each. Various criteria were established to define neighborhoods within city boundaries including maintain existing boundaries and names, clustering census tracts to use U.S. Census data, and having a target size of 10,000 to 15,000 residents in each neighborhood. The larger population resulting from combining census tracts better enabled meeting reporting thresholds for various data sources and facilitated reporting on a smaller population than a zip code. A number of new neighborhoods were defined by using spatial features like major roads, and selected generic names that included only the city name and a directional indicator, e.g., Cupertino Eastside. Areas were designated as small areas/neighborhoods in the tool to reflect that some were not based on pre-existing neighborhoods and others contain multiple neighborhoods. This paper will show the process used to create the neighborhood profiles and how these profiles can be used by other organizations seeking to improve access to small area data. ORGANIZING THE DATA The first step in preparing the neighborhood specific profiles is to select indicators of interest and download publicly available data. In this paper, all publicly available data come from the United States 1
2 Census Bureau and the American Community Survey. Data can be downloaded from the American Fact Finder query system, located at Download the indicators of interest for the geographies that you are interested in. For detailed information on how to download publicly available data from the American Fact Finder query system, see Appendix A. Once all of the data of interest are imported into SAS as SAS datasets using the import wizard in Base SAS, the first step is to check the datasets to make sure that the datasets have been read in properly. At this time, numerator and denominator variables are also created for some indicators, such as foreign born status, where data may not have been formatted in Excel in order to automate the calculation of percentages later in the syntax. libname profile 'xyz'; data edu; set profile.edu; run; data foreignborn; set profile.foreignborn; numerator = estimate_total_foreign_born; denominator = estimate_total; run; AUTOMATING THE CALCUATIONS: RUNNING THE MACROS Once the datasets have been checked and the observations match, the next step is to add a variable called neighborhood to each dataset and write a macro to convert the 372 census tracts in Santa Clara County into 109 pre-defined neighborhoods. The Santa Clara County Public Health Department worked with its Planning departments to divide the county into specific neighborhoods. Each neighborhood was given a specific name, and neighborhoods were typically made up of an average of 4 to 5 census tracts. The macro below creates a variable named dat and assign it to a series of variables from the data we imported into SAS. %let dat= edu foreignborn; Next, we will automate assigning each census tract in the datasets to its appropriate neighborhood. There are 372 census tracts in Santa Clara County. Since all of the publicly available data were downloaded at the census tract level, an efficient method of renaming the census tracts for all of the indicators was needed. In the macro below, a new variable called neighborhood has been created and takes every census tract assigned to a specific neighborhood and gives the neighborhood its pre-existing name. At the end of the macro, a PROC CONTENTS is run for each variable included in the previous macro. This allows the programmer to check that there are 372 observations in each dataset and that the neighborhood variable has been properly added to each dataset as well. %macro var (num); %let k=1; %let dat1=%scan (&dat, &k); %do %while("&dat1" NE ""); data &dat1; set &dat1; length neighborhood $60; if ct in ('1' '2' '3') then neighborhood=abc'; if ct in ( 4 '5' '6') then neighborhood='def'; 2
3 proc contents data=&dat1; run; %let k = %eval(&k + 1); %let dat1=%scan(&dat,&k); %end; %mend var; %var; Now that all of the census tracts in the publicly available datasets have been assigned to a neighborhood name in the county, the next step is to check to make sure that the correct number of neighborhoods have been created and that the variable called neighborhood runs properly using basic PROC PRINT and PROC FREQ syntax. proc print; var neighborhood; run; proc freq; tables neighborhood; run; Once the neighborhood variable runs successfully, the next step is to automate the calculation of basic statistics which will be used in the neighborhood profiles. For this paper, we have chosen to demonstrate how percentages can be automated using macros. We first create a new variable called dat2, which defines the selected variables for which percentages will need to be automated and calculated. Note that these are the same variables for which the numerator and denominator variable was created at the very beginning of the syntax. The numerator and denominator variables will later be used in the PROC SQL macro code to automate the calculation of the percentages. %let dat2= foreignborn; Now that the dat2 variable is created, we will work on reading in each dataset and calculating the appropriate statistic. Note that the profiles would like to show the percentage statistic at a neighborhood level, so we must select and group by the neighborhood variable in our PROC SQL code. The PROC SQL code inside of the macro takes each dataset, provides a title for the output using the variable name, calculates the percentage statistic, formats the statistic as a percentage with a percentage sign and groups it by neighborhood to provide us with a percentage of each of the 109 neighborhoods in Santa Clara County. %macro percent (num); %let k=1; %let dat3=%scan (&dat2, &k); %do %while("&dat3" NE ""); title "percentage of &dat3"; proc sql; select neighborhood, (sum(numerator)/sum(denominator)) as percent format percent6. from &dat3 group by neighborhood; quit; %let k = %eval(&k + 1); %let dat3=%scan(&dat2,&k); %end; %mend percent; %percent; 3

4 When this macro is run, the PROC SQL output will be displayed in the output window. The output below is an example of the data for foreign born status. Display 1. Output of Foreign Born Status by Neighborhood using PROC SQL Notice how the default output destination does not convert to Excel easily; therefore we use the ODS Graphics feature to find a more structured way to output the data. In Base SAS, the option to output results using ODS Graphics can be selected by following the steps below: 1. Click Tools at the top of the ribbon 2. Click on Options 3. Click on Preferences 4. When the Preferences window pops up, click on the Results tab 5. Check Use ODS Graphics under Results options and Create HTML if you wish to create an HTML link in your work or any other specific folder Once the ODS Graphics option is checked and selected, rerun the final macro which created the neighborhood specific percentages. The resulting output will look like cleaner and can then be exported into Microsoft Excel in order to compile the data by neighborhood. 4

5 Display 2. Output of Foreign Born Status by Neighborhood using PROC SQL with ODS Graphics Once exported into Microsoft Excel, the data can be compiled into a single sheet in a workbook. It is crucial that data be labeled with clear column headers that are identical to the template of indicators originally created in a Microsoft Word file. See Appendix B for a copy of the template of indicators that was used to merge the data into for each neighborhood in Santa Clara County. Once all of the data have been compiled into a single sheet in an Excel workbook, the data can be mail-merged into Microsoft Word documents using Microsoft s simple guide (see Appendix C). Each file can then be converted into a PDF file and distributed for planning, programmatic and policy use. Visit to view the detailed city and neighborhood profiles produced for all 15 cities and 109 neighborhoods in Santa Clara County. 5

6 Display 3. Sample Screenshot of Final Neighborhood Profile Output GOING BEYOND THE NUMBERS: MAPPING THE DATA Visual statistics tend to be more compelling and interesting to individuals from various disciplines. With the growing interest in online mapping, we integrated our small geography data with the power of mapping tools, such as ArcGIS online, in order to create an interactive thematic atlas tool to help programs, stakeholders and various other healthcare organizations plan future interventions and campaigns. Since data were downloaded at the census tract level and analyzed at both the neighborhood and city level, indicators could be mapped at three different geographies to identify various disparities. ArcGIS online offers a collaborative cloud-based platform to create and share maps and data. The data were analyzed and prepared for webmap creation in Excel. Map shapefiles were created in ArcGIS software for desktop and then tiled into ArcGIS online, where the layers were used to create an online atlas for maps. The atlas included a set of demographic indicators, with pop-ups and the ability to share maps, for three levels of geographies: 15 cities, 109 neighborhoods and 372 census tracts in Santa Clara County. To view the Santa Clara County Thematic Atlas, visit CONCLUSION There is a great need for small area statistics in order to plan appropriate local healthcare interventions. SAS can be a great tool for researchers to efficiently automate the display and calculation of statistics therefore avoiding manual data entry and repeated quality assurance checks. This method can be a good way for health jurisdictions with limited resources to quickly produce reports and profiles and continue their public health outreach and efforts to improve the health status of their jurisdictions. 6
7 ACKNOWLEDGMENTS I would like to thank the team of epidemiologists at the Santa Clara County Public Health Department and the GIS analysts at the Santa Clara County Information Systems Department for their support, hard work and technical skills in the entire process of creating the Santa Clara County Neighborhood Profiles. I would also like to thank my mentor, R. Scott Leslie, for his encouragement, motivation and expertise throughout the SAS Global Forum application, abstract approval, and paper writing and presentation creation process. Finally, I would like to thank the SAS Global Forum 2015 Team for selecting my abstract and acknowledging my hard work by rewarding me with the 2015 Junior Professional Award. CONTACT INFORMATION Your comments and questions are valued and encouraged. Contact the author at: Roshni Shah Santa Clara County Public Health Department Roshni.Shah@phd.sccgov.org SAS and all other SAS Institute Inc. product or service names are registered trademarks or trademarks of SAS Institute Inc. in the USA and other countries. indicates USA registration. Other brand and product names are trademarks of their respective companies. 7


8 APPENDIX A Downloading publicly available data from the American Fact Finder Query System Educational attainment for Santa Clara County is used as an example to show how Census and American Community Survey data can be easily downloaded for various geographies of interest. Using the sidebar, select Geographies. Select Census Tract as your geographic type, followed by California for State, Santa Clara for county and All Census Tract within Santa Clara County, California for your geographic areas. Click Add to your selections. 8

9 Using the options on the left, select Topics and click on Dataset. For the purposes of this project, the 2011 ACS 5-year estimates were used. It is recommended that the most recently available data be used for your planning and project purposes. Search for your indicator of interest using the search tool and download the table. Educational attainment by census tract is table number B Download this table as a CSV file so that it can easily be read into SAS, selecting the option to download the data and annotations in a single file. Once downloaded, four files will be available to you: two CSV files and two text files. Note that the metadata and annotated data are separated into two files, which have to be combined in Excel prior to importing in SAS as a CSV. Once the file is compiled, all additional calculations to collapse categories at the census tract level were done in Excel. Fields were compiled into four major categories: less than high school, high school graduate, some college or associates degree, and college graduate or higher. Percentages were calculated for each of the four categories at the census tract level, and the final CSV file was imported into Base SAS using the import wizard. This process was repeated for all of the variables of interest where Census and/or American Community Survey data for the indicators of interest were available. 9
10 10

11 APPENDIX B Sample Template of Santa Clara County Neighborhood Profile Indicators DEMOGRAPHIC SNAPSHOT PROFILE 2014 CITY SCC Population Size 1,781,642 Race/Ethnicity African American 2% Asian/Pacific Islander 32% Latino 27% White 35% Foreign-born 37% Speaks a language other than English at home Single parent households Households with children 51% 7% 38% Average household size 2.90 Age Groups 0-5 years 8% 6-11 years 8% years 8% years 9% years 15% years 16% years 15% years 10% Ages 65 and older 11% Sources: U.S. Census Bureau, 2010 Census and American Community Survey 5-Year Estimates ECONOMIC AND EDUCATIONAL OPPORTUNITIES Income and job opportunities NAME Median household income $89,064 Unemployed (ages > 16 years) 6% Poverty Families below 185% FPL 16% Children (ages 0-17) below 185% FPL 24% 11 Sources: U.S. Census Bureau, 2010 Census and American Community Survey 5-Year Estimates SCC
12 APPENDIX C Mail-Merging Excel Data into Microsoft Word 2010 In order to merge the data compiled in Microsoft into the final neighborhood profile temple (see Appendix A for portion of the template), a mail-merging process was used. The first step was to use Dynamic Data Exchange (DDE) to connect to our Excel file of data. In order to do this and complete the mail merge process, Microsoft has provided a step-by-tutorial for various versions of Microsoft Word. The detailed tutorial used for our process can be found here: 12
User Guide. Affirmatively Furthering Fair Housing Data and Mapping Tool. U.S. Department of Housing and Urban Development
 User Guide Affirmatively Furthering Fair Housing Data and Mapping Tool U.S. Department of Housing and Urban Development December, 2015 1 Table of Contents 1. Getting Started... 5 1.1 Software Version...
Map your way to deeper insights
 Map your way to deeper insights Target, forecast and plan by geographic region Highlights Apply your data to pre-installed map templates and customize to meet your needs. Select from included map files
The econ Planning Suite: CPD Maps and the Con Plan in IDIS for Consortia Grantees Session 1
 The econ Planning Suite: CPD Maps and the Con Plan in IDIS for Consortia Grantees Session 1 1 Training Objectives Use CPD Maps to analyze, assess, and compare levels of need in your community Use IDIS
Utilizing Data from American FactFinder with TIGER/Line Shapefiles in ArcGIS
 Utilizing Data from American FactFinder with TIGER/Line Shapefiles in ArcGIS Web Adams, GISP Data Dissemination Specialist U.S. Census Bureau New York Regional Office 1 What We Do Decennial Census Every
The Church Demographic Specialists
 The Church Demographic Specialists Easy-to-Use Features Map-driven, Web-based Software An Integrated Suite of Information and Query Tools Providing An Insightful Window into the Communities You Serve Key
2014 Planning Database (PDB)
") 2014 Planning Database (PDB) November 19, 2014 Barbara O Hare, Nancy Bates, Julia Coombs, Travis Pape, Chandra Erdman Office of Survey Analytics 1 Overview Tract and Block Group PDBs Useful for: Identifying
2014 Planning Database (PDB) November 19, 2014 Barbara O Hare, Nancy Bates, Julia Coombs, Travis Pape, Chandra Erdman Office of Survey Analytics 1 Overview Tract and Block Group PDBs Useful for: Identifying
AFFH-T User Guide September 2017 AFFH-T User Guide U.S. Department of Housing and Urban Development
 AFFH-T User Guide Affirmatively Furthering Fair Housing Data and Mapping Tool v. 4.1 U.S. Department of Housing and Urban Development September 2017 Version 4.1 ❿ September 2017 Page 1 Document History
A Street Named for a King
 A Street Named for a King Dr. Jerry Mitchell University of South Carolina OVERVIEW This lesson adapts the work of Dr. Derek Alderman, a geographer who has used the Martin Luther King, Jr. street-naming
Are You Maximizing The Value Of All Your Data?
 Are You Maximizing The Value Of All Your Data? Using The SAS Bridge for ESRI With ArcGIS Business Analyst In A Retail Market Analysis SAS and ESRI: Bringing GIS Mapping and SAS Data Together Presented
Acknowledgments xiii Preface xv. GIS Tutorial 1 Introducing GIS and health applications 1. What is GIS? 2
 Acknowledgments xiii Preface xv GIS Tutorial 1 Introducing GIS and health applications 1 What is GIS? 2 Spatial data 2 Digital map infrastructure 4 Unique capabilities of GIS 5 Installing ArcView and the
Visualization of Commuter Flow Using CTPP Data and GIS
 Visualization of Commuter Flow Using CTPP Data and GIS Research & Analysis Department Southern California Association of Governments 2015 ESRI User Conference l July 23, 2015 l San Diego, CA Jung Seo,
SANTA CLARA COUNTY THEMATIC ATLAS
 1 SANTA CLARA COUNTY THEMATIC ATLAS Project Overview Douglas Schenk, GIS Analyst Sampa Patra, GIS Analyst Making the Thematic Atlas 2 Brought to you by the County of Santa Clara Public Health Department,
Orien Ori t en a t tion a Webi W nar: ebi CPD Maps 2
 Orientation Webinar: CPD Maps 2 Agenda 1. Background - econ Planning Suite 2. Expanded Planning Data 3. CPD Maps Overview 4. Demonstration Guide Me Wizard Map Selection Identify Tool Printing and Saving
Institutional Research with Public Data and Open Source Software
 2017 Institutional Research with Public Data and Open Source Software DUE1304591, 1644409, 1700496 Opinions expressed are those of the authors and not necessarily those of the National Science Foundation.
Visualization of Origin- Destination Commuter Flow Using CTPP Data and ArcGIS
 Visualization of Origin- Destination Commuter Flow Using CTPP Data and ArcGIS Research & Analysis Department Southern California Association of Governments 2015 ESRI User Conference l July 23, 2015 l San
ArcGIS for Desktop. ArcGIS for Desktop is the primary authoring tool for the ArcGIS platform.
 ArcGIS for Desktop ArcGIS for Desktop ArcGIS for Desktop is the primary authoring tool for the ArcGIS platform. Beyond showing your data as points on a map, ArcGIS for Desktop gives you the power to manage
Preparing Spatial Data
 13 CHAPTER 2 Preparing Spatial Data Assessing Your Spatial Data Needs 13 Assessing Your Attribute Data 13 Determining Your Spatial Data Requirements 14 Locating a Source of Spatial Data 14 Performing Common
Geographic Systems and Analysis
 Geographic Systems and Analysis New York University Robert F. Wagner Graduate School of Public Service Instructor Stephanie Rosoff Contact: stephanie.rosoff@nyu.edu Office hours: Mondays by appointment
Introducing the WISERD Geoportal. WISERD DATA TEAM Dr Robert Berry & Dr Richard Fry, University of Glamorgan Dr Scott Orford, Cardiff University
 Introducing the WISERD Geoportal WISERD DATA TEAM Dr Robert Berry & Dr Richard Fry, University of Glamorgan Dr Scott Orford, Cardiff University WISERD What is WISERD? Wales Institute of Social and Economic
An Assessment of People, Place and Business on Syracuse s Near Northside
 An Assessment of People, Place and Business on Syracuse s Near Northside May 2013 Report produced by Jon Glass, Kelly Montague and Mark Pawliw Edited by Jon Glass and Jonnell Robinson Syracuse Community
Working with Census 2000 Data from MassGIS
 Tufts University GIS Tutorial Working with Census 2000 Data from MassGIS Revised September 26, 2007 Overview In this tutorial, you will use pre-processed census data from Massachusetts to create maps of
BROOKINGS May
 Appendix 1. Technical Methodology This study combines detailed data on transit systems, demographics, and employment to determine the accessibility of jobs via transit within and across the country s 100
Spatial Organization of Data and Data Extraction from Maptitude
 Spatial Organization of Data and Data Extraction from Maptitude N. P. Taliceo Geospatial Information Sciences The University of Texas at Dallas UT Dallas GIS Workshop Richardson, TX March 30 31, 2018 1/
Data Structures & Database Queries in GIS
 Data Structures & Database Queries in GIS Objective In this lab we will show you how to use ArcGIS for analysis of digital elevation models (DEM s), in relationship to Rocky Mountain bighorn sheep (Ovis
PALS: Neighborhood Identification, City of Frederick, Maryland. David Boston Razia Choudhry Chris Davis Under the supervision of Chao Liu
 PALS: Neighborhood Identification, City of Frederick, Maryland David Boston Razia Choudhry Chris Davis Under the supervision of Chao Liu University of Maryland School of Architecture, Planning & Preservation
Section 2. Indiana Geographic Information Council: Strategic Plan
 Section 2. Indiana Geographic Information Council: Strategic Plan Introduction A geographic information system (GIS) is an automated tool that allows the collection, modification, storage, analysis, and
Learning ArcGIS: Introduction to ArcCatalog 10.1
 Learning ArcGIS: Introduction to ArcCatalog 10.1 Estimated Time: 1 Hour Information systems help us to manage what we know by making it easier to organize, access, manipulate, and apply knowledge to the
Using American Factfinder
 Using American Factfinder What is American Factfinder? American Factfinder is a search engine that provides access to the population, housing and economic data collected by the U.S. Census Bureau. It can
GIS ADMINISTRATOR / WEB DEVELOPER EVANSVILLE-VANDERBURGH COUNTY AREA PLAN COMMISSION
 GIS ADMINISTRATOR / WEB DEVELOPER EVANSVILLE-VANDERBURGH COUNTY AREA PLAN COMMISSION SALARY RANGE INITIATION $43,277 SIX MONTHS $45,367 POSITION GRADE PAT VI The Evansville-Vanderburgh County Area Plan
Write a report (6-7 pages, double space) on some examples of Internet Applications. You can choose only ONE of the following application areas:
 on some examples of Internet Applications. You can choose only ONE of the following application areas:") UPR 6905 Internet GIS Homework 1 Yong Hong Guo September 9, 2008 Write a report (6-7 pages, double space) on some examples of Internet Applications. You can choose only ONE of the following application
UPR 6905 Internet GIS Homework 1 Yong Hong Guo September 9, 2008 Write a report (6-7 pages, double space) on some examples of Internet Applications. You can choose only ONE of the following application
Demographic characteristics of the School of International Studies 9 th Grade class and their success their first semester.
 Project Tutorial 1. Topic Demographic characteristics of the School of International Studies 9 th Grade class and their success their first semester. 2. Research Question/Problem For the 9 th Grade class
Policy Paper Alabama Primary Care Service Areas
 Aim and Purpose Policy Paper Alabama Primary Care Service Areas Produced by the Office for Family Health Education & Research, UAB School of Medicine To create primary care rational service areas (PCSA)
Exercise on Using Census Data UCSB, July 2006
 Exercise on Using Census Data UCSB, July 2006 Purpose The purpose of this lab is to become familiar with Census Bureau data. Second, we will learn how to join tables which allows you to add data to the
Purpose Study conducted to determine the needs of the health care workforce related to GIS use, incorporation and training.
 GIS and Health Care: Educational Needs Assessment Cindy Gotz, MPH, CHES Janice Frates, Ph.D. Suzanne Wechsler, Ph.D. Departments of Health Care Administration & Geography California State University Long
Environmental Analysis, Chapter 4 Consequences, and Mitigation
 Environmental Analysis, Chapter 4 4.17 Environmental Justice This section summarizes the potential impacts described in Chapter 3, Transportation Impacts and Mitigation, and other sections of Chapter 4,
Empowering Local Health through GIS
 Empowering Local Health through GIS Mapping data from Washington s Immunization Information System (IIS). Presented to IACW October 16 th, 2013 by: Chris Halsell and Isaiah Berg Agenda IIS Overview Why
Teaching GIS for Land Surveying
 Teaching GIS for Land Surveying Zhanjing (John) Yu Evergreen Valley College, San Jose, California James Crossfield California State University at Fresno, Fresno California 7/13/2006 1 Outline of the Presentation
LED Lighting Facts: Manufacturer Guide
 LED Lighting Facts: Manufacturer Guide 2018 1 P a g e L E D L i g h t i n g F a c t s : M a n u f a c t u r e r G u i d e TABLE OF CONTENTS Section 1) Accessing your account and managing your products...
FIRE DEPARMENT SANTA CLARA COUNTY
 DEFINITION FIRE DEPARMENT SANTA CLARA COUNTY GEOGRAPHIC INFORMATION SYSTEM (GIS) ANALYST Under the direction of the Information Technology Officer, the GIS Analyst provides geo-spatial strategic planning,
ArcGIS Pro: Essential Workflows STUDENT EDITION
 ArcGIS Pro: Essential Workflows STUDENT EDITION Copyright 2018 Esri All rights reserved. Course version 6.0. Version release date August 2018. Printed in the United States of America. The information contained
LED Lighting Facts: Product Submission Guide
 LED Lighting Facts: Product Submission Guide NOVEMBER 2017 1 P a g e L E D L i g h t i n g F a c t s : M a n u f a c t u r e r P r o d u c t S u b m i s s i o n G u i d e TABLE OF CONTENTS Section 1) Accessing
Modeling Incident Density with Contours in ArcGIS Pro
 Modeling Incident Density with Contours in ArcGIS Pro By Mike Price, Entrada/San Juan, Inc. What you will need ArcGIS Pro 1.4 license or later ArcGIS Spatial Analyst license ArcGIS Online for organizational
ADDRESSING TITLE VI AND ENVIRONMENTAL JUSTICE IN LONG-RANGE TRANSPORTATION PLANS
 ADDRESSING TITLE VI AND ENVIRONMENTAL JUSTICE IN LONG-RANGE TRANSPORTATION PLANS Activities from the National Capital Region Transportation Planning Board Sergio Ritacco Transportation Planner 2017 Association
Linear Referencing in Boulder County, CO. Getting Started
 Linear Referencing in Boulder County, CO Getting Started 1 Authors Janie Pierre GIS Technician, Boulder County Road centerline and storm sewer geodatabases & maps John Mosher GIS Specialist, Boulder County
Guide to the Data-Driven Planning Toolkit in CPD Maps
 The econ Planning Suite: Guide to the Data-Driven Planning Toolkit in CPD Maps Version: April 2014 TABLE OF CONTENTS Introduction... 1 The Data-Driven Planning Toolkit... 3 Overview of the Basic Model...
Community Inclusion in Colorado
 A Mapping Project for Emergency Preparedness and Response Aimee Voth Siebert, MA Julia Beems, MA Rachel Coles, MA Devon Williford, MPH Adam Anderson, MURP, MPH March 2015 understanding that HUMAN ENERGY
Medical GIS: New Uses of Mapping Technology in Public Health. Peter Hayward, PhD Department of Geography SUNY College at Oneonta
 Medical GIS: New Uses of Mapping Technology in Public Health Peter Hayward, PhD Department of Geography SUNY College at Oneonta Invited research seminar presentation at Bassett Healthcare. Cooperstown,
An online data and consulting resource of THE UNIVERSITY OF TOLEDO THE JACK FORD URBAN AFFAIRS CENTER
 An online data and consulting resource of THE JACK FORD URBAN AFFAIRS CENTER THE CENTER FOR GEOGRAPHIC INFORMATION SCIENCE AND APPLIED GEOGRAPHICS DEPARTMENT OF GEOGRAPHY AND PLANNING THE UNIVERSITY OF
Tutorial using the 2011 Statistics Canada boundary files and the Householder survey
 Tutorial using the 2011 Statistics Canada boundary files and the Householder survey In this tutorial, we ll try to determine the wards that contain the highest income groups. To do this, we will have to
GIS 520 Data Cardinality. Joining Tabular Data to Spatial Data in ArcGIS
 GIS 520 Data Cardinality Joining Tabular Data to Spatial Data in ArcGIS Joining Tabular Data to Spatial Data in ArcGIS Outline Working with Zip Code Data Data Cardinality Issues Exploring Data Format Requirements
Geodatabases and ArcCatalog
 Geodatabases and ArcCatalog Prepared by Francisco Olivera, Ph.D. and Srikanth Koka Department of Civil Engineering Texas A&M University February 2004 Contents Brief Overview of Geodatabases Goals of the
Geospatial Data Sources. SLO GIS User Group June 8, 2010
 Geospatial Data Sources SLO GIS User Group June 8, 2010 Presenters Drew Decker USGS Southern California Geospatial Liaison Kelly Bobbitt Mike Bobbitt & Associates Joe Larson Cal Fire Peter Meertens Regional
Demographic Data in ArcGIS. Harry J. Moore IV
 Demographic Data in ArcGIS Harry J. Moore IV Outline What is demographic data? Esri Demographic data - Real world examples with GIS - Redistricting - Emergency Preparedness - Economic Development Next
GIS Visualization: A Library s Pursuit Towards Creative and Innovative Research
 GIS Visualization: A Library s Pursuit Towards Creative and Innovative Research Justin B. Sorensen J. Willard Marriott Library University of Utah justin.sorensen@utah.edu Abstract As emerging technologies
Esri Defense Mapping: Cartographic Production. Bo King
 Esri Defense Mapping: Cartographic Production Bo King Agenda Esri Defense Mapping: Cartographic Production Solution Overview Desktop Cartographic Production Workflow - Create Rapid Graphic Product On Demand
Crime Analysis. GIS Solutions for Intelligence-Led Policing
 Crime Analysis GIS Solutions for Intelligence-Led Policing Applying GIS Technology to Crime Analysis Know Your Community Analyze Your Crime Use Your Advantage GIS aids crime analysis by Identifying and
Applying Health Outcome Data to Improve Health Equity
 Applying Health Outcome Data to Improve Health Equity Devon Williford, MPH, Health GIS Specialist Lorraine Dixon-Jones, Policy Analyst CDPHE Health Equity and Environmental Justice Collaborative Mile High
Child Opportunity Index Mapping
 Child Opportunity Index Mapping A partnership project of How to Use and Interpret the Child Opportunity Index Maps How to Use the Child Opportunity Index Maps Getting Started: How to Find and Open a Child
Housing Action Illinois Membership Coverage and Recommended New Office Location
 Housing Action Illinois Membership Coverage and Recommended New Office Location Housing Action Illinois GEO 242: GIS II Dr. Hwang March 10, 2011 Alex Bordens Jeffrey Lind Sergio Mendoza Brad Nosan Mercedes
 www.goldensoftware.com Why Create a Thematic Map? A thematic map visually represents the geographic distribution of data. MapViewer will help you to: understand demographics define sales or insurance territories
AUTOMATED METERED WATER CONSUMPTION ANALYSIS
 AUTOMATED METERED WATER CONSUMPTION ANALYSIS Shane Zhong 1, Nick Turich 1, Patrick Hayde 1 1. Treatment and Network Planning, SA Water, Adelaide, SA, Australia ABSTRACT Water utilities collect and store
Big-Geo-Data EHR Infrastructure Development for On-Demand Analytics
 Big-Geo-Data EHR Infrastructure Development for On-Demand Analytics Sohayla Pruitt, MA Senior Geospatial Scientist Duke Medicine DUHS DHTS EIM HIRS Page 1 Institute of Medicine, World Health Organization,
2010 Census Data Release and Current Geographic Programs. Michaellyn Garcia Geographer Seattle Regional Census Center
 2010 Census Data Release and Current Geographic Programs Michaellyn Garcia Geographer Seattle Regional Census Center 2010 Center of Population Located approximately 2.7 miles northeast of Plato, Missouri
Demographic Data. How to get it and how to use it (with caution) By Amber Keller
 By Amber Keller") Demographic Data How to get it and how to use it (with caution) By Amber Keller 101 Where does it come from? o The American Community Survey o Socio-economic characteristics of a population o Administered
Demographic Data How to get it and how to use it (with caution) By Amber Keller 101 Where does it come from? o The American Community Survey o Socio-economic characteristics of a population o Administered
Desktop GIS for Geotechnical Engineering
 Desktop GIS for Geotechnical Engineering Satya Priya Deputy General Manager (Software) RMSI, A-7, Sector 16 NOIDA 201 301, UP, INDIA Tel: +91-120-2511102 Fax: +91-120-2510963 Email: Satya.Priya@rmsi.com
NEW YORK DEPARTMENT OF SANITATION. Spatial Analysis of Complaints
 NEW YORK DEPARTMENT OF SANITATION Spatial Analysis of Complaints Spatial Information Design Lab Columbia University Graduate School of Architecture, Planning and Preservation November 2007 Title New York
Data Matrix User Guide
 Data Matrix User Guide 1. Introduction The 2017 Data Matrix is designed to support the 2017 iteration of the Regional Skills Assessments (RSAs) in Scotland. The RSAs align with the Regional Outcome Agreement
Census Transportation Planning Products (CTPP)
") Census Transportation Planning Products (CTPP) Penelope Weinberger CTPP Program Manager - AASHTO September 15, 2010 1 What is the CTPP Program Today? The CTPP is an umbrella program of data products, custom
Census Transportation Planning Products (CTPP) Penelope Weinberger CTPP Program Manager - AASHTO September 15, 2010 1 What is the CTPP Program Today? The CTPP is an umbrella program of data products, custom
APPENDIX C-3 Equitable Target Areas (ETA) Technical Analysis Methodology
 Technical Analysis Methodology") APPENDIX C-3 Equitable Target Areas (ETA) Technical Analysis Methodology Contents Introduction... 1 ETA Index Methodology... 1 ETA Index Development... 1 Other EJ Measures... 4 The Limited English Proficiency
APPENDIX C-3 Equitable Target Areas (ETA) Technical Analysis Methodology Contents Introduction... 1 ETA Index Methodology... 1 ETA Index Development... 1 Other EJ Measures... 4 The Limited English Proficiency
ON SITE SYSTEMS Chemical Safety Assistant
 ON SITE SYSTEMS Chemical Safety Assistant CS ASSISTANT WEB USERS MANUAL On Site Systems 23 N. Gore Ave. Suite 200 St. Louis, MO 63119 Phone 314-963-9934 Fax 314-963-9281 Table of Contents INTRODUCTION
Basic Training Battlemind to Home Symposium. Sept
 Basic Training Battlemind to Home Symposium Sept 2017 1 What is Measuring Communities? A social indicators project which allows users to obtain military-specific information about communities strengths
Data Aggregation with InfraWorks and ArcGIS for Visualization, Analysis, and Planning
 Data Aggregation with InfraWorks and ArcGIS for Visualization, Analysis, and Planning Stephen Brockwell President, Brockwell IT Consulting, Inc. Join the conversation #AU2017 KEYWORD Class Summary Silos
COMMISSION ON ACCREDITATION 2014 ANNUAL REPORT ONLINE
 COMMISSION ON ACCREDITATION 2014 ANNUAL REPORT ONLINE SUMMARY DATA: POSTDOCTORAL PROGRAMS ^Clicking a table title will automatically direct you to that table in this document *Programs that combine two
ArcGIS 9 ArcGIS StreetMap Tutorial
 ArcGIS 9 ArcGIS StreetMap Tutorial Copyright 2001 2008 ESRI All Rights Reserved. Printed in the United States of America. The information contained in this document is the exclusive property of ESRI. This
Systematic Review Round 7 Application Form
 Systematic Review Round 7 Application Form SR7/1063 1. BASIC PROJECT INFO (i) Title of Proposed Review * Systematic review question.download detailed SR7 questions here Title of the study if more focused
Final Group Project Paper. Where Should I Move: The Big Apple or The Lone Star State
 Final Group Project Paper Where Should I Move: The Big Apple or The Lone Star State By: Nathan Binder, Shannon Scolforo, Kristina Conste, Madison Quinones Main Goal: Determine whether New York or Texas
GIS TECHNICIAN I GIS TECHNICIAN II
 GIS TECHNICIAN I GIS TECHNICIAN II CITY OF ROSEVILLE DEFINITION To perform a variety of technical office and field work duties related to the creation and maintenance of maps, tables, graphs and other
Population Trends Along the Coastal United States:
 Coastal Trends Report Series Population Trends Along the Coastal United States: 1980-2008 U.S. Department of Commerce National Oceanic and Atmospheric Administration National Ocean Service Assessing the
Finding Common Ground Through GIS
 Finding Common Ground Through GIS Matthew Stone, MPH Special Unit for Technical Assistance Chronic Disease and Injury Control California Department of Public Health ESRI Health GIS Conference Scottsdale,
CIRES Web Map Application Design Overview
 CIRES Web Map Application Design Overview Prepared by: Natalie Chan Ho Man, Greenest/ Healthy City Scholar, August 2018 Prepared for: Wes Regan, Social Planner II, Social Policy & Project Division, City
Working with ArcGIS Online
 Esri International User Conference San Diego, CA Technical Workshops July 12, 2011 Working with ArcGIS Online Bern Szukalski, Deane Kensok Topics for this Session ArcGIS Online Overview ArcGIS Online Content
Where to Invest Affordable Housing Dollars in Polk County?: A Spatial Analysis of Opportunity Areas
 Resilient Neighborhoods Technical Reports and White Papers Resilient Neighborhoods Initiative 6-2014 Where to Invest Affordable Housing Dollars in Polk County?: A Spatial Analysis of Opportunity Areas
Module 10 Summative Assessment
 Module 10 Summative Assessment Activity In this activity you will use the three dimensions of vulnerability that you learned about in this module exposure, sensitivity, and adaptive capacity to assess
Hayward, P. (2007). Mexican-American assimilation in U.S. metropolitan areas. The Pennsylvania Geographer, 45(1), 3-15.
. Mexican-American assimilation in U.S. metropolitan areas. The Pennsylvania Geographer, 45(1), 3-15.") PETER HAYWARD Assistant Professor of Geography and GIS Faculty Fellow SUNY College at Oneonta 323 Milne Library Oneonta, NY 13820 Phone: 607-436-3398 Email: haywarpm@oneonta.edu Web: http://employees.oneonta.edu/haywarpm
PETER HAYWARD Assistant Professor of Geography and GIS Faculty Fellow SUNY College at Oneonta 323 Milne Library Oneonta, NY 13820 Phone: 607-436-3398 Email: haywarpm@oneonta.edu Web: http://employees.oneonta.edu/haywarpm
Diamonds on the soles of scholarship?
 Educational Performance and Family Income Diamonds on the soles of scholarship? by Introduction Problem Two young girls entering elementary school in Boston aspire to be doctors. Both come from twoparent,
Oakland County Parks and Recreation GIS Implementation Plan
 Oakland County Parks and Recreation GIS Implementation Plan TABLE OF CONTENTS 1.0 Introduction... 3 1.1 What is GIS? 1.2 Purpose 1.3 Background 2.0 Software... 4 2.1 ArcGIS Desktop 2.2 ArcGIS Explorer
Hennepin GIS. Tree Planting Priority Areas - Analysis Methodology. GIS Services April 2018 GOAL:
 Hennepin GIS GIS Services April 2018 Tree Planting Priority Areas - Analysis Methodology GOAL: To create a GIS data layer that will aid Hennepin County Environment & Energy staff in determining where to
Creating a Staff Development Plan with Esri
 Creating a Staff Development Plan with Esri Michael Green David Schneider Guest Presenter: Shane Feirer, University of California Esri UC 2014 Technical Workshop Agenda What is a Staff Development Plan?
STAR COMMUNITY RATING SYSTEM OBJECTIVE EE-4: EQUITABLE SERVICES & ACCESS COMMUNITY LEVEL OUTCOMES FOR KING COUNTY, WA
 STAR COMMUNITY RATING SYSTEM OBJECTIVE EE-4: EQUITABLE SERVICES & ACCESS COMMUNITY LEVEL OUTCOMES FOR KING COUNTY, WA OUTCOME I: EQUITABLE ACCESS AND PROXIMITY Background: This analysis has been developed
Evaluating Community Analyst for Use in School Demography Studies
 Portland State University PDXScholar Publications, Reports and Presentations Population Research Center 7-2013 Evaluating Community Analyst for Use in School Demography Studies Richard Lycan Portland State
Effective Use of Geographic Maps
 Effective Use of Geographic Maps Purpose This tool provides guidelines and tips on how to effectively use geographic maps to communicate research findings. Format This tool provides guidance on geographic
Globally Estimating the Population Characteristics of Small Geographic Areas. Tom Fitzwater
 Globally Estimating the Population Characteristics of Small Geographic Areas Tom Fitzwater U.S. Census Bureau Population Division What we know 2 Where do people live? Difficult to measure and quantify.
Esri and GIS Education
 Esri and GIS Education Organizations Esri Users 1,200 National Government Agencies 11,500 States & Regional Agencies 30,800 Cities & Local Governments 32,000 Businesses 8,500 Utilities 12,600 NGOs 11,000
DVRPC's 2010 and 2040 Transit Score
 Page 1 of 12 DVRPC's 2010 and 2040 Transit Score Shapefile Tags Transit Score, TAZ Summary To be used for planning purposes. Description This two-phase project defines a method to assess the appropriateness
INTRODUCTION TO ARCGIS Version 10.*
 Week 3 INTRODUCTION TO ARCGIS Version 10.* topics of the week Overview of ArcGIS Using ArcCatalog Overview of ArcGIS Desktop ArcGIS Overview Scalable desktop applications ArcView ArcEditor ArcInfo ArcGIS
ST-Links. SpatialKit. Version 3.0.x. For ArcMap. ArcMap Extension for Directly Connecting to Spatial Databases. ST-Links Corporation.
 ST-Links SpatialKit For ArcMap Version 3.0.x ArcMap Extension for Directly Connecting to Spatial Databases ST-Links Corporation www.st-links.com 2012 Contents Introduction... 3 Installation... 3 Database
94-802Z: Geographic Information Systems Summer 2018
 94-802Z: Geographic Information Systems Summer 2018 Instructor: Professor Kristen Kurland Teaching Assistant(s): (Office hours to be posted on Canvas) TBA Class Web Site: http:/www.cmu.edu/canvas
Geography 281 Map Making with GIS Project Four: Comparing Classification Methods
 Geography 281 Map Making with GIS Project Four: Comparing Classification Methods Thematic maps commonly deal with either of two kinds of data: Qualitative Data showing differences in kind or type (e.g.,
Outline. ArcGIS? ArcMap? I Understanding ArcMap. ArcMap GIS & GWR GEOGRAPHICALLY WEIGHTED REGRESSION. (Brief) Overview of ArcMap
 Overview of ArcMap") GEOGRAPHICALLY WEIGHTED REGRESSION Outline GWR 3.0 Software for GWR (Brief) Overview of ArcMap Displaying GWR results in ArcMap stewart.fotheringham@nuim.ie http://ncg.nuim.ie ncg.nuim.ie/gwr/ ArcGIS?
GEOGRAPHICALLY WEIGHTED REGRESSION Outline GWR 3.0 Software for GWR (Brief) Overview of ArcMap Displaying GWR results in ArcMap stewart.fotheringham@nuim.ie http://ncg.nuim.ie ncg.nuim.ie/gwr/ ArcGIS?
Introduction to ArcGIS 10.2
 Introduction to ArcGIS 10.2 Francisco Olivera, Ph.D., P.E. Srikanth Koka Lauren Walker Aishwarya Vijaykumar Keri Clary Department of Civil Engineering April 21, 2014 Contents Brief Overview of ArcGIS 10.2...