Medical GIS: New Uses of Mapping Technology in Public Health. Peter Hayward, PhD Department of Geography SUNY College at Oneonta
|
|
|
- Gabriella Wheeler
- 5 years ago
- Views:
Transcription
1 Medical GIS: New Uses of Mapping Technology in Public Health Peter Hayward, PhD Department of Geography SUNY College at Oneonta Invited research seminar presentation at Bassett Healthcare. Cooperstown, NY, December 15, 2009


2 Personal History


3 Personal History Education B.A., Geography: Indiana University of Pennsylvania M.A., Geography: University of California Santa Barbara PhD, Geography: University of Connecticut Current Position Assistant Professor Department of Geography SUNY College at Oneonta
4 Structure of Presentation Medical GIS The process of applying specific geospatial techniques in geographic information systems (GIS) to approach issues in public health

 and Yale New Haven")
5 Modeling Service Areas of Health Care Providers Purpose Use GIS to model the current and potential service areas of Connecticut Children s Medical Center (CCMC) and Yale New Haven Hospital (YNHH)
6 Modeling Service Areas of Health Care Providers Data CT Hospital Information Management Exchange (CHIME) data on hospital admissions U.S. Census population projection data, streets data Methods Population: Model market areas based on percentage of admissions by town for CCMC versus YNHH Distance: Model CCMC market area based on timed road distance Software ArcGIS 9.3
7 Population Based Service Areas Primary Catch greater than 50% of all hospital admissions from that town CCMC Primary Service Area YNHH Primary Service Area

8 Population Based Service Areas Secondary Catch greater than 30% of all hospital admissions from that town CCMC Primary Service Area YNHH Primary Service Area CCMC Secondary Service Area YNHH Secondary Service Area

9 Population Based Service Areas Shared Nearly equal catchment of hospital admissions from that town CCMC Primary Service Area YNHH Primary Service Area CCMC Secondary Service Area YNHH Secondary Service Area CCMC-YNHH Service Area Split
10 Population Based Service Areas Pediatric Population Projections U.S. Census data projections used to determine current and future market population CCMC primary market area is projected to have a stable population CCMC secondary market area is projected to have a declining population Pediatric (Ages 0-19) Population Projection for CCMC and YNHH Service Areas, Source: Connecticut State Data Center based on 2000 U.S. Census data (
11 Distance Based Service Areas 10 Minutes
12 Distance Based Service Areas 20 Minutes
13 Distance Based Service Areas 30 Minutes

14 Distance Based Service Areas 40 Minutes
15 Distance Based Service Areas 50 Minutes
16 Distance Based Service Areas 60 Minutes
17 Advanced Service Area Analysis Primary Catch greater than 50% of all hospital admissions from that town 20 minute service distance CCMC Primary Service Area YNHH Primary Service Area


18 Advanced Service Area Analysis Questions What is unique about those towns not defined as a primary service area but within a 20 minute service distance? CCMC Primary Service Area YNHH Primary Service Area


19 Conclusions Overall Using GIS, hospital market areas can be analyzed and predicted in population or distance based models Other Variables to Consider Income and poverty, demographic characteristics, urban versus rural status
20 Structure of Presentation Medical GIS The process of applying specific geospatial techniques in geographic information systems (GIS) to approach issues in public health


21 Towards a Preferred District Design of Health Disparities Purpose Use GIS to map health disparities at different scales and zones in Connecticut

22 Mapping Minority Health Disparities Small scale maps obscure the local patterns of disparities Large scale maps may not reveal the full extent of disparities Brewer 2009, pg. 8 Chen et al. 2006, pg. 10


23 (Re)Districting Problem Brewer 2009, pg. 8 Chen et al. 2006, pg. 10

24 The Modifiable Areal Unit Problem (MAUP) The interpretation of a spatial phenomenon depends on the number and arrangement of areal units imposed on the map Zoning Effect

 Methods Map disparities")
25 Towards a Preferred District Design of Health Disparities Data Connecticut geocoded mortality data 485,930 White deaths vs. 35,580 Black deaths U.S. Census map files with population data (blocks counties) Methods Map disparities in mortality rates between Whites and Blacks at many scales and zones Software ArcGIS 9.3


26 Scale Effect TOWNS COUNTIES CENSUS TRACTS White Disparities Black Disparities BLOCK GROUPS


27 Zoning Effect TOWNS REDISTRICTING PLAN A COUNTIES White Disparities Black Disparities REDISTRICTING PLAN B


28 Conclusions Overall The locations, sizes, and significance of health disparities in Connecticut is dependent on the scales and zones used to map the problem Implication The reporting of minority health disparities within existing district designs may be based on sound measurements, but the findings may not be reliable


 to approach")
29 Structure of Presentation Medical GIS The process of applying specific geospatial techniques in geographic information systems (GIS) to approach issues in public health

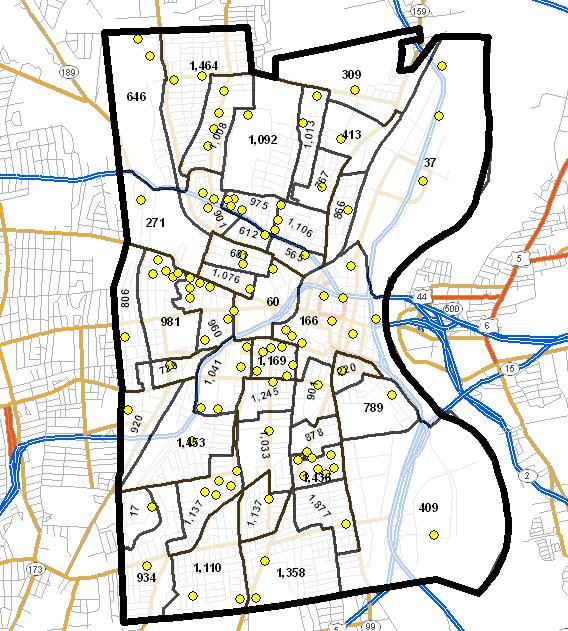
30 Geospatial Analysis of Childhood Pedestrian Collisions Purpose Use GIS to model the spatial context of childhood pedestrian collisions in Hartford, CT
31 Existing Research Braddock et al. 1991, pg Problem Grouping neighborhoods takes the space out of a spatial analysis; and different areas have different underlying child populations
32 Geospatial Analysis of Childhood Pedestrian Collisions Data Dependent Variable: frequency of childhood pedestrian collisions (90 total) determined by Hartford census tract, Independent Variables: contextual variables by census tract (poverty, education, schools, public buildings, housing characteristics, children per square mile) Methods Model statistically significant clusters and perform spatial regression analysis while accounting for underlying child population Software GeoDa

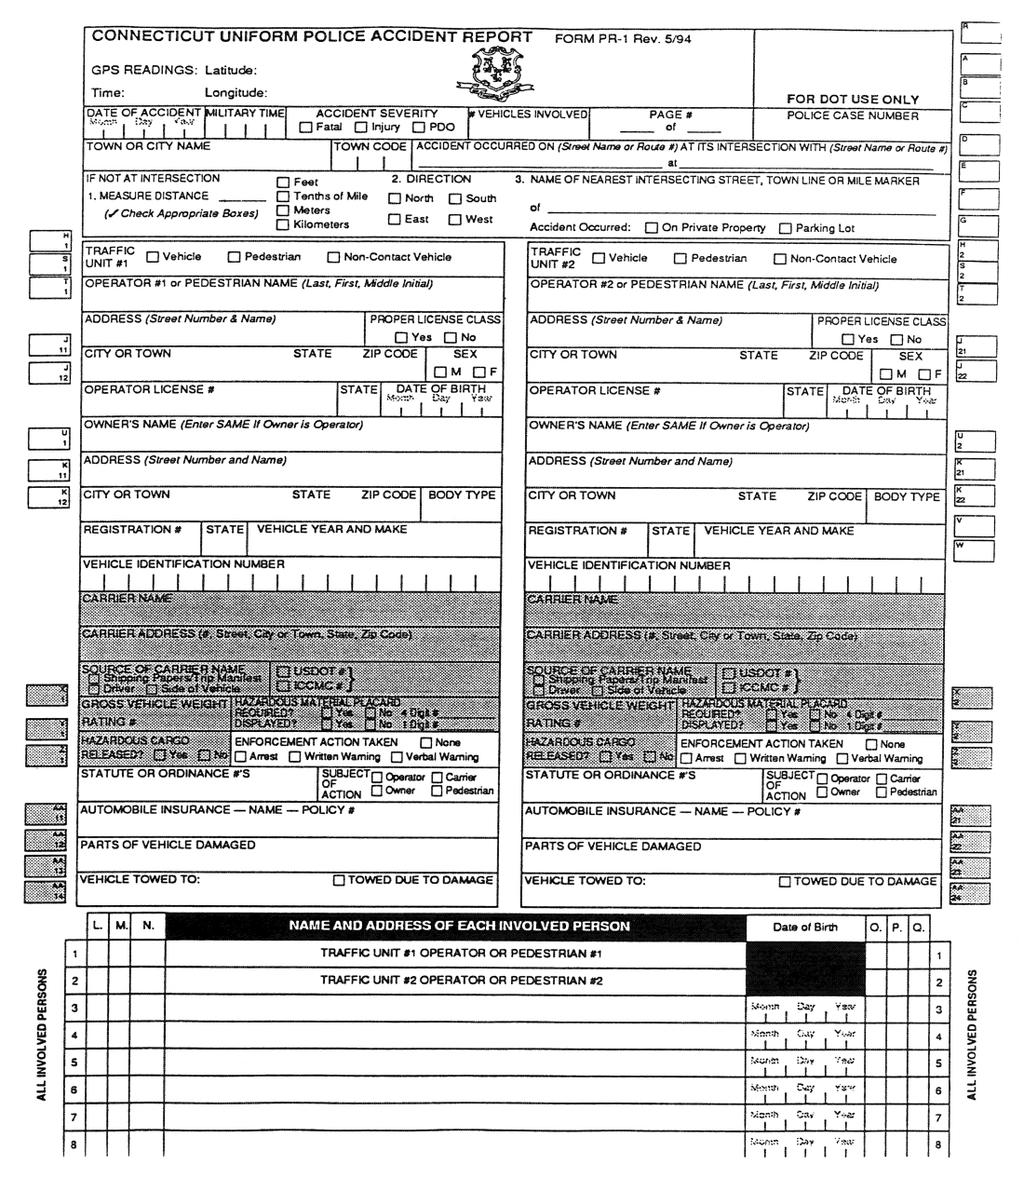
33 Data Capture

34 Identify the Locations of Collisions

35 Incorporate Child Population Data

36 Identify the Frequencies of Collisions High Frequency Moderate Frequency Low Frequency


37 GeoDa Mapping Taking underlying child population values into account, use GIS to determine statistically significant clusters of childhood pedestrian collisions

38 Spatial Clusters


39 Identify Correlating Factors and Formulate Hypotheses Poverty ~ Collision Frequency Parks ~ Collision Frequency Schools ~ Collision Frequency Police ~ Collision Frequency Housing ~ Collision Frequency Context of high frequency neighborhoods versus moderate and low frequency areas.


40 GeoDa Statistics Spatial regression analysis indicates significant associations with the number public buildings, percent female headed households, education, race, and home ownership


41 Conclusions Overall GIS is an effective tool to investigate the spatial context of childhood pedestrian collisions Implication GIS could be used to investigate the spatio-temporal characteristics of childhood pedestrian collisions, which has important ramifications for injury prevention

42 Talk Summary Medical GIS The process of applying specific geospatial techniques in geographic information systems (GIS) to approach issues in public health Other Applications Epidemiological Patient Location and Care Environment System BodyViewer Personal Goals Exploring the link between environmental factors and obesity in New York
43 Medical GIS: New Uses of Mapping Technology in Public Health Peter Hayward, PhD Department of Geography SUNY College at Oneonta Phone: Web:
Hayward, P. (2007). Mexican-American assimilation in U.S. metropolitan areas. The Pennsylvania Geographer, 45(1), 3-15.
. Mexican-American assimilation in U.S. metropolitan areas. The Pennsylvania Geographer, 45(1), 3-15.") PETER HAYWARD Assistant Professor of Geography and GIS Faculty Fellow SUNY College at Oneonta 323 Milne Library Oneonta, NY 13820 Phone: 607-436-3398 Email: haywarpm@oneonta.edu Web: http://employees.oneonta.edu/haywarpm
PETER HAYWARD Assistant Professor of Geography and GIS Faculty Fellow SUNY College at Oneonta 323 Milne Library Oneonta, NY 13820 Phone: 607-436-3398 Email: haywarpm@oneonta.edu Web: http://employees.oneonta.edu/haywarpm
Do the Causes of Poverty Vary by Neighborhood Type?
 Do the Causes of Poverty Vary by Neighborhood Type? Suburbs and the 2010 Census Conference Uday Kandula 1 and Brian Mikelbank 2 1 Ph.D. Candidate, Maxine Levin College of Urban Affairs Cleveland State
Neighborhood social characteristics and chronic disease outcomes: does the geographic scale of neighborhood matter? Malia Jones
 Neighborhood social characteristics and chronic disease outcomes: does the geographic scale of neighborhood matter? Malia Jones Prepared for consideration for PAA 2013 Short Abstract Empirical research
Spatial Disparities in the Distribution of Parks and Green Spaces in the United States
 March 11 th, 2012 Active Living Research Conference Spatial Disparities in the Distribution of Parks and Green Spaces in the United States Ming Wen, Ph.D., University of Utah Xingyou Zhang, Ph.D., CDC
This report details analyses and methodologies used to examine and visualize the spatial and nonspatial
 Analysis Summary: Acute Myocardial Infarction and Social Determinants of Health Acute Myocardial Infarction Study Summary March 2014 Project Summary :: Purpose This report details analyses and methodologies
Acknowledgments xiii Preface xv. GIS Tutorial 1 Introducing GIS and health applications 1. What is GIS? 2
 Acknowledgments xiii Preface xv GIS Tutorial 1 Introducing GIS and health applications 1 What is GIS? 2 Spatial data 2 Digital map infrastructure 4 Unique capabilities of GIS 5 Installing ArcView and the
Presented at ESRI Education User Conference, July 6-8, 2001, San Diego, CA
 Presented at ESRI Education User Conference, July 6-8, 2001, San Diego, CA Irina V. Sharkova, Ph.D., Research Assistant Professor Richard Lycan, Ph.D., Senior Research Associate Population Research Center
Spatial Variation in Local Road Pedestrian and Bicycle Crashes
 2015 Esri International User Conference July 20 24, 2015 San Diego, California Spatial Variation in Local Road Pedestrian and Bicycle Crashes Musinguzi, Abram, Graduate Research Assistant Chimba,Deo, PhD.,
Using ArcGIS Server to Bring Geospatial Analysis
 Using ArcGIS Server to Bring Geospatial Analysis and Mapping to non-gis Analysts ESRI Health User Conference September 22, 2009 Jim Laramie, Altarum Institute Sam Wang, Altarum Institute Agenda Agenda
CRP 608 Winter 10 Class presentation February 04, Senior Research Associate Kirwan Institute for the Study of Race and Ethnicity
 CRP 608 Winter 10 Class presentation February 04, 2010 SAMIR GAMBHIR SAMIR GAMBHIR Senior Research Associate Kirwan Institute for the Study of Race and Ethnicity Background Kirwan Institute Our work Using
Population Profiles
 U N D E R S T A N D I N G A N D E X P L O R I N G D E M O G R A P H I C C H A N G E MAPPING AMERICA S FUTURES, BRIEF 6 2000 2010 Population Profiles Atlanta, Las Vegas, Washington, DC, and Youngstown Allison
Administrative Data Research Facility Linked HMDA and ACS Database
 University of Pennsylvania ScholarlyCommons 2017 ADRF Network Research Conference Presentations ADRF Network Research Conference Presentations 11-2017 Administrative Data Research Facility Linked HMDA
Defining Statistically Significant Spatial Clusters of a Target Population using a Patient-Centered Approach within a GIS
 Defining Statistically Significant Spatial Clusters of a Target Population using a Patient-Centered Approach within a GIS Efforts to Improve Quality of Care Stephen Jones, PhD Bio-statistical Research
GIS = Geographic Information Systems;
 What is GIS GIS = Geographic Information Systems; What Information are we talking about? Information about anything that has a place (e.g. locations of features, address of people) on Earth s surface,
Long Island Breast Cancer Study and the GIS-H (Health)
") Long Island Breast Cancer Study and the GIS-H (Health) Edward J. Trapido, Sc.D. Associate Director Epidemiology and Genetics Research Program, DCCPS/NCI COMPREHENSIVE APPROACHES TO CANCER CONTROL September,
Long Island Breast Cancer Study and the GIS-H (Health) Edward J. Trapido, Sc.D. Associate Director Epidemiology and Genetics Research Program, DCCPS/NCI COMPREHENSIVE APPROACHES TO CANCER CONTROL September,
1Department of Demography and Organization Studies, University of Texas at San Antonio, One UTSA Circle, San Antonio, TX
 Well, it depends on where you're born: A practical application of geographically weighted regression to the study of infant mortality in the U.S. P. Johnelle Sparks and Corey S. Sparks 1 Introduction Infant
Measuring community health outcomes: New approaches for public health services research
 Research Brief March 2015 Measuring community health outcomes: New approaches for public health services research P ublic Health agencies are increasingly asked to do more with less. Tough economic times
Urban GIS for Health Metrics
 Urban GIS for Health Metrics Dajun Dai Department of Geosciences, Georgia State University Atlanta, Georgia, United States Presented at International Conference on Urban Health, March 5 th, 2014 People,
Supporting the reconfiguration of primary care services: Strategic Health Asset Planning and Evaluation
 Supporting the reconfiguration of primary care services: Strategic Health Asset Planning and Evaluation About SHAPE Strategic Health Asset Planning and Evaluation (SHAPE) is a web enabled, evidence based
Understanding China Census Data with GIS By Shuming Bao and Susan Haynie China Data Center, University of Michigan
 Understanding China Census Data with GIS By Shuming Bao and Susan Haynie China Data Center, University of Michigan The Census data for China provides comprehensive demographic and business information
Multidimensional Poverty in Colombia: Identifying Regional Disparities using GIS and Population Census Data (2005)
") Multidimensional Poverty in Colombia: Identifying Regional Disparities using GIS and Population Census Data (2005) Laura Estrada Sandra Liliana Moreno December 2013 Aguascalientes, Mexico Content 1. Spatial
Multidimensional Poverty in Colombia: Identifying Regional Disparities using GIS and Population Census Data (2005) Laura Estrada Sandra Liliana Moreno December 2013 Aguascalientes, Mexico Content 1. Spatial
Aristithes G. Doumouras BHSc 1, David Gomez MD 1, Barbara Haas MD 1, Donald M. Boyes PhD 2, Avery B. Nathens MD PhD FACS 1,3
 Aristithes G. Doumouras BHSc 1, David Gomez MD 1, Barbara Haas MD 1, Donald M. Boyes PhD 2, Avery B. Nathens MD PhD FACS 1,3 1 Keenan Research Center in the Li Ka Shing Knowledge Institute of St Michael
Temporal Changes of Access to Primary Health Care in Illinois ( ) and Policy Implications
 and Policy Implications") Journal of Medical Systems, Vol. 28, No. 3, June 2004 ( C 2004) Temporal Changes of Access to Primary Health Care in Illinois (1990 2000) and Policy Implications Wei Luo, 1,3 Fahui Wang, 1 and Carolinda
Journal of Medical Systems, Vol. 28, No. 3, June 2004 ( C 2004) Temporal Changes of Access to Primary Health Care in Illinois (1990 2000) and Policy Implications Wei Luo, 1,3 Fahui Wang, 1 and Carolinda
Purpose Study conducted to determine the needs of the health care workforce related to GIS use, incorporation and training.
 GIS and Health Care: Educational Needs Assessment Cindy Gotz, MPH, CHES Janice Frates, Ph.D. Suzanne Wechsler, Ph.D. Departments of Health Care Administration & Geography California State University Long
Demographic Data in ArcGIS. Harry J. Moore IV
 Demographic Data in ArcGIS Harry J. Moore IV Outline What is demographic data? Esri Demographic data - Real world examples with GIS - Redistricting - Emergency Preparedness - Economic Development Next
DEVELOPING DECISION SUPPORT TOOLS FOR THE IMPLEMENTATION OF BICYCLE AND PEDESTRIAN SAFETY STRATEGIES
 DEVELOPING DECISION SUPPORT TOOLS FOR THE IMPLEMENTATION OF BICYCLE AND PEDESTRIAN SAFETY STRATEGIES Deo Chimba, PhD., P.E., PTOE Associate Professor Civil Engineering Department Tennessee State University
Spatial Organization of Data and Data Extraction from Maptitude
 Spatial Organization of Data and Data Extraction from Maptitude N. P. Taliceo Geospatial Information Sciences The University of Texas at Dallas UT Dallas GIS Workshop Richardson, TX March 30 31, 2018 1/
NEW YORK DEPARTMENT OF SANITATION. Spatial Analysis of Complaints
 NEW YORK DEPARTMENT OF SANITATION Spatial Analysis of Complaints Spatial Information Design Lab Columbia University Graduate School of Architecture, Planning and Preservation November 2007 Title New York
Using GIS to Brief New York City Public Officials after September 11
 Using GIS to Brief New York City Public Officials after September 11 Presented by Zvia Segal Naphtali, Ph.D. and Leonard M. Naphtali, Ph.D. Presented at the ESRI International Health GIS Conference, May
Apéndice 1: Figuras y Tablas del Marco Teórico
 Apéndice 1: Figuras y Tablas del Marco Teórico FIGURA A.1.1 Manufacture poles and manufacture regions Poles: Share of employment in manufacture at least 12% and population of 250,000 or more. Regions:
JOINT STRATEGIC NEEDS ASSESSMENT (JSNA) Key findings from the Leicestershire JSNA and Charnwood summary
 Key findings from the Leicestershire JSNA and Charnwood summary") JOINT STRATEGIC NEEDS ASSESSMENT (JSNA) Key findings from the Leicestershire JSNA and Charnwood summary 1 What is a JSNA? Joint Strategic Needs Assessment (JSNA) identifies the big picture in terms of
JOINT STRATEGIC NEEDS ASSESSMENT (JSNA) Key findings from the Leicestershire JSNA and Charnwood summary 1 What is a JSNA? Joint Strategic Needs Assessment (JSNA) identifies the big picture in terms of
THE EFFECT OF GEOGRAPHY ON SEXUALLY TRANSMITTED
 THE EFFECT OF GEOGRAPHY ON SEXUALLY TRANSMITTED INFECTIONS Tommi L. Gaines, Dr.P.H. University of California, San Diego Division of Global Public Health Geospatial Frontiers in Health and Social Environments
Are You Maximizing The Value Of All Your Data?
 Are You Maximizing The Value Of All Your Data? Using The SAS Bridge for ESRI With ArcGIS Business Analyst In A Retail Market Analysis SAS and ESRI: Bringing GIS Mapping and SAS Data Together Presented
BROOKINGS May
 Appendix 1. Technical Methodology This study combines detailed data on transit systems, demographics, and employment to determine the accessibility of jobs via transit within and across the country s 100
Maggie M. Kovach. Department of Geography University of North Carolina at Chapel Hill
 Maggie M. Kovach Department of Geography University of North Carolina at Chapel Hill Rationale What is heat-related illness? Why is it important? Who is at risk for heat-related illness and death? Urban
ARIC Manuscript Proposal # PC Reviewed: _9/_25_/06 Status: A Priority: _2 SC Reviewed: _9/_25_/06 Status: A Priority: _2
 ARIC Manuscript Proposal # 1186 PC Reviewed: _9/_25_/06 Status: A Priority: _2 SC Reviewed: _9/_25_/06 Status: A Priority: _2 1.a. Full Title: Comparing Methods of Incorporating Spatial Correlation in
Jun Tu. Department of Geography and Anthropology Kennesaw State University
 Examining Spatially Varying Relationships between Preterm Births and Ambient Air Pollution in Georgia using Geographically Weighted Logistic Regression Jun Tu Department of Geography and Anthropology Kennesaw
Policy Paper Alabama Primary Care Service Areas
 Aim and Purpose Policy Paper Alabama Primary Care Service Areas Produced by the Office for Family Health Education & Research, UAB School of Medicine To create primary care rational service areas (PCSA)
Exercise on Using Census Data UCSB, July 2006
 Exercise on Using Census Data UCSB, July 2006 Purpose The purpose of this lab is to become familiar with Census Bureau data. Second, we will learn how to join tables which allows you to add data to the
Spatial Analysis 1. Introduction
 Spatial Analysis 1 Introduction Geo-referenced Data (not any data) x, y coordinates (e.g., lat., long.) ------------------------------------------------------ - Table of Data: Obs. # x y Variables -------------------------------------
OBESITY AND LOCATION IN MARION COUNTY, INDIANA MIDWEST STUDENT SUMMIT, APRIL Samantha Snyder, Purdue University
 OBESITY AND LOCATION IN MARION COUNTY, INDIANA MIDWEST STUDENT SUMMIT, APRIL 2008 Samantha Snyder, Purdue University Organization Introduction Literature and Motivation Data Geographic Distributions ib
GIS Spatial Statistics for Public Opinion Survey Response Rates
 GIS Spatial Statistics for Public Opinion Survey Response Rates July 22, 2015 Timothy Michalowski Senior Statistical GIS Analyst Abt SRBI - New York, NY t.michalowski@srbi.com www.srbi.com Introduction
Techniques for Science Teachers: Using GIS in Science Classrooms.
 Techniques for Science Teachers: Using GIS in Science Classrooms. After ESRI, 2008 GIS A Geographic Information System A collection of computer hardware, software, and geographic data used together for
CONSTRUCTING THE POVERTY AND OPPORTUNITIES/PUBLIC SERVICES MAPS INFORMATION MANAGEMENT. Background: Brazil Without Extreme Poverty Plan
 INFORMATION MANAGEMENT CONSTRUCTING THE POVERTY AND OPPORTUNITIES/PUBLIC SERVICES MAPS Background: Brazil Without Extreme Poverty Plan The Brazil Without Extreme Poverty Plan (BSM), designed to overcome
The History Behind Census Geography
 The History Behind Census Geography Michael Ratcliffe Geography Division US Census Bureau Kentucky State Data Center Affiliate Meeting August 5, 2016 Today s Presentation A brief look at the history behind
Social Vulnerability Index. Susan L. Cutter Department of Geography, University of South Carolina
 Social Vulnerability Index Susan L. Cutter Department of Geography, University of South Carolina scutter@sc.edu Great Lakes and St. Lawrence Cities Initiative Webinar December 3, 2014 Vulnerability The
Measuring Geographic Access to Primary Care Physicians
 Measuring Geographic Access to Primary Care Physicians The New Mexico Health Policy Commission and the University of New Mexico s Division of Government Research have been working cooperatively to collect
Utilizing GIS Technology for Rockland County. Rockland County Planning Department Douglas Schuetz & Scott Lounsbury
 Utilizing GIS Technology for Rockland County Rockland County Planning Department Douglas Schuetz & Scott Lounsbury Presentation Agenda Introduction What is GIS What can GIS do GIS Efforts for BOE Resources
Secondary Towns, Population and Welfare in Mexico
 Public Disclosure Authorized Public Disclosure Authorized Public Disclosure Authorized Secondary Towns, Population and Welfare in Mexico Isidro Soloaga Department of Economics, Universidad Iberoamericana,
Evaluating Sex Offender Exclusion Laws Alan Murray
 Evaluating Sex Offender Exclusion Laws Alan Murray Center for Urban and Regional Analysis and Department of Geography Ohio State University Columbus, OH 43210, USA Email: murray.308@osu.edu Outline Context
Integrating GIS into Food Access Analysis
 GIS Day at Kansas University Integrating GIS into Food Access Analysis Daoqin Tong School of Geography and Development Outline Introduction Research questions Method Results Discussion Introduction Food
Mapping Your Educational Research: Putting Spatial Concepts into Practice with GIS. Mark Hogrebe Washington University in St.
 Mapping Your Educational Research: Putting Spatial Concepts into Practice with GIS Mapping Your Educational Research: Putting Spatial Concepts into Practice with GIS Mark Hogrebe Washington University
DATA DISAGGREGATION BY GEOGRAPHIC
 PROGRAM CYCLE ADS 201 Additional Help DATA DISAGGREGATION BY GEOGRAPHIC LOCATION Introduction This document provides supplemental guidance to ADS 201.3.5.7.G Indicator Disaggregation, and discusses concepts
The History Behind Census Geography
 The History Behind Census Geography Michael Ratcliffe Geography Division US Census Bureau Tennessee State Data Center August 8, 2017 Today s Presentation A brief look at the history behind some of the
Links between socio-economic and ethnic segregation at different spatial scales: a comparison between The Netherlands and Belgium
 Links between socio-economic and ethnic segregation at different spatial scales: a comparison between The Netherlands and Belgium Bart Sleutjes₁ & Rafael Costa₂ ₁ Netherlands Interdisciplinary Demographic
Evaluating Community Analyst for Use in School Demography Studies
 Portland State University PDXScholar Publications, Reports and Presentations Population Research Center 7-2013 Evaluating Community Analyst for Use in School Demography Studies Richard Lycan Portland State
Spatial segregation and socioeconomic inequalities in health in major Brazilian cities. An ESRC pathfinder project
 Spatial segregation and socioeconomic inequalities in health in major Brazilian cities An ESRC pathfinder project Income per head and life-expectancy: rich & poor countries Source: Wilkinson & Pickett,
In matrix algebra notation, a linear model is written as
 DM3 Calculation of health disparity Indices Using Data Mining and the SAS Bridge to ESRI Mussie Tesfamicael, University of Louisville, Louisville, KY Abstract Socioeconomic indices are strongly believed
compass.durhamnc.gov Building Community by Illustrating Community Durham s Neighborhood Compass
 Building Community by Illustrating Community Durham s Neighborhood Compass A presentation by John Killeen Rob Cushman Tyler Waring Neighborhood Improvement Services & Technology Solutions City of Durham,
Tracey Farrigan Research Geographer USDA-Economic Research Service
 Rural Poverty Symposium Federal Reserve Bank of Atlanta December 2-3, 2013 Tracey Farrigan Research Geographer USDA-Economic Research Service Justification Increasing demand for sub-county analysis Policy
How is Your Health? Using SAS Macros, ODS Graphics, and GIS Mapping to Monitor Neighborhood and Small-Area Health Outcomes
 Paper 3214-2015 How is Your Health? Using SAS Macros, ODS Graphics, and GIS Mapping to Monitor Neighborhood and Small-Area Health Outcomes Roshni Shah, Santa Clara County Public Health Department ABSTRACT
Final Group Project Paper. Where Should I Move: The Big Apple or The Lone Star State
 Final Group Project Paper Where Should I Move: The Big Apple or The Lone Star State By: Nathan Binder, Shannon Scolforo, Kristina Conste, Madison Quinones Main Goal: Determine whether New York or Texas
Exploring the Association Between Family Planning and Developing Telecommunications Infrastructure in Rural Peru
 Exploring the Association Between Family Planning and Developing Telecommunications Infrastructure in Rural Peru Heide Jackson, University of Wisconsin-Madison September 21, 2011 Abstract This paper explores
Introduction to GIS. Dr. M.S. Ganesh Prasad
 Introduction to GIS Dr. M.S. Ganesh Prasad Department of Civil Engineering The National Institute of Engineering, MYSORE ganeshprasad.nie@gmail.com 9449153758 Geographic Information System (GIS) Information
GIS Lecture 5: Spatial Data
 GIS Lecture 5: Spatial Data GIS 1 Outline Vector Data Formats Raster Data Formats Map Projections Coordinate Systems US Census geographic files US Census data files GIS Data Sources GIS 2 Vector Data Formats
GeoHealth Applications Platform ESRI Health GIS Conference 2013
 GeoHealth Applications Platform ESRI Health GIS Conference 2013 Authors Thomas A. Horan, Ph.D. Professor, CISAT Director April Moreno Health GeoInformatics Ph.D. Student Brian N. Hilton, Ph.D. Clinical
Nature of Spatial Data. Outline. Spatial Is Special
 Nature of Spatial Data Outline Spatial is special Bad news: the pitfalls of spatial data Good news: the potentials of spatial data Spatial Is Special Are spatial data special? Why spatial data require
Big-Geo-Data EHR Infrastructure Development for On-Demand Analytics
 Big-Geo-Data EHR Infrastructure Development for On-Demand Analytics Sohayla Pruitt, MA Senior Geospatial Scientist Duke Medicine DUHS DHTS EIM HIRS Page 1 Institute of Medicine, World Health Organization,
Developing Built Environment Indicators for Urban Oregon. Dan Rubado, MPH EPHT Epidemiologist Oregon Public Health Division
 Developing Built Environment Indicators for Urban Oregon Dan Rubado, MPH EPHT Epidemiologist Oregon Public Health Division What is the built environment? The built environment encompasses spaces and places
Transferability of Household Travel Data Across Geographic Areas Using NHTS 2001
 Transferability of Household Travel Data Across Geographic Areas Using NHTS 2001 Jane Lin PhD Assistant Professor Department of Civil and Materials Engineering Institute for Environmental Science and Policy
Michael Thomas Sullivan
 Michael Thomas Sullivan michael.sullivan2@lc.cuny.edu Home Address 2319 Brigham Street Brooklyn, NY 11229 Cell (516) 729-8870 Academic Address Geographic Information Science Dept. Lehman College, CUNY
Analyzing the Geospatial Rates of the Primary Care Physician Labor Supply in the Contiguous United States
 Analyzing the Geospatial Rates of the Primary Care Physician Labor Supply in the Contiguous United States By Russ Frith Advisor: Dr. Raid Amin University of W. Florida Capstone Project in Statistics April,
BROADBAND DEMAND AGGREGATION: PLANNING BROADBAND IN RURAL NORTHERN CALIFORNIA
 BROADBAND DEMAND AGGREGATION: PLANNING BROADBAND IN RURAL NORTHERN CALIFORNIA Steven J. Steinberg, Ph.D a,b, *, Rebecca Degagne a, M.S., Michael Gough a a Institute for Spatial Analysis, Humboldt State
Defining Neighbourhoods in Durham Region
 Defining Neighbourhoods in Durham Region Mary-Anne Pietrusiak Epidemiology and Evaluation Unit Durham Region Health Department Agency for Health Protection and Promotion Workshop Public Health GIS Projects
Market access and rural poverty in Tanzania
 Market access and rural poverty in Tanzania Nicholas Minot International Food Policy Research Institute 2033 K St. NW Washington, D.C., U.S.A. Phone: +1 202 862-8199 Email: n.minot@cgiar.org Contributed
Where to Invest Affordable Housing Dollars in Polk County?: A Spatial Analysis of Opportunity Areas
 Resilient Neighborhoods Technical Reports and White Papers Resilient Neighborhoods Initiative 6-2014 Where to Invest Affordable Housing Dollars in Polk County?: A Spatial Analysis of Opportunity Areas
User Guide. Affirmatively Furthering Fair Housing Data and Mapping Tool. U.S. Department of Housing and Urban Development
 User Guide Affirmatively Furthering Fair Housing Data and Mapping Tool U.S. Department of Housing and Urban Development December, 2015 1 Table of Contents 1. Getting Started... 5 1.1 Software Version...
Understanding Your Community A Guide to Data
 Understanding Your Community A Guide to Data Alex Lea September 2013 Research and Insight Team LeicestershireCounty Council Understanding Geographies Important to understand the various geographies that
CRP 272 Introduction To Regression Analysis
 CRP 272 Introduction To Regression Analysis 30 Relationships Among Two Variables: Interpretations One variable is used to explain another variable X Variable Independent Variable Explaining Variable Exogenous
hurricane harvey and equitable recovery
 hurricane harvey and equitable recovery Mapping social vulnerability and intensity of wind and flooding from Hurricane Harvey in Texas hurricane harvey s impact on texas In August 2017, Hurricane Harvey
GIS and Demography. John R. Weeks Professor of Geography and Director International Population Center
 GIS and Demography John R. Weeks Professor of Geography and Director International Population Center Introduction to Spatial Pattern Analysis in a GIS Environment Center for Spatially Integrated Social
2010 Census Data Release and Current Geographic Programs. Michaellyn Garcia Geographer Seattle Regional Census Center
 2010 Census Data Release and Current Geographic Programs Michaellyn Garcia Geographer Seattle Regional Census Center 2010 Center of Population Located approximately 2.7 miles northeast of Plato, Missouri
Hennepin GIS. Tree Planting Priority Areas - Analysis Methodology. GIS Services April 2018 GOAL:
 Hennepin GIS GIS Services April 2018 Tree Planting Priority Areas - Analysis Methodology GOAL: To create a GIS data layer that will aid Hennepin County Environment & Energy staff in determining where to
Geography and Usability of the American Community Survey. Seth Spielman Assistant Professor of Geography University of Colorado
 Geography and Usability of the American Community Survey Seth Spielman Assistant Professor of Geography University of Colorado Goals 1. To convince you that the margins of error from the American Community
An online data and consulting resource of THE UNIVERSITY OF TOLEDO THE JACK FORD URBAN AFFAIRS CENTER
 An online data and consulting resource of THE JACK FORD URBAN AFFAIRS CENTER THE CENTER FOR GEOGRAPHIC INFORMATION SCIENCE AND APPLIED GEOGRAPHICS DEPARTMENT OF GEOGRAPHY AND PLANNING THE UNIVERSITY OF
emerge Network: CERC Survey Survey Sampling Data Preparation
 emerge Network: CERC Survey Survey Sampling Data Preparation Overview The entire patient population does not use inpatient and outpatient clinic services at the same rate, nor are racial and ethnic subpopulations
Inclusion of Non-Street Addresses in Cancer Cluster Analysis
 Inclusion of Non-Street Addresses in Cancer Cluster Analysis Sue-Min Lai, Zhimin Shen, Darin Banks Kansas Cancer Registry University of Kansas Medical Center KCR (Kansas Cancer Registry) KCR: population-based
AN INTRODUCTION TO GEOSPATIAL TECHNOLOGY AS IT RELATES TO CREATING BASELINE INFORMATION FOR CLIMATE, HEALTH, DISASTER, AND DISEASE MAPPING AND CHANGE
 AN INTRODUCTION TO GEOSPATIAL TECHNOLOGY AS IT RELATES TO CREATING BASELINE INFORMATION FOR CLIMATE, HEALTH, DISASTER, AND DISEASE MAPPING AND CHANGE Carl L. Zimmerman, PhD Tufts University, UEPP and Geospatial
Application of Indirect Race/ Ethnicity Data in Quality Metric Analyses
 Background The fifteen wholly-owned health plans under WellPoint, Inc. (WellPoint) historically did not collect data in regard to the race/ethnicity of it members. In order to overcome this lack of data
Finding Common Ground Through GIS
 Finding Common Ground Through GIS Matthew Stone, MPH Special Unit for Technical Assistance Chronic Disease and Injury Control California Department of Public Health ESRI Health GIS Conference Scottsdale,
EICCARS WORKBOOK FOR INITIATING COMMUNITY PROFILES WITH STATISTICAL AND OTHER SECONDARY DATA
 The Cultural Ecology of Health and Change (CEHC) Working Papers Ethnographically Informed Community and Cultural Assessment Research Systems (EICCARS) Workbooks EICCARS WORKBOOK FOR INITIATING COMMUNITY
Using American Factfinder
 Using American Factfinder What is American Factfinder? American Factfinder is a search engine that provides access to the population, housing and economic data collected by the U.S. Census Bureau. It can
A GIS TOUR OF DES MOINES PRESENTED BY ANNA WHIPPLE, GIS MANAGER APRIL 20, 2015
 A GIS TOUR OF DES MOINES PRESENTED BY ANNA WHIPPLE, GIS MANAGER APRIL 20, 2015 Welcome to Des Moines! Capital of Iowa Among 100 largest metropolitan areas Insurance, biotech, healthcare, and entertainment
 Table 1. Answers to income and consumption adequacy questions Percentage of responses: less than adequate more than adequate adequate Total income 68.7% 30.6% 0.7% Food consumption 46.6% 51.4% 2.0% Clothing
Geographic Systems and Analysis
 Geographic Systems and Analysis New York University Robert F. Wagner Graduate School of Public Service Instructor Stephanie Rosoff Contact: stephanie.rosoff@nyu.edu Office hours: Mondays by appointment
PROFESSIONAL EXPERIENCE
 Ph.D. Candidate 1832 Ellison Hall, Department of Geography University of California, Santa Barbara Santa Barbara, CA 93106 Phone: 805-455-3817; E-mail: srinath@geog.ucsb.edu EDUCATION University of California,
2011 Clendening Summer Fellowship Proposal. Describing the Patient Experience Using Geographic Information Systems
 2011 Clendening Summer Fellowship Proposal Describing the Patient Experience Using Geographic Information Systems Introduction The following proposal outlines my project for a 2011 Clendening Summer Fellowship.
KENTUCKY HAZARD MITIGATION PLAN RISK ASSESSMENT
 KENTUCKY HAZARD MITIGATION PLAN RISK ASSESSMENT Presentation Outline Development of the 2013 State Hazard Mitigation Plan Risk Assessment Determining risk assessment scale Census Data Aggregation Levels
Assessing Geographical Inaccessibility to Health Care: Using GIS Network Based Methods
 Public Health Research 2014, 4(5): 145-159 DOI: 10.5923/j.phr.20140405.01 Assessing Geographical Inaccessibility to Health Care: Using GIS Network Based Methods Sudha Yerramilli 1,*, Duber Gomez Fonseca
A spatial literacy initiative for undergraduate education at UCSB
 A spatial literacy initiative for undergraduate education at UCSB Mike Goodchild & Don Janelle Department of Geography / spatial@ucsb University of California, Santa Barbara ThinkSpatial Brown bag forum