The Church Demographic Specialists
|
|
|
- Erica Watson
- 5 years ago
- Views:
Transcription
1


2

3

4
5 The Church Demographic Specialists Easy-to-Use Features Map-driven, Web-based Software An Integrated Suite of Information and Query Tools Providing An Insightful Window into the Communities You Serve
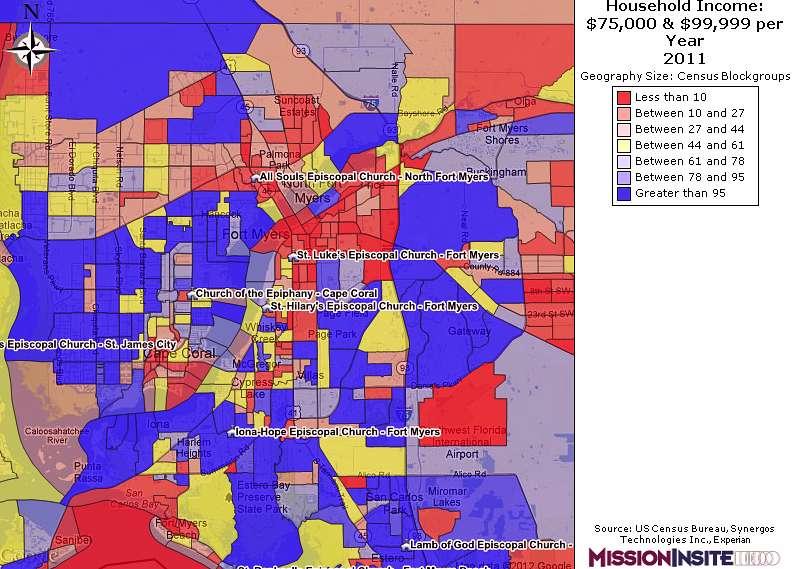
6 Key Services Tier 1 Community Demographics for Every Parish 76 Current demographic selections with 5 year projections 10 year forecasts for population, households and age 120 Current socio-economic variables 60 Mosaic socio-economic segmentation types Automatic semi-annual updates for all demographic variables Queried on map by point and click Map-driven, web-based, easy-to-learn application Easy to create custom study areas Easy to query underlying data; point and click Point & click export charts maps & reports to PowerPoint, Word or printing Access anywhere via web No technical training required
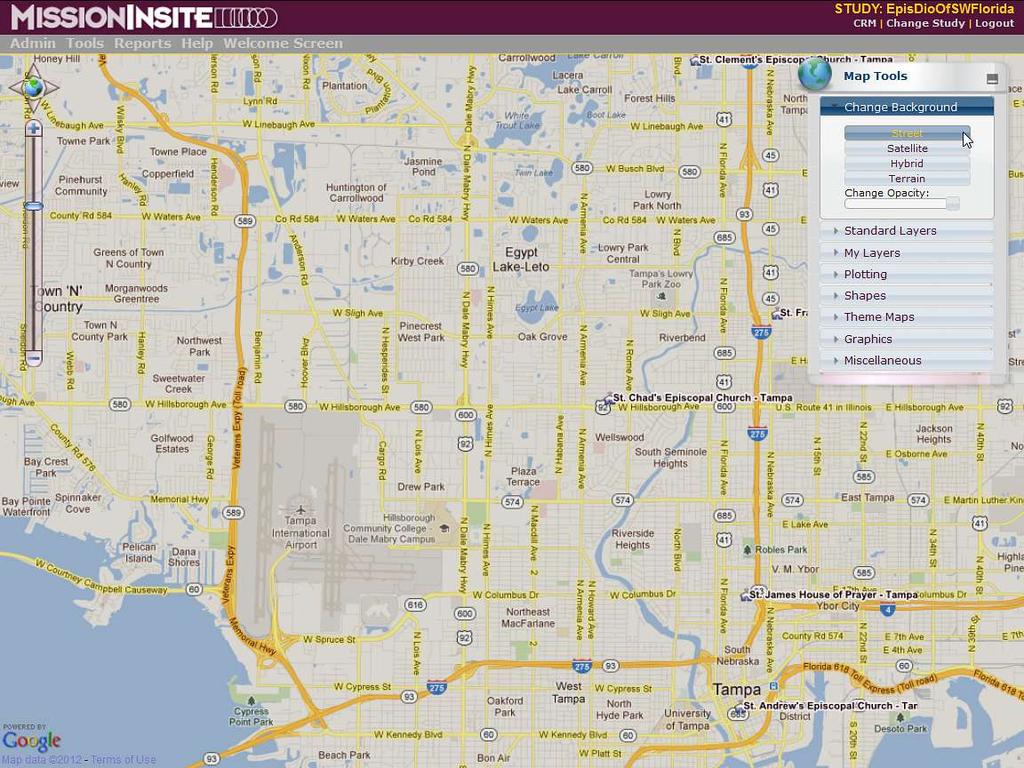
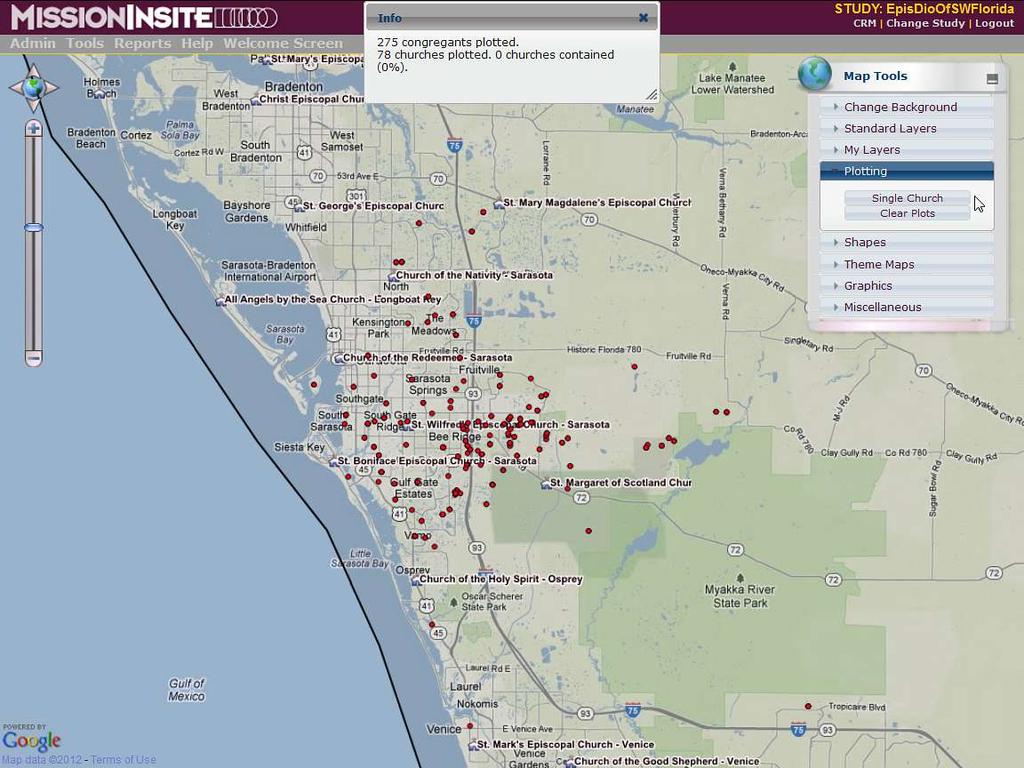
7 Key Services Tier 1 Mapping Interface: Google Maps with Street, Terrain, Satellite and Hybrid Views. Street View also accessible where available. Church Location Plotting and Mapping Create regional church maps for development planning Create custom church cluster maps for collaborative ministry QuickInsite, ExecutiveInsite and FullInsite Summary Reports Available for any area. Also available in REPORT WIZARD Impressions Report Behavioral ViewPoint of an area. Also available in REPORT WIZARD Opportunity Scan Provides ability to analyze any geography for ministry opportunities

8 Display Diocesan Map With Parish Locations

9 Zoom In For More Church Location Detail

10 Terrain View Is The Default Map View
11 Example of Street View Map
12

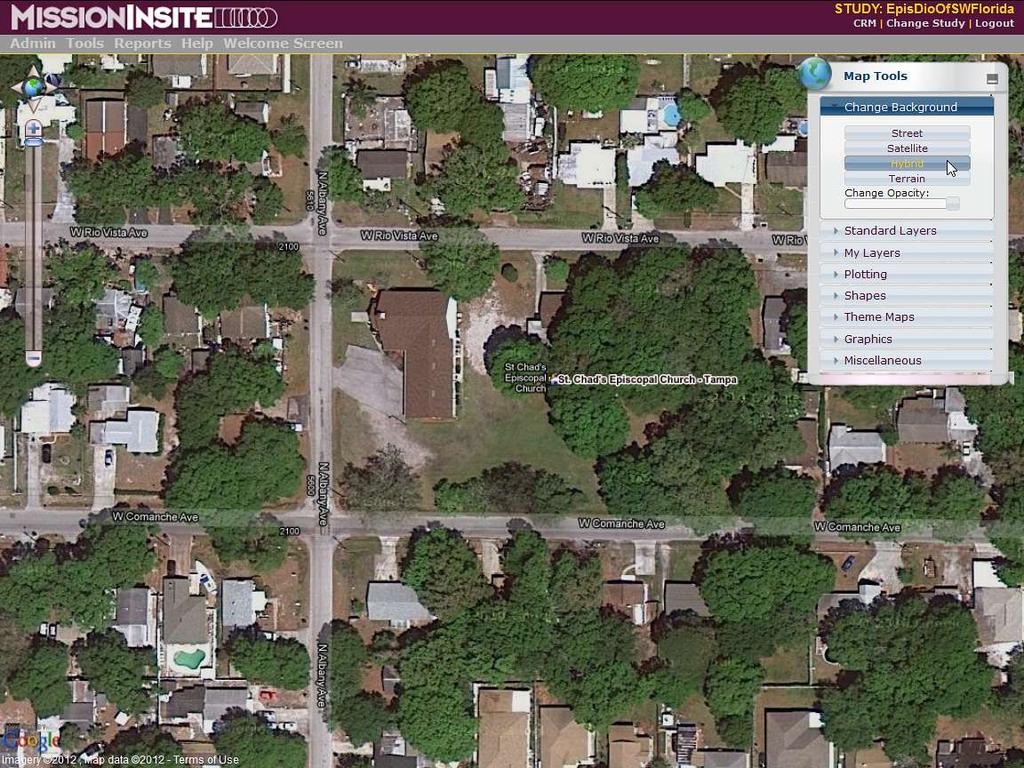
13 Example of Satellite View Map
14

15 Example of Hybrid View Map

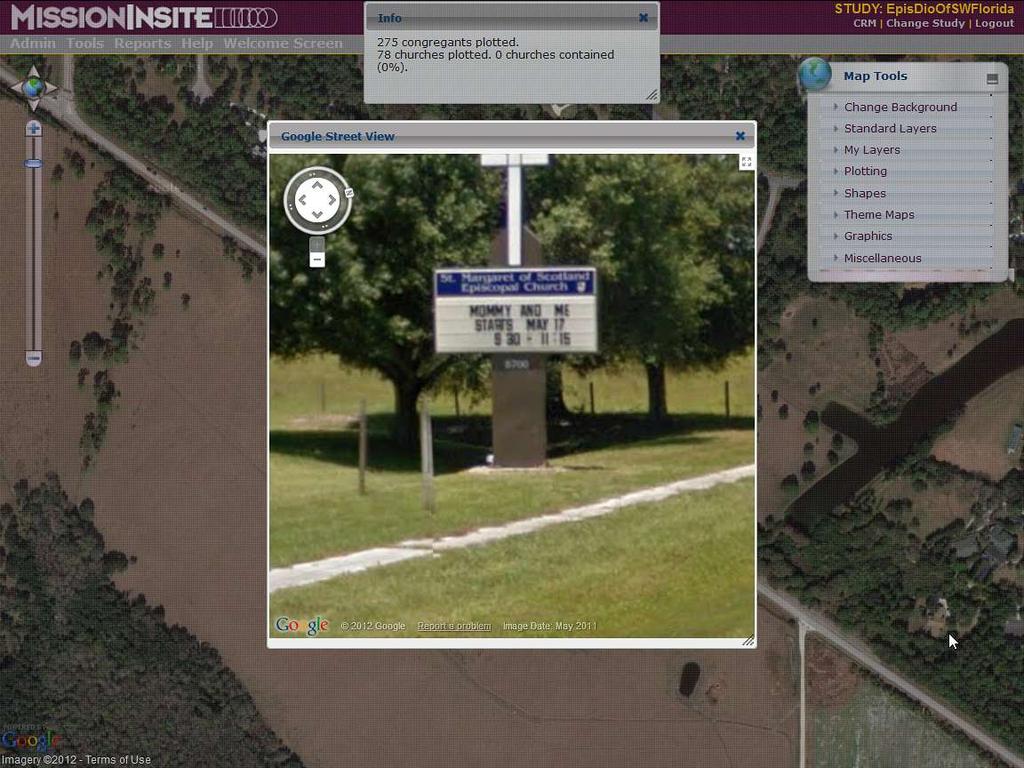
16 Right Click Your Mouse For System Options Including Google Street View Where Available

17 Example of Google Street View

18 Display Standard Layers Such As Zip Code or County Boundaries Example of Zip Code Boundaries with Labels
19 Select A Standard Layer Geography From The Shapes Menu To Generate A Report
20 Example of Selecting Zipcode Boundaries For Report Generation
21 Left Click Your Mouse Anywhere On The Map Screen to Select the Corresponding Zipcode Boundary The Selected Zipcode Boundary Appears in a Dark Blue Outline. You may also Select Multiple Zipcode Boundaries

22 Select From 4 Predefined Reports For Any Geography
23

24 Select Build A Report To View Only The Information You Require

25 View Your Information Or Download The Data To Excel For Additional Analysis
26 Example of Selecting Data Variables Contained on the Diversity Tab

27 View Your Information Or Download The Data To Excel For Additional Analysis
28
29
30 Draw A Custom Polygon From The Shapes Menu On The Map Tool Toolbar
31 As You Draw Your Polygon The Shape Appears As A Shaded Area

32 Double Click The Left Mouse Button To Finish The Polygon When Finished The Polygon Will Appear As A Dark Blue Outline

33 Opportunity Scan As A Strategic Planning Tool
34 Scan For Hispanic Population by Zipcodes in 2011

35 Opportunity Scan Results Appear In Table and Map Form The Table Data May Be Saved To Excel For Additional Study


36 Highest 2011 Hispanic Presence Within A Zipcode Boundary Is In Zipcode Noted By The Marker

37 Top 5 Highest 2011 Hispanic Presence Within A Zipcode Boundary Noted By The Markers

38 3 or 5 Highest 2011 Hispanic Presence Within A Zipcode Boundary Clustered Noted By The Markers

39 Opportunity Scan at Church Level
40

41
 Question: Where are the Singles and Young Families 25 to 34 Years Old in 2011 by")
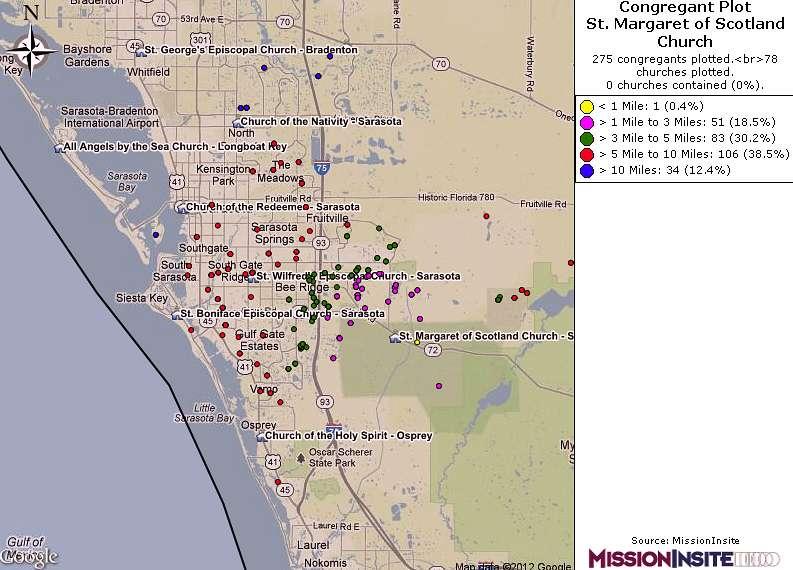
42 St. Margaret of Scotland Sample Ministry Area 320 Square Miles (Based Upon Congregant Plot Distribution) Question: Where are the Singles and Young Families 25 to 34 Years Old in 2011 by Census Tract?

43 Singles and Young Families 25 to 34 Years Old in 2011 Darkest Blue Census Tract Areas

44 Singles and Young Families 25 to 34 Years Old in 2011 Top 5 Census Tract Areas Noted by Markers

45 Displaying Zip Code Geographies

46 Displaying Census Tract Geographies Approx Persons Per Tract

47 Displaying Block Group Geographies Approx Persons Per Block Group

48 APPLICATION You have learned from your demographic report that MOSIAC Segment J02 Latino Nuevo is present in your ministry area. WHO ARE THEY? WHERE ARE THEY? HOW WILL YOU FIND OUT? WHAT DO YOU DO NEXT? Continue Mission Discovery Using Thematic Maps

49 Step One: Select Theme Map Variable Primary Mosaic Type And Display By Block Group

50 Primary Mosaic Type Displayed By Block Group

51 Step Two: Zoom in to locate Mosaic Type J02 Latino Nuevo. Now we know WHERE they are! How do we learn WHO they are and HOW TO REACH THEM?

52 Step Three: Download the Mission Impact Guide from the Help Menu/Documents section of your map screen.


53 Step Four: Select and review the MOSAIC Segment information for any household type you choose. The following example is J02 Latino Nuevo.
54


55
56


57

58

59 Step Six: Create additional Theme Maps for other demographic variables you have questions about. This Theme Map illustrates Hispanic Latino population by block group in 2011

60 You can create printable maps for PowerPoint or other programs from any Thematic Map screen.
61
62

63
. Now what do we do?")
64 APPLICATION We have learned from this Theme Map where households believe it is important to attend religious services (Dark Blue Areas). Now what do we do? Who are they and how do we reach them?

65 Step 1: Select a blockgroup with high preference for Attend Religious Services (Dark Blue Areas on this map). Step 2: Select Predefined Reports to generate a demographic report for THAT area or Build Report for the area selecting only they variables you are interested in viewing.
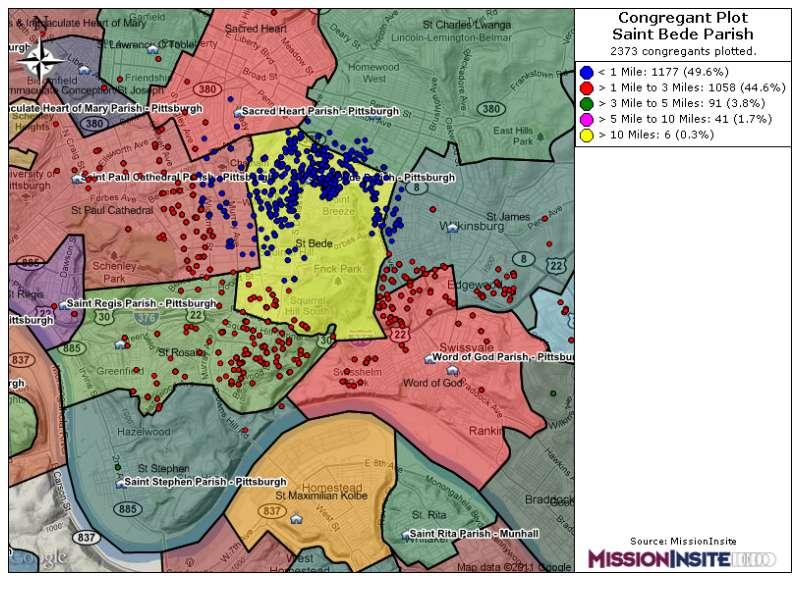
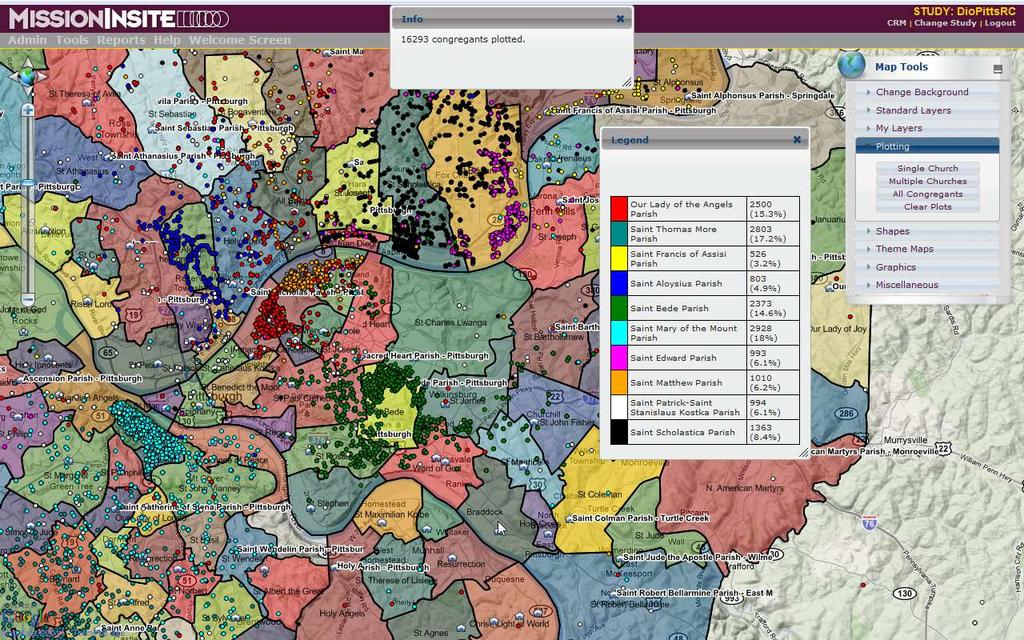
66 Key Services Tier 2 Congregant Plotting Easy to use congregant upload interface Unlimited uploads for always current congregant plots Congregant Plot Analysis Tools Plot membership types, i.e. members, children, or visitors Discover how congregants are distributed and where they are located Retrieve names and addresses by selected group for any geographic area All congregants are coded by their Mosaic Type which provides the ability to compare congregants to their community/neighborhood Congregant Plot Maps Create congregant plot maps for planning and ministry development Integrate congregant plot maps into committee or regional presentations

67 89,483 Congregants Plotted In The Diocese of Pittsburgh

68 89,483 Congregants Plotted Displaying the Vicariate Boundaries With Congregants

69 2,373 Congregants Plotted From St. Bede Parish
70

71 308 Congregants From St. Bede Parish Inside St. Rosalia Parish Boundary

72 Congregant Mailing List Selecting St. Bede Congregants Located Inside St. Rosalia Parish
73
74
75
76
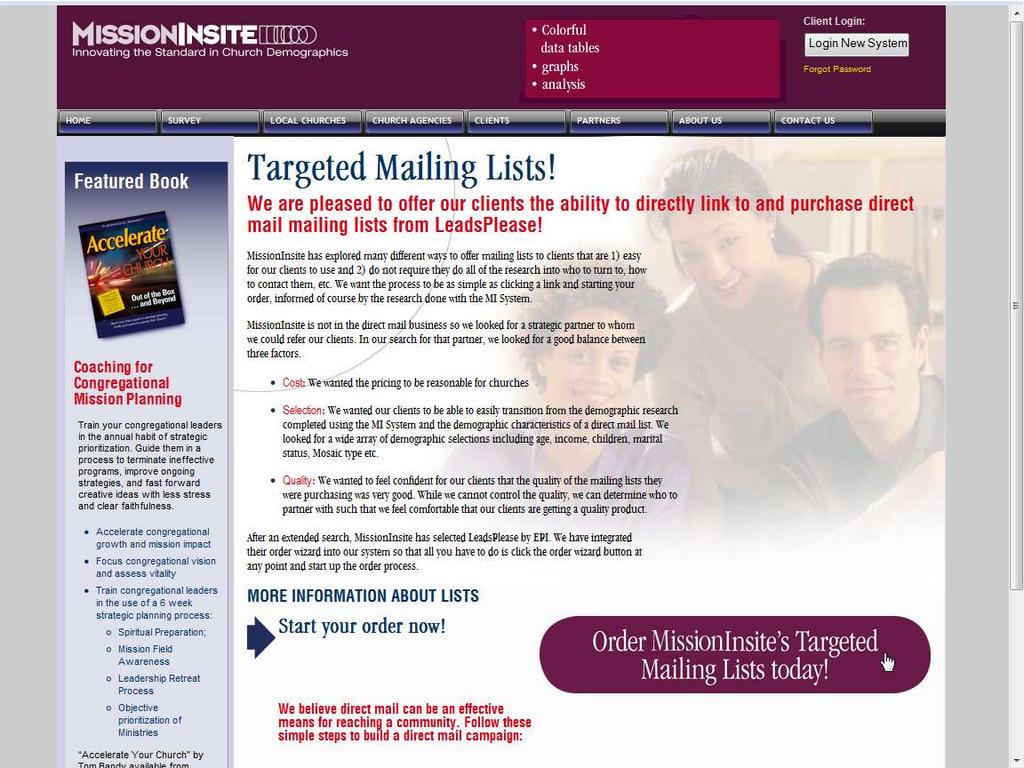
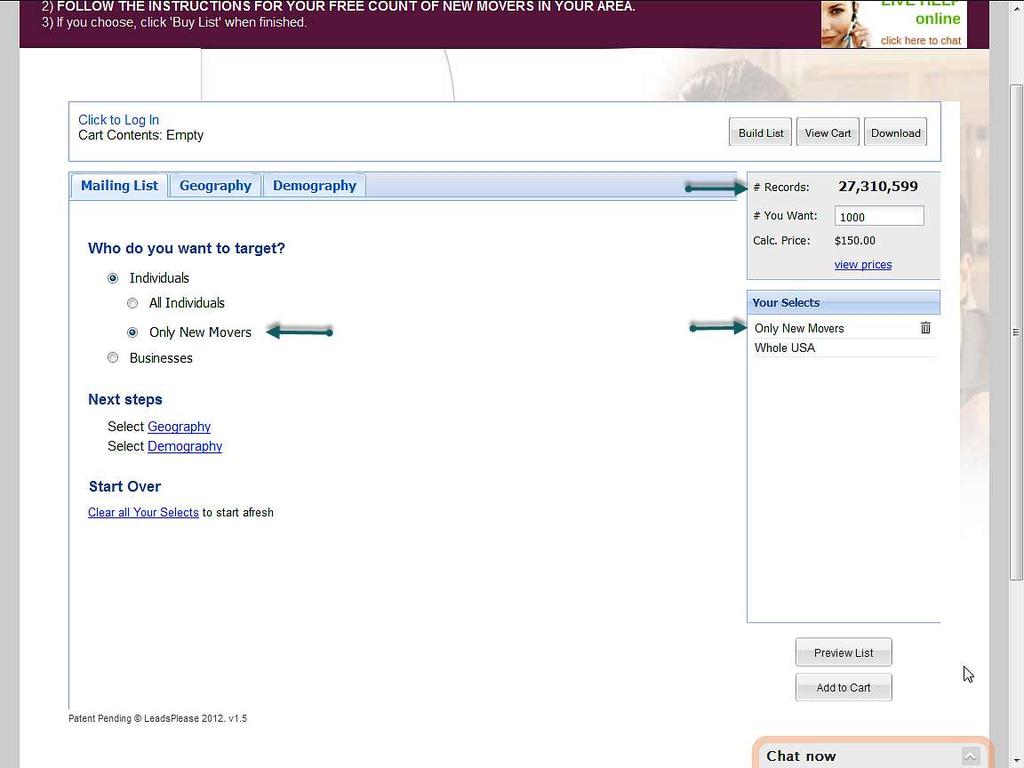
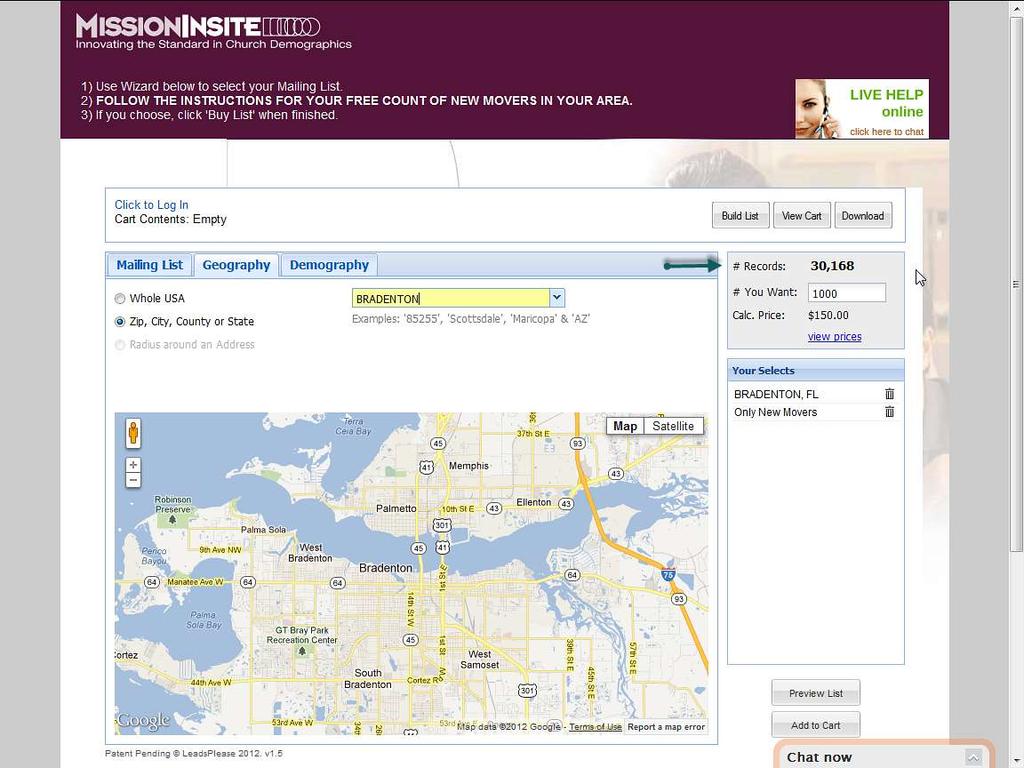
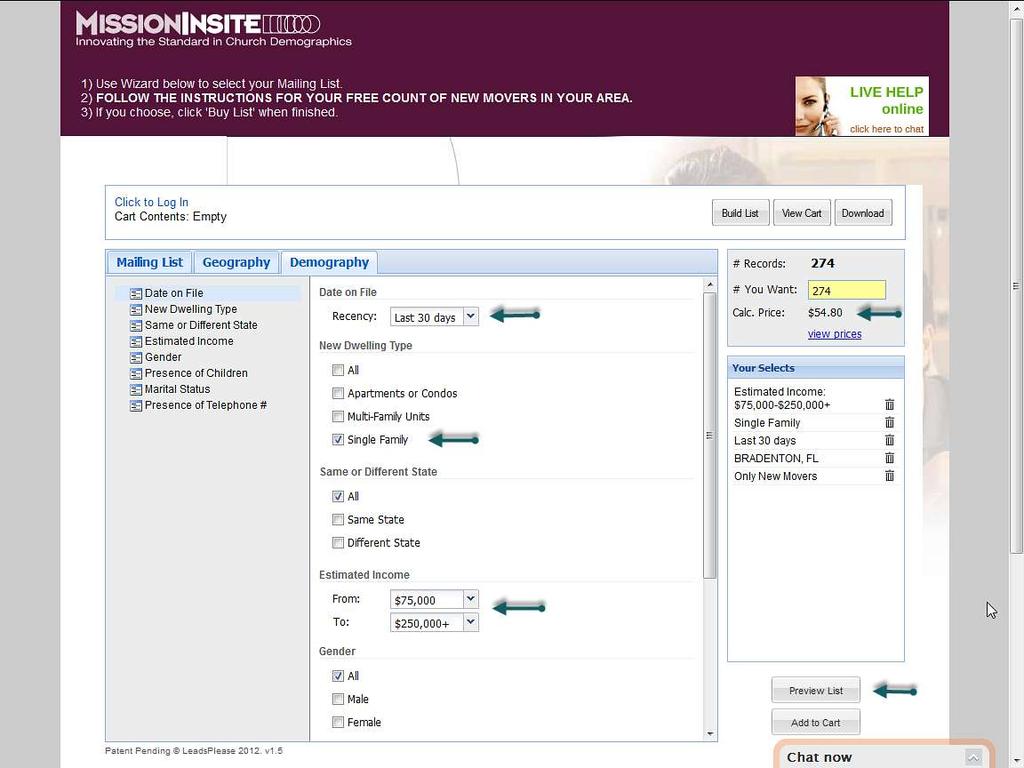
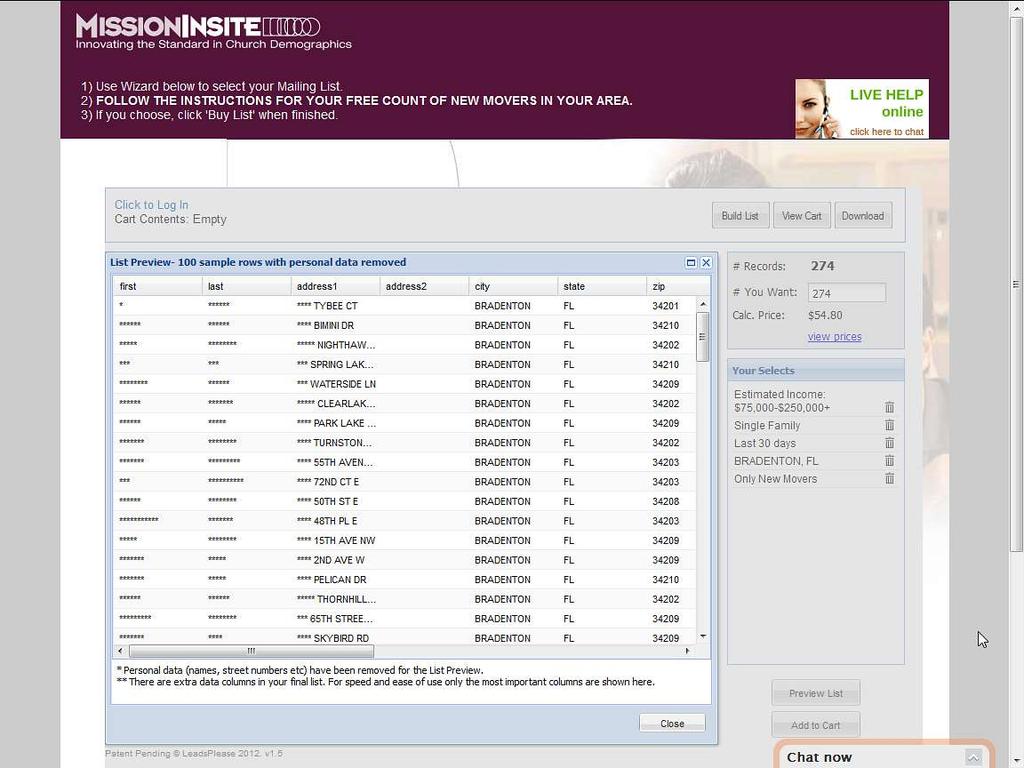
77 Advanced System Options Added Cost Options New Movers, New Home Owners and Residential Selections Ability to locate and communicate with selected groups in your area of ministry Selects include households by age, income, family structure and Mosaic Use Congregant Plot feature to view new movers addresses in relation to church member addresses Custom Plotting People or Places Plot schools, daycare centers, hospitals or other denominational agencies
78
79
80
81
82
83 On Demand Information for Regional Body Sub Regional Areas Counties Cities Zip Codes Census Tracts Block Groups Radius from.25 mile to 15 mile radius
84 On Demand Information for Custom Polygon geographies created to the shape and size dictated by the environment These shapes can be saved for access later and to view the location of member or visitor households
85 Overview Reports Demographic Trends Racial/Ethnic Trends Population/Households Forecast Phase of Life Forecast Average Income Trends: Households and Per Capita Disposable Household Income Mosaic
86 Overview Reports Summary: Phase of Life Summary: Population by Household Type Summary: Population 5+: Language Spoken at Home Summary: Families in Poverty Summary: Asset to Debt Summary: Housing Units
87 People Reports Population Trends Components of Change Past 12 Months Population: Recent 8 Quarter History Seasonal Population: Recent 8 Quarter History Transient Population: Recent 8 Quarter History Population: Currently Enrollment in Education Population by Educational Attainment: 25+
88 People Reports Population by Phase of Life: Detail Population by Age: Detail Age Forecast Population by Gender Population by Marital Status 15+: Single Female Population by Marital Status 15+: Single Male Population: Group Quarters
89 People Reports Population by Marital Status Age 15+ Population by School Age Population by School Age Detail/Grade Population by Household Type Outreach Opportunities: Children Outreach Opportunities: Preschool Outreach Opportunities: Youth and Young Adult
90 Households Reports Households Household Income Trends Household Type Trends Households by Size Households by Gender: One Person Households by Number of Vehicles Disposable Household Income: Detail
91 Households Reports NonFamily Households NonFamily Income Trends NonFamily Households : By Gender NonFamily Households: Persons per Household Owner Households by Number of Vehicles Renter Households by Number of Vehicles
92 Families Reports Families Family Household Income Trends Families: Household Trends by Size Families: With Children Families: No Children Families: Poverty Detail
93 Diversity Reports Diversity Index Racial/Ethnic Trends: Detail Population: Asian Alone Population: Hispanic or Latino by Origin Population by Ancestry Population 5+ by Language Spoken at Home (Detail)
94 Housing Reports Housing Housing Units by Occupancy Housing Availability Score Housing Trends: By Dwelling Type Housing Trends: Value Owner-Occupied
95 Housing Reports Housing Trends: Occupied Units by Own or Rent Housing Trends: Units by Year Built Housing by Occupancy Type Mortgage Risk: Filings by Risk Ratio
96 Work Reports Pop 16+ by Employment Status Current Year Employed Pop 16+ Blue/White Collar Employed Civilian Pop 16+ by Occupation Employed Pop 16+ by Sector Current Year Workers 16+: Home or Away Workers 16+: Transport to Work Workers 16+: Travel Time to Work Unemployment
97 ViewPoint Reports Life Concerns and Well Being Lifestyle Preferences Charitable Contributions Last Year Charitable Contributions Last Yr: $200 Or More Personal Perspectives Social Values Religious Practices
98 Mapping Summary View entire Regional Body area with ability to move to selected areas and create a map for each of the variables Save any of the maps you create on your computer, copy into a word document or another medium like Power Point
99 Mapping Summary Excellent tool for use in meetings to provide visual illustrations of the impact of the demographic information on a specific area under discussion Compare the impact of the information in multiple areas on the screen
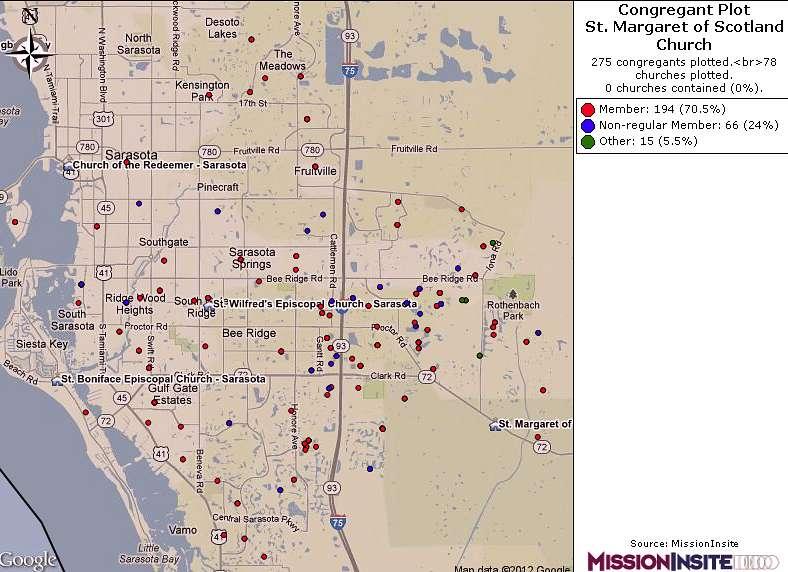
100 Congregant Plot Summary Map each of the households by address associated with your church Visually see where members and visitors live Analysis of member/demographics of area Connect members/visitors in same area Target mailings to areas or by member status
101 Insite Church Demographic Specialists The most flexible web based information system comprehensive socioeconomic and lifestyle data interactive mapping platform responsive system to answer individual questions strategic information resource for ministry value and benefit for your financial investment
102
The econ Planning Suite: CPD Maps and the Con Plan in IDIS for Consortia Grantees Session 1
 The econ Planning Suite: CPD Maps and the Con Plan in IDIS for Consortia Grantees Session 1 1 Training Objectives Use CPD Maps to analyze, assess, and compare levels of need in your community Use IDIS
Working with Census 2000 Data from MassGIS
 Tufts University GIS Tutorial Working with Census 2000 Data from MassGIS Revised September 26, 2007 Overview In this tutorial, you will use pre-processed census data from Massachusetts to create maps of
Using American Factfinder
 Using American Factfinder What is American Factfinder? American Factfinder is a search engine that provides access to the population, housing and economic data collected by the U.S. Census Bureau. It can
Are You Maximizing The Value Of All Your Data?
 Are You Maximizing The Value Of All Your Data? Using The SAS Bridge for ESRI With ArcGIS Business Analyst In A Retail Market Analysis SAS and ESRI: Bringing GIS Mapping and SAS Data Together Presented
AFFH-T User Guide September 2017 AFFH-T User Guide U.S. Department of Housing and Urban Development
 AFFH-T User Guide Affirmatively Furthering Fair Housing Data and Mapping Tool v. 4.1 U.S. Department of Housing and Urban Development September 2017 Version 4.1 ❿ September 2017 Page 1 Document History
User Guide. Affirmatively Furthering Fair Housing Data and Mapping Tool. U.S. Department of Housing and Urban Development
 User Guide Affirmatively Furthering Fair Housing Data and Mapping Tool U.S. Department of Housing and Urban Development December, 2015 1 Table of Contents 1. Getting Started... 5 1.1 Software Version...
Orien Ori t en a t tion a Webi W nar: ebi CPD Maps 2
 Orientation Webinar: CPD Maps 2 Agenda 1. Background - econ Planning Suite 2. Expanded Planning Data 3. CPD Maps Overview 4. Demonstration Guide Me Wizard Map Selection Identify Tool Printing and Saving
Demographic Data. How to get it and how to use it (with caution) By Amber Keller
 By Amber Keller") Demographic Data How to get it and how to use it (with caution) By Amber Keller 101 Where does it come from? o The American Community Survey o Socio-economic characteristics of a population o Administered
Demographic Data How to get it and how to use it (with caution) By Amber Keller 101 Where does it come from? o The American Community Survey o Socio-economic characteristics of a population o Administered
Module 10 Summative Assessment
 Module 10 Summative Assessment Activity In this activity you will use the three dimensions of vulnerability that you learned about in this module exposure, sensitivity, and adaptive capacity to assess
2014 Planning Database (PDB)
") 2014 Planning Database (PDB) November 19, 2014 Barbara O Hare, Nancy Bates, Julia Coombs, Travis Pape, Chandra Erdman Office of Survey Analytics 1 Overview Tract and Block Group PDBs Useful for: Identifying
2014 Planning Database (PDB) November 19, 2014 Barbara O Hare, Nancy Bates, Julia Coombs, Travis Pape, Chandra Erdman Office of Survey Analytics 1 Overview Tract and Block Group PDBs Useful for: Identifying
Spatial Organization of Data and Data Extraction from Maptitude
 Spatial Organization of Data and Data Extraction from Maptitude N. P. Taliceo Geospatial Information Sciences The University of Texas at Dallas UT Dallas GIS Workshop Richardson, TX March 30 31, 2018 1/
Demographic Data in ArcGIS. Harry J. Moore IV
 Demographic Data in ArcGIS Harry J. Moore IV Outline What is demographic data? Esri Demographic data - Real world examples with GIS - Redistricting - Emergency Preparedness - Economic Development Next
Utilizing Data from American FactFinder with TIGER/Line Shapefiles in ArcGIS
 Utilizing Data from American FactFinder with TIGER/Line Shapefiles in ArcGIS Web Adams, GISP Data Dissemination Specialist U.S. Census Bureau New York Regional Office 1 What We Do Decennial Census Every
Child Opportunity Index Mapping
 Child Opportunity Index Mapping A partnership project of How to Use and Interpret the Child Opportunity Index Maps How to Use the Child Opportunity Index Maps Getting Started: How to Find and Open a Child
ADDRESSING TITLE VI AND ENVIRONMENTAL JUSTICE IN LONG-RANGE TRANSPORTATION PLANS
 ADDRESSING TITLE VI AND ENVIRONMENTAL JUSTICE IN LONG-RANGE TRANSPORTATION PLANS Activities from the National Capital Region Transportation Planning Board Sergio Ritacco Transportation Planner 2017 Association
Guide to the Data-Driven Planning Toolkit in CPD Maps
 The econ Planning Suite: Guide to the Data-Driven Planning Toolkit in CPD Maps Version: April 2014 TABLE OF CONTENTS Introduction... 1 The Data-Driven Planning Toolkit... 3 Overview of the Basic Model...
Assessing Social Vulnerability to Biophysical Hazards. Dr. Jasmine Waddell
 Assessing Social Vulnerability to Biophysical Hazards Dr. Jasmine Waddell About the Project Built on a need to understand: The pre-disposition of the populations in the SE to adverse impacts from disaster
INSIDE. Metric Descriptions by Topic Area. Data Sources and Methodology by Topic Area. Technical Appendix
 As part of the Chicago Neighborhoods 2015 (CN2015) project, the Institute for Housing Studies at DePaul University collected data and built metrics to help The Chicago Community Trust and the City of Chicago
ACS Multiyear PUMS Estimates and Usage: User-Created PUMS Files. Nate Ramsey U.S. Department of Education
 ACS Multiyear PUMS Estimates and Usage: User-Created PUMS Files Nate Ramsey U.S. Department of Education Research Questions 1. How accurate are concatenated single-year PUMS file estimates? 2. How often
Quality Measures Green Light Report Online Management Tool. Self Guided Tutorial
 Quality Measures Green Light Report Online Management Tool Self Guided Tutorial 1 Tutorial Contents Overview Access the QM Green Light Report Review the QM Green Light Report Tips for Success Contact PointRight
The Realist Map contains several views that let you see different aspects about the properties you ve selected on the Map:
 Realist Map Views The Realist Map contains several views that let you see different aspects about the properties you ve selected on the Map: Road: The Road view is a standard Map view showing the roads
Acknowledgments xiii Preface xv. GIS Tutorial 1 Introducing GIS and health applications 1. What is GIS? 2
 Acknowledgments xiii Preface xv GIS Tutorial 1 Introducing GIS and health applications 1 What is GIS? 2 Spatial data 2 Digital map infrastructure 4 Unique capabilities of GIS 5 Installing ArcView and the
Exercise on Using Census Data UCSB, July 2006
 Exercise on Using Census Data UCSB, July 2006 Purpose The purpose of this lab is to become familiar with Census Bureau data. Second, we will learn how to join tables which allows you to add data to the
Administrative Data Research Facility Linked HMDA and ACS Database
 University of Pennsylvania ScholarlyCommons 2017 ADRF Network Research Conference Presentations ADRF Network Research Conference Presentations 11-2017 Administrative Data Research Facility Linked HMDA
Community Opportunity Map
 Community Opportunity Map User Guide and FAQs UPDATED FEBRUARY 2018 Contents User Guide... 2 Overview... 2 Choosing a location... 3 Search for a city or address... 4 Select a county or ZIP code... 4 Explore
A Street Named for a King
 A Street Named for a King Dr. Jerry Mitchell University of South Carolina OVERVIEW This lesson adapts the work of Dr. Derek Alderman, a geographer who has used the Martin Luther King, Jr. street-naming
Speakers: Jeff Price, Federal Transit Administration Linda Young, Center for Neighborhood Technology Sofia Becker, Center for Neighborhood Technology
 Speakers: Jeff Price, Federal Transit Administration Linda Young, Center for Neighborhood Technology Sofia Becker, Center for Neighborhood Technology Peter Haas, Center for Neighborhood Technology Craig
OnTheMap for Emergency Management
 OnTheMap for Emergency Management Robert Pitts Geographer/Project Manager Longitudinal Employer Household Dynamics (LEHD) Center for Economic Studies U.S. Census Bureau Jody Hoon-Star Geographer/Application
Tutorial using the 2011 Statistics Canada boundary files and the Householder survey
 Tutorial using the 2011 Statistics Canada boundary files and the Householder survey In this tutorial, we ll try to determine the wards that contain the highest income groups. To do this, we will have to
PALS: Neighborhood Identification, City of Frederick, Maryland. David Boston Razia Choudhry Chris Davis Under the supervision of Chao Liu
 PALS: Neighborhood Identification, City of Frederick, Maryland David Boston Razia Choudhry Chris Davis Under the supervision of Chao Liu University of Maryland School of Architecture, Planning & Preservation
2010 Census Data Release and Current Geographic Programs. Michaellyn Garcia Geographer Seattle Regional Census Center
 2010 Census Data Release and Current Geographic Programs Michaellyn Garcia Geographer Seattle Regional Census Center 2010 Center of Population Located approximately 2.7 miles northeast of Plato, Missouri
Preparing Spatial Data
 13 CHAPTER 2 Preparing Spatial Data Assessing Your Spatial Data Needs 13 Assessing Your Attribute Data 13 Determining Your Spatial Data Requirements 14 Locating a Source of Spatial Data 14 Performing Common
An Instructional Module. FieldScope Unit 1. Introduction to National Geographic Society s FieldScope Program.
 An Instructional Module FieldScope Unit 1 www.budburst.org/fieldscope Introduction to National Geographic Society s FieldScope Program Unit Contents Overview 3 Learning Objectives Time Commitment Technical
(THIS IS AN OPTIONAL BUT WORTHWHILE EXERCISE)
") PART 2: Analysis in ArcGIS (THIS IS AN OPTIONAL BUT WORTHWHILE EXERCISE) Step 1: Start ArcCatalog and open a geodatabase If you have a shortcut icon for ArcCatalog on your desktop, double-click it to start
PART 2: Analysis in ArcGIS (THIS IS AN OPTIONAL BUT WORTHWHILE EXERCISE) Step 1: Start ArcCatalog and open a geodatabase If you have a shortcut icon for ArcCatalog on your desktop, double-click it to start
How is Your Health? Using SAS Macros, ODS Graphics, and GIS Mapping to Monitor Neighborhood and Small-Area Health Outcomes
 Paper 3214-2015 How is Your Health? Using SAS Macros, ODS Graphics, and GIS Mapping to Monitor Neighborhood and Small-Area Health Outcomes Roshni Shah, Santa Clara County Public Health Department ABSTRACT
Data Matrix User Guide
 Data Matrix User Guide 1. Introduction The 2017 Data Matrix is designed to support the 2017 iteration of the Regional Skills Assessments (RSAs) in Scotland. The RSAs align with the Regional Outcome Agreement
Gis Unit TropMed Mahidol U.
 Gis Unit TropMed Mahidol U. Database Information System Database Concepts 1. Non-Spatial Database table, document.. 2. Spatial Database locational databases (geographic) + attribute databases Gis Unit
A Comprehensive Method for Identifying Optimal Areas for Supermarket Development. TRF Policy Solutions April 28, 2011
 A Comprehensive Method for Identifying Optimal Areas for Supermarket Development TRF Policy Solutions April 28, 2011 Profile of TRF The Reinvestment Fund builds wealth and opportunity for lowwealth communities
GIS Lecture 5: Spatial Data
 GIS Lecture 5: Spatial Data GIS 1 Outline Vector Data Formats Raster Data Formats Map Projections Coordinate Systems US Census geographic files US Census data files GIS Data Sources GIS 2 Vector Data Formats
Spatial Analysis using Vector GIS THE GOAL: PREPARATION:
 PLAN 512 GIS FOR PLANNERS Department of Urban and Environmental Planning University of Virginia Fall 2006 Prof. David L. Phillips Spatial Analysis using Vector GIS THE GOAL: This tutorial explores some
APPENDIX C-3 Equitable Target Areas (ETA) Technical Analysis Methodology
 Technical Analysis Methodology") APPENDIX C-3 Equitable Target Areas (ETA) Technical Analysis Methodology Contents Introduction... 1 ETA Index Methodology... 1 ETA Index Development... 1 Other EJ Measures... 4 The Limited English Proficiency
APPENDIX C-3 Equitable Target Areas (ETA) Technical Analysis Methodology Contents Introduction... 1 ETA Index Methodology... 1 ETA Index Development... 1 Other EJ Measures... 4 The Limited English Proficiency
GEOGRAPHIC INFORMATION SYSTEMS Session 8
 GEOGRAPHIC INFORMATION SYSTEMS Session 8 Introduction Geography underpins all activities associated with a census Census geography is essential to plan and manage fieldwork as well as to report results
In this exercise we will learn how to use the analysis tools in ArcGIS with vector and raster data to further examine potential building sites.
 GIS Level 2 In the Introduction to GIS workshop we filtered data and visually examined it to determine where to potentially build a new mixed use facility. In order to get a low interest loan, the building
Introduction To Raster Based GIS Dr. Zhang GISC 1421 Fall 2016, 10/19
 Introduction To Raster Based GIS Dr. Zhang GISC 1421 Fall 2016, 10/19 Model of the course Using and making maps Navigating GIS maps Map design Working with spatial data Geoprocessing Spatial data infrastructure
MIS 0855 Data Science (Section 005) Fall 2016 In-Class Exercise (Week 4) Visualizing with Maps
 Fall 2016 In-Class Exercise (Week 4) Visualizing with Maps") MIS 0855 Data Science (Section 005) Fall 2016 In-Class Exercise (Week 4) Visualizing with Maps Objective: Learn how to use Tableau s powerful mapping tools Learning Outcomes: Learn at what levels (e.g.
MIS 0855 Data Science (Section 005) Fall 2016 In-Class Exercise (Week 4) Visualizing with Maps Objective: Learn how to use Tableau s powerful mapping tools Learning Outcomes: Learn at what levels (e.g.
Trip Generation Model Development for Albany
 Trip Generation Model Development for Albany Hui (Clare) Yu Department for Planning and Infrastructure Email: hui.yu@dpi.wa.gov.au and Peter Lawrence Department for Planning and Infrastructure Email: lawrence.peter@dpi.wa.gov.au
Map your way to deeper insights
 Map your way to deeper insights Target, forecast and plan by geographic region Highlights Apply your data to pre-installed map templates and customize to meet your needs. Select from included map files
Maps, Graphs and Metrics: How Local Agencies Put Data to Work. Vivien Deparday Manager of the Community Information and Mapping System June 20, 2012
 Maps, Graphs and Metrics: How Local Agencies Put Data to Work Vivien Deparday Manager of the Community Information and Mapping System June 20, 2012 Social Planning Council of Ottawa Small non-profit organization
A User s Guide to the Federal Statistical Research Data Centers
 A User s Guide to the Federal Statistical Research Data Centers Mark Roberts Professor of Economics and Director PSU FSRDC September 2016 M. Roberts () RDC User s Guide September 2016 1 / 14 Outline Introduction
GIS Workshop UCLS_Fall Forum 2014 Sowmya Selvarajan, PhD TABLE OF CONTENTS
 TABLE OF CONTENTS TITLE PAGE NO. 1. ArcGIS Basics I 2 a. Open and Save a Map Document 2 b. Work with Map Layers 2 c. Navigate in a Map Document 4 d. Measure Distances 4 2. ArcGIS Basics II 5 a. Work with
Integrated Electricity Demand and Price Forecasting
 Integrated Electricity Demand and Price Forecasting Create and Evaluate Forecasting Models The many interrelated factors which influence demand for electricity cannot be directly modeled by closed-form
AUTOMATED METERED WATER CONSUMPTION ANALYSIS
 AUTOMATED METERED WATER CONSUMPTION ANALYSIS Shane Zhong 1, Nick Turich 1, Patrick Hayde 1 1. Treatment and Network Planning, SA Water, Adelaide, SA, Australia ABSTRACT Water utilities collect and store
Census Transportation Planning Products (CTPP)
") Census Transportation Planning Products (CTPP) Penelope Weinberger CTPP Program Manager - AASHTO September 15, 2010 1 What is the CTPP Program Today? The CTPP is an umbrella program of data products, custom
Census Transportation Planning Products (CTPP) Penelope Weinberger CTPP Program Manager - AASHTO September 15, 2010 1 What is the CTPP Program Today? The CTPP is an umbrella program of data products, custom
Mapping Social Vulnerability and Lyme Disease in Vermont
 Mapping Social Vulnerability and Lyme Disease in Vermont March 30, 2017, Dr. Joseph Holler Contact email: joseph@josephholler.com Website: www.josephholler.com This work is licensed under a Creative Commons
An Assessment of People, Place and Business on Syracuse s Near Northside
 An Assessment of People, Place and Business on Syracuse s Near Northside May 2013 Report produced by Jon Glass, Kelly Montague and Mark Pawliw Edited by Jon Glass and Jonnell Robinson Syracuse Community
Enhanced Mapping. RP Data Professional. What you will learn in this guide. CoreLogic RP Data Professional Getting Started Guide Series
 RP Data Professional Enhanced Mapping What you will learn in this guide This guide will show you how to use RP Data Professional enhanced mapping capabilities to research and present details about a target
Outline. What is MapPlace? MapPlace Toolbar & PopUp Menu. Geology Themes 1:5M 1:1M BCGS 1:250,000. Terranes
 Outline BRITISH COLUMBIA Overview and Explore MapPlace Website Data Delivery & Map Themes Data Sources & Updates Feature Topics New Data & Maps New MINFILE Online Exploration Assistant with Image Analysis
For Sublease. Turn-Key Restaurant 1303 South 72nd Street Suites 101 & 102 Omaha, NE 68124
 For Sublease Turn-Key Restaurant 0 South nd Street Suites 0 & 0 Omaha, NE Turn-key restaurant located in one of Omaha s hottest retail corridors, this mixed-use retail center has a former endcap restaurant
GIS Geographical Information Systems. GIS Management
 GIS Geographical Information Systems GIS Management Difficulties on establishing a GIS Funding GIS Determining Project Standards Data Gathering Map Development Recruiting GIS Professionals Educating Staff
Sample Profile Report
 Customer File Name Upload Date Match Count R_SJB Enrollment.TXT 09/09/13 663 of 757 names Income Range Code New (Red: Zipcode Average) Home Market Value (Red: Zipcode Average) 3 $40K-$50K $50K-60K $60K-$75K
SANTA CLARA COUNTY THEMATIC ATLAS
 1 SANTA CLARA COUNTY THEMATIC ATLAS Project Overview Douglas Schenk, GIS Analyst Sampa Patra, GIS Analyst Making the Thematic Atlas 2 Brought to you by the County of Santa Clara Public Health Department,
Task 1: Open ArcMap and activate the Spatial Analyst extension.
 Exercise 10 Spatial Analyst The following steps describe the general process that you will follow to complete the exercise. Specific steps will be provided later in the step-by-step instructions component
Basic Training Battlemind to Home Symposium. Sept
 Basic Training Battlemind to Home Symposium Sept 2017 1 What is Measuring Communities? A social indicators project which allows users to obtain military-specific information about communities strengths
ArcGIS 9 ArcGIS StreetMap Tutorial
 ArcGIS 9 ArcGIS StreetMap Tutorial Copyright 2001 2008 ESRI All Rights Reserved. Printed in the United States of America. The information contained in this document is the exclusive property of ESRI. This
Applying Health Outcome Data to Improve Health Equity
 Applying Health Outcome Data to Improve Health Equity Devon Williford, MPH, Health GIS Specialist Lorraine Dixon-Jones, Policy Analyst CDPHE Health Equity and Environmental Justice Collaborative Mile High
Instructions for Mapping 2011 Census Data
 Instructions for Mapping 2011 Census Data To map 2011 census data, you must download the census boundary files and the census data separately, then join the two files in ArcMap. In this guide, we will
WlLPEN L. GORR KRISTEN S. KURLAND. Universitats- und Landesbibliothek. Bibliothek Architektur und Stadtebau ESRI
 hj WlLPEN L. GORR KRISTEN S. KURLAND Universitats- und Landesbibliothek Darmstadt Bibliothek Architektur und Stadtebau ESRI Contents Acknowledgments Preface xvii XV GIS Tutorial 1 Introduction Launch ArcMap
Tutorial. Getting started. Sample to Insight. March 31, 2016
 Getting started March 31, 2016 Sample to Insight CLC bio, a QIAGEN Company Silkeborgvej 2 Prismet 8000 Aarhus C Denmark Telephone: +45 70 22 32 44 www.clcbio.com support-clcbio@qiagen.com Getting started
Leveraging Web GIS: An Introduction to the ArcGIS portal
 Leveraging Web GIS: An Introduction to the ArcGIS portal Derek Law Product Management DLaw@esri.com Agenda Web GIS pattern Product overview Installation and deployment Configuration options Security options
Understanding China Census Data with GIS By Shuming Bao and Susan Haynie China Data Center, University of Michigan
 Understanding China Census Data with GIS By Shuming Bao and Susan Haynie China Data Center, University of Michigan The Census data for China provides comprehensive demographic and business information
My Map Activity MINNESOTA SOCIAL STUDIES STANDARDS & BENCHMARKS
 My Map Activity OVERVIEW & OBJECTIVES Students will learn the basics of Google Maps while using geospatial data to create their neighborhood map with the places they spend time. They will also collect
Oakland County Parks and Recreation GIS Implementation Plan
 Oakland County Parks and Recreation GIS Implementation Plan TABLE OF CONTENTS 1.0 Introduction... 3 1.1 What is GIS? 1.2 Purpose 1.3 Background 2.0 Software... 4 2.1 ArcGIS Desktop 2.2 ArcGIS Explorer
CIRES Web Map Application Design Overview
 CIRES Web Map Application Design Overview Prepared by: Natalie Chan Ho Man, Greenest/ Healthy City Scholar, August 2018 Prepared for: Wes Regan, Social Planner II, Social Policy & Project Division, City
How GIS can be used for improvement of literacy and CE programmes
 How GIS can be used for improvement of literacy and CE programmes Training Workshop for Myanmar Literacy Resource Center (MLRC) ( Yangon, Myanmar, 11 20 October 2000 ) Presented by U THEIN HTUT GEOCOMP
 www.goldensoftware.com Why Create a Thematic Map? A thematic map visually represents the geographic distribution of data. MapViewer will help you to: understand demographics define sales or insurance territories
Write a report (6-7 pages, double space) on some examples of Internet Applications. You can choose only ONE of the following application areas:
 on some examples of Internet Applications. You can choose only ONE of the following application areas:") UPR 6905 Internet GIS Homework 1 Yong Hong Guo September 9, 2008 Write a report (6-7 pages, double space) on some examples of Internet Applications. You can choose only ONE of the following application
UPR 6905 Internet GIS Homework 1 Yong Hong Guo September 9, 2008 Write a report (6-7 pages, double space) on some examples of Internet Applications. You can choose only ONE of the following application
Climate Risk Visualization for Adaptation Planning and Emergency Response
 Climate Risk Visualization for Adaptation Planning and Emergency Response NCR Flood Fact Finding Workshop Ricardo Saavedra ricardo@vizonomy.com Social Media, Mobile, and Big Data St. Peter s Basilica,
Lecture 1 Introduction to GIS. Dr. Zhang Spring, 2017
 Lecture 1 Introduction to GIS Dr. Zhang Spring, 2017 Topics of the course Using and making maps Navigating GIS Map design Working with spatial data Geoprocessing Spatial data infrastructure Digitizing
Social and Economic Impacts of Brownfield Redevelopment in Florida New Analytical Tools to Assess the State and Tribal Response Program
 Social and Economic Impacts of Brownfield Redevelopment in Florida New Analytical Tools to Assess the State and Tribal Response Program Christian Wells Our mission is to leverage interdisciplinary scientific
Neighborhood social characteristics and chronic disease outcomes: does the geographic scale of neighborhood matter? Malia Jones
 Neighborhood social characteristics and chronic disease outcomes: does the geographic scale of neighborhood matter? Malia Jones Prepared for consideration for PAA 2013 Short Abstract Empirical research
Globally Estimating the Population Characteristics of Small Geographic Areas. Tom Fitzwater
 Globally Estimating the Population Characteristics of Small Geographic Areas Tom Fitzwater U.S. Census Bureau Population Division What we know 2 Where do people live? Difficult to measure and quantify.
This report details analyses and methodologies used to examine and visualize the spatial and nonspatial
 Analysis Summary: Acute Myocardial Infarction and Social Determinants of Health Acute Myocardial Infarction Study Summary March 2014 Project Summary :: Purpose This report details analyses and methodologies
Population Research Center (PRC) Oregon Population Forecast Program
 Oregon Population Forecast Program") Population Research Center (PRC) Oregon Population Forecast Program 2013 Oregon League of Cities Conference Risa S. Proehl Jason R. Jurjevich, Ph.D. Population Research Center (PRC) Population Research
Population Research Center (PRC) Oregon Population Forecast Program 2013 Oregon League of Cities Conference Risa S. Proehl Jason R. Jurjevich, Ph.D. Population Research Center (PRC) Population Research
The geography of domestic energy consumption
 The geography of domestic energy consumption Anastasia Ushakova PhD student at CDRC UCL Ellen Talbot PhD student at CDRC Liverpool Some important research questions How can we classify energy consumption
Where do I live? Geography teaching resource. Paula Owens. Primary. Locating own home address
 Where do I live? Locating own home address Paula Owens Geography teaching resource Primary Digimap for Schools Geography Resources Where do I live Level Context Location Primary Locating own home address
DATA SCIENCE SIMPLIFIED USING ARCGIS API FOR PYTHON
 DATA SCIENCE SIMPLIFIED USING ARCGIS API FOR PYTHON LEAD CONSULTANT, INFOSYS LIMITED SEZ Survey No. 41 (pt) 50 (pt), Singapore Township PO, Ghatkesar Mandal, Hyderabad, Telengana 500088 Word Limit of the
Portal for ArcGIS: An Introduction. Catherine Hynes and Derek Law
 Portal for ArcGIS: An Introduction Catherine Hynes and Derek Law Agenda Web GIS pattern Product overview Installation and deployment Configuration options Security options and groups Portal for ArcGIS
SOUTH COAST COASTAL RECREATION METHODS
 SOUTH COAST COASTAL RECREATION METHODS A customized, web-based survey instrument, which utilizes Point 97 s Viewpoint survey and mapping technology, was used to collect spatially explicit data on coastal
Introduction to Google Mapping Tools
 Introduction to Google Mapping Tools Google s Mapping Tools Explore geographic data. Organize your own geographic data. Visualize complex data. Share your data with the world. Tell your story and educate
Institutional Research with Public Data and Open Source Software
 2017 Institutional Research with Public Data and Open Source Software DUE1304591, 1644409, 1700496 Opinions expressed are those of the authors and not necessarily those of the National Science Foundation.
Learning ArcGIS: Introduction to ArcCatalog 10.1
 Learning ArcGIS: Introduction to ArcCatalog 10.1 Estimated Time: 1 Hour Information systems help us to manage what we know by making it easier to organize, access, manipulate, and apply knowledge to the
Social Vulnerability Index. Susan L. Cutter Department of Geography, University of South Carolina
 Social Vulnerability Index Susan L. Cutter Department of Geography, University of South Carolina scutter@sc.edu Great Lakes and St. Lawrence Cities Initiative Webinar December 3, 2014 Vulnerability The
Lecture 9: Reference Maps & Aerial Photography
 Lecture 9: Reference Maps & Aerial Photography I. Overview of Reference and Topographic Maps There are two basic types of maps? Reference Maps - General purpose maps & Thematic Maps - maps made for a specific
Introduction to ArcGIS 10.2
 Introduction to ArcGIS 10.2 Francisco Olivera, Ph.D., P.E. Srikanth Koka Lauren Walker Aishwarya Vijaykumar Keri Clary Department of Civil Engineering April 21, 2014 Contents Brief Overview of ArcGIS 10.2...
emerge Network: CERC Survey Survey Sampling Data Preparation
 emerge Network: CERC Survey Survey Sampling Data Preparation Overview The entire patient population does not use inpatient and outpatient clinic services at the same rate, nor are racial and ethnic subpopulations
MAKING PLANNING LOCAL
 Georgia Social Vulnerability Index 2010 Atlas MAKING PLANNING LOCAL VULNERABLE & AT-RISK POPULATIONS DATA FOR JURISDICTIONS AT THE CENSUS TRACT LEVEL Public Health Districts Regional Coordinating Hospital
Accessing and Using Indiana Traffic Data
 Accessing and Using Indiana Traffic Data Purdue Road School March 6, 2013 Presented by: Gregory Katter, PE Asset Planning Indiana Traffic Data 1. Overview of Traffic Data Collection Program 2. Accessing
Using GIS to Explore the Relationship between Socioeconomic Status and Demographic Variables and Crime in Pittsburgh, Pennsylvania
 Using GIS to Explore the Relationship between Socioeconomic Status and Demographic Variables and Crime in Pittsburgh, Pennsylvania Stephen E. Mitchell Department of Resource Analysis, Saint Mary s University
BROOKINGS May
 Appendix 1. Technical Methodology This study combines detailed data on transit systems, demographics, and employment to determine the accessibility of jobs via transit within and across the country s 100
Measuring ph with Smart Cuvettes
 1 Measuring ph with Smart Cuvettes Hardware Setup for ph Measurements ph is measured in Absorbance mode. Configure your spectroscopy components for Absorbance measurements. Sample Absorbance setups for