Speakers: Jeff Price, Federal Transit Administration Linda Young, Center for Neighborhood Technology Sofia Becker, Center for Neighborhood Technology
|
|
|
- Dylan Gibson
- 5 years ago
- Views:
Transcription


1 Speakers: Jeff Price, Federal Transit Administration Linda Young, Center for Neighborhood Technology Sofia Becker, Center for Neighborhood Technology Peter Haas, Center for Neighborhood Technology Craig Sklenar, City of Evanston, IL


2 National TOD Database


3 CTOD Partnership Dedicated to providing best practices, research and tools to support market-based transit-oriented development
4 Why a TOD Database? Revealing the value of transit requires data from many sources Need a tool that allows quick warehousing of data for the purpose of creating new knowledge and understanding Existing networks weren t dedicated to producing the tool

5 Planning Tool for TOD History of CTOD Database Limited information at the transit area Initially funded by FTA (2005) then HUD & Surdna Tool to measure & project transit demand Identifies existing & potential TOD markets & their benefits

6 Putting the TOD Database to Work Map-based website Goal: Accelerate practice & commitment to high performance TOD Make data easily accessible to practitioners
 Source: 2003 National Transit Atlas")

7 CTOD TOD Database (Total = 4,609 Transit Stations) Source: 2003 National Transit Atlas Database, Transit Agencies, Federal Transit Administration, CNT (Stations as of December, 2007)
8 Spans 3,776 Existing Stations Across 7 Service Types Existing Stations Service Type Service Type Monorail People Mover BRT Light Rail Trolley/StreetCar/Cable Car Commuter Rail RRT Stations Stations
9 User Friendly Features One Stop Shop - Over 40,000 characteristics for 4,609 stations Data on 3 levels: Transit Zone (½ and ¼ mile radius buffer around each station) Transit Shed (accounts for overlap between Transit Zones) Transit Region Presented in standard and custom report formats Displayed on a map-based website Can be downloaded in Microsoft Word table or Excel spreadsheet User Guide Barrio Logan, San Diego, CA


10 Data at a Neighborhood Level Operates on GIS Platform Drills down to the neighborhood using census tracts, block groups and blocks Aggregate the data to transit geographies Census Boundaries don t align perfectly with Transit Zones, particularly Census Tracts Census Block Groups offer finer detail Census Blocks allow us to really focus on the detailed characteristics of a neighborhood
11 Data from Census 2000 Summary File 1 Housing units, occupancy status, tenure, household size, race/ethnicity, gender Summary File 3 Income, median value of owner occupied housing, gross rent, vacancy status, vehicle ownership, mode to work, travel time to work Census Transportation Planning Package (CTPP) Place of residence/work, and origin/destination Who Lives Here Local Social - Economics ½ Mile Mile Transit System ½ Mile Entire Transit Transit Metro Shed Line Shed Region Zone Who Works Here
12 Local Employment Dynamics (LED) Joint effort US Census and Bureau of Labor Statistics Residence area characteristics Count of workers by sector, quarterly earnings, worker age, median distance traveled to work Work area characteristics Count of workers where they work by sector Median commute distances Derived from origin and destination data Who lives here (workers)? ½ Mile Transit ½ Mile Line Shed Entire Transit Transit Metro System Region Zone Shed Who works here? How far do workers travel?
13 Derived Statistics Walkability (block size) Derived from census Tiger files Mode Split % For commuters from CTPP Housing and Transportation Affordability Using CNT s H+T Affordability Index Is the neighborhood walkable? Mile ½ Mile Transit Transit ½ Mile System Line Shed Entire Transit Metro Shed Region Zone Is the neighborhood affordable? How do commuters get here?

14 Housing +Transportation Affordability Index A new standard of affordability

15 Standard Reports

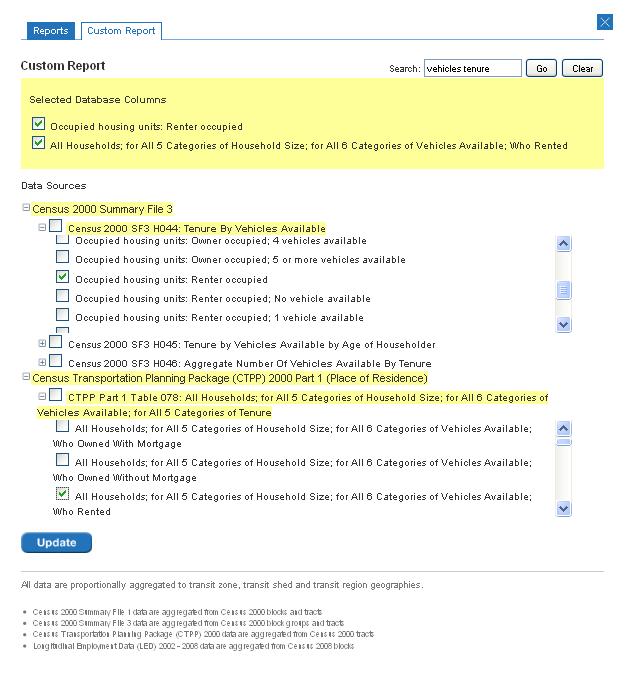
16 Build Custom Reports


17 Download Data Full Report View Download data to Microsoft Excel or Word Print map and data


18 Using the Database for Economic Development to Create Sustainable & Livable Communities Pearl District, Portland, OR San Diego Light Rail Station EPA Smart Growth PDX Museum South Safeway 7 Streetcar EPA Smart Growth Portland, OR

19 Planners and Developers Identifying Underutilized TOD Areas

20 Planners and Developers Assessing Local Retail Market Potential

21 Transportation Planners Existing transit network service Transit access issues Affordable housing Minority Low-income Elderly Disabled persons Pasadena light rail del mar station EPA Smart Growth

22 Transportation Planners Justifying Reduced Parking in TOD Areas Los Angeles Parking Study Planning for Demand

23 MPOs/Regional Councils Consolidated land use plans Transportation plans Priority development areas Potential station characteristics

24 Users of the TOD Database
 Select datasets TBD South Lake Union Trolley in Seattle EPA Smart")
25 Future Updates - Data American Community Survey 2010 Census LED (ongoing) Select datasets TBD South Lake Union Trolley in Seattle EPA Smart Growth
26 Future Updates - Stations Add planned stations Entered the New Starts process or have a dedicated funding source Add proposed stations Local planning process has determined station locations Station locations will be available for download
27 CTOD Contacts Linda Young Peter Haas Sofia Becker
Railvolution 2010 Analytical Tools to Support TOD Success Portland OR October 20, 2010 Scott Bernstein & Linda Young, Center for Neighborhood
 National TOD Database Railvolution 2010 Analytical Tools to Support TOD Success Portland OR October 20, 2010 Scott Bernstein & Linda Young, Center for Neighborhood Technology What is the H+T Affordability
Orien Ori t en a t tion a Webi W nar: ebi CPD Maps 2
 Orientation Webinar: CPD Maps 2 Agenda 1. Background - econ Planning Suite 2. Expanded Planning Data 3. CPD Maps Overview 4. Demonstration Guide Me Wizard Map Selection Identify Tool Printing and Saving
Geospatial Analysis of Job-Housing Mismatch Using ArcGIS and Python
 Geospatial Analysis of Job-Housing Mismatch Using ArcGIS and Python 2016 ESRI User Conference June 29, 2016 San Diego, CA Jung Seo, Frank Wen, Simon Choi and Tom Vo, Research & Analysis Southern California
GIS Analysis of Crenshaw/LAX Line
 PDD 631 Geographic Information Systems for Public Policy, Planning & Development GIS Analysis of Crenshaw/LAX Line Biying Zhao 6679361256 Professor Barry Waite and Bonnie Shrewsbury May 12 th, 2015 Introduction
Westside Extension Los Angeles, California
 Westside Extension Los Angeles, California Rail~Volution 2010 Portland, Oregon Monica Villalobos AECOM History of Westside Suburban Growth in the Westside (1920 1970 s) LA Centers Concept + Employment
Spatial and Socioeconomic Analysis of Commuting Patterns in Southern California Using LODES, CTPP, and ACS PUMS
 Spatial and Socioeconomic Analysis of Commuting Patterns in Southern California Using LODES, CTPP, and ACS PUMS Census for Transportation Planning Subcommittee meeting TRB 95th Annual Meeting January 11,
Data Matrix User Guide
 Data Matrix User Guide 1. Introduction The 2017 Data Matrix is designed to support the 2017 iteration of the Regional Skills Assessments (RSAs) in Scotland. The RSAs align with the Regional Outcome Agreement
Spatiotemporal Analysis of Commuting Patterns in Southern California Using ACS PUMS, CTPP and LODES
 Spatiotemporal Analysis of Commuting Patterns in Southern California Using ACS PUMS, CTPP and LODES 2017 ACS Data Users Conference May 11-12, 2017 Alexandria, VA Jung Seo, Tom Vo, Frank Wen and Simon Choi
The econ Planning Suite: CPD Maps and the Con Plan in IDIS for Consortia Grantees Session 1
 The econ Planning Suite: CPD Maps and the Con Plan in IDIS for Consortia Grantees Session 1 1 Training Objectives Use CPD Maps to analyze, assess, and compare levels of need in your community Use IDIS
Spatiotemporal Analysis of Commuting Patterns: Using ArcGIS and Big Data
 Spatiotemporal Analysis of Commuting Patterns: Using ArcGIS and Big Data 2017 ESRI User Conference July 13, 2017 San Diego, VA Jung Seo, Tom Vo, Frank Wen and Simon Choi Research & Analysis Southern California
Environmental Analysis, Chapter 4 Consequences, and Mitigation
 Environmental Analysis, Chapter 4 4.17 Environmental Justice This section summarizes the potential impacts described in Chapter 3, Transportation Impacts and Mitigation, and other sections of Chapter 4,
FHWA Planning Data Resources: Census Data Planning Products (CTPP) HEPGIS Interactive Mapping Portal
 HEPGIS Interactive Mapping Portal") FHWA Planning Data Resources: Census Data Planning Products (CTPP) HEPGIS Interactive Mapping Portal Jeremy Raw, P.E. FHWA, Office of Planning, Systems Planning and Analysis August 2017 Outline Census
FHWA Planning Data Resources: Census Data Planning Products (CTPP) HEPGIS Interactive Mapping Portal Jeremy Raw, P.E. FHWA, Office of Planning, Systems Planning and Analysis August 2017 Outline Census
INSIDE. Metric Descriptions by Topic Area. Data Sources and Methodology by Topic Area. Technical Appendix
 As part of the Chicago Neighborhoods 2015 (CN2015) project, the Institute for Housing Studies at DePaul University collected data and built metrics to help The Chicago Community Trust and the City of Chicago
Developing Built Environment Indicators for Urban Oregon. Dan Rubado, MPH EPHT Epidemiologist Oregon Public Health Division
 Developing Built Environment Indicators for Urban Oregon Dan Rubado, MPH EPHT Epidemiologist Oregon Public Health Division What is the built environment? The built environment encompasses spaces and places
Economic and Social Urban Indicators: A Spatial Decision Support System for Chicago Area Transportation Planning
 Economic and Social Urban Indicators: A Spatial Decision Support System for Chicago Area Transportation Planning Piyushimita Thakuriah (Vonu), P.S. Sriraj, Paul Metaxatos, Inshu Minocha & Tanushri Swarup
PALS: Neighborhood Identification, City of Frederick, Maryland. David Boston Razia Choudhry Chris Davis Under the supervision of Chao Liu
 PALS: Neighborhood Identification, City of Frederick, Maryland David Boston Razia Choudhry Chris Davis Under the supervision of Chao Liu University of Maryland School of Architecture, Planning & Preservation
Managing Growth: Integrating Land Use & Transportation Planning
 Managing Growth: Integrating Land Use & Transportation Planning Metro Vancouver Sustainability Community Breakfast Andrew Curran Manager, Strategy June 12, 2013 2 Integrating Land Use & Transportation
Transit Service Gap Technical Documentation
 Transit Service Gap Technical Documentation Introduction This document is an accompaniment to the AllTransit TM transit gap methods document. It is a detailed explanation of the process used to develop
Regional Performance Measures
 G Performance Measures Regional Performance Measures Introduction This appendix highlights the performance of the MTP/SCS for 2035. The performance of the Revenue Constrained network also is compared to
BROOKINGS May
 Appendix 1. Technical Methodology This study combines detailed data on transit systems, demographics, and employment to determine the accessibility of jobs via transit within and across the country s 100
Mapping Accessibility Over Time
 Journal of Maps, 2006, 76-87 Mapping Accessibility Over Time AHMED EL-GENEIDY and DAVID LEVINSON University of Minnesota, 500 Pillsbury Drive S.E., Minneapolis, MN 55455, USA; geneidy@umn.edu (Received
The Church Demographic Specialists
 The Church Demographic Specialists Easy-to-Use Features Map-driven, Web-based Software An Integrated Suite of Information and Query Tools Providing An Insightful Window into the Communities You Serve Key
Regional Performance Measures
 G Performance Measures Regional Performance Measures Introduction This appendix highlights the performance of the MTP/SCS for 2035. The performance of the Revenue Constrained network also is compared to
Analyzing the Market Share of Commuter Rail Stations using LEHD Data
 Analyzing the Market Share of Commuter Rail Stations using LEHD Data Using Census Data for Transportation Applications Conference, Irvine, CA October 26, 2011 1. What is the size of Metrolink s commute
Performance-Based Transit-Oriented Development Typology Guidebook
 Performance-Based Transit-Oriented Development Typology Guidebook Lake Michigan Lake County, IL McHenry County I-90 Cook County Evanston I-355 Oak Park I-88 Dupage County I-294 I-55 Kendall County Gary,
Visualization of Commuter Flow Using CTPP Data and GIS
 Visualization of Commuter Flow Using CTPP Data and GIS Research & Analysis Department Southern California Association of Governments 2015 ESRI User Conference l July 23, 2015 l San Diego, CA Jung Seo,
2010 Census Data Release and Current Geographic Programs. Michaellyn Garcia Geographer Seattle Regional Census Center
 2010 Census Data Release and Current Geographic Programs Michaellyn Garcia Geographer Seattle Regional Census Center 2010 Center of Population Located approximately 2.7 miles northeast of Plato, Missouri
Using American Factfinder
 Using American Factfinder What is American Factfinder? American Factfinder is a search engine that provides access to the population, housing and economic data collected by the U.S. Census Bureau. It can
Visualization of Origin- Destination Commuter Flow Using CTPP Data and ArcGIS
 Visualization of Origin- Destination Commuter Flow Using CTPP Data and ArcGIS Research & Analysis Department Southern California Association of Governments 2015 ESRI User Conference l July 23, 2015 l San
Understanding Land Use and Walk Behavior in Utah
 Understanding Land Use and Walk Behavior in Utah 15 th TRB National Transportation Planning Applications Conference Callie New GIS Analyst + Planner STUDY AREA STUDY AREA 11 statistical areas (2010 census)
Committee Meeting November 6, 2018
 Committee Meeting November 6, 2018 Agenda Where we are in the process Land Use Plan Transportation Element Housing & Neighborhoods Elements Next Steps Schedule November 6: Plan Elements December: Plan
Census Transportation Planning Products (CTPP)
") Census Transportation Planning Products (CTPP) Penelope Weinberger CTPP Program Manager - AASHTO September 15, 2010 1 What is the CTPP Program Today? The CTPP is an umbrella program of data products, custom
Census Transportation Planning Products (CTPP) Penelope Weinberger CTPP Program Manager - AASHTO September 15, 2010 1 What is the CTPP Program Today? The CTPP is an umbrella program of data products, custom
Spatial Organization of Data and Data Extraction from Maptitude
 Spatial Organization of Data and Data Extraction from Maptitude N. P. Taliceo Geospatial Information Sciences The University of Texas at Dallas UT Dallas GIS Workshop Richardson, TX March 30 31, 2018 1/
Foreword. Vision and Strategy
 GREATER MANCHESTER SPATIAL FRAMEWORK Friends of Walkden Station Consultation Response January 2017 Foreword Friends of Walkden Station are a group of dedicated volunteers seeking to raise the status and
Demographic Data in ArcGIS. Harry J. Moore IV
 Demographic Data in ArcGIS Harry J. Moore IV Outline What is demographic data? Esri Demographic data - Real world examples with GIS - Redistricting - Emergency Preparedness - Economic Development Next
Developing Innovation Village, Baltimore
 Developing Innovation Village, Baltimore Rick Jenarine, Ridhima Mehrotra, Andrew Seguin, Claire Warner Under the supervision of Professor Chao Liu URSP688L: Planning Technologies The University of Maryland
Demographic Data. How to get it and how to use it (with caution) By Amber Keller
 By Amber Keller") Demographic Data How to get it and how to use it (with caution) By Amber Keller 101 Where does it come from? o The American Community Survey o Socio-economic characteristics of a population o Administered
Demographic Data How to get it and how to use it (with caution) By Amber Keller 101 Where does it come from? o The American Community Survey o Socio-economic characteristics of a population o Administered
Transit Time Shed Analyzing Accessibility to Employment and Services
 Transit Time Shed Analyzing Accessibility to Employment and Services presented by Ammar Naji, Liz Thompson and Abdulnaser Arafat Shimberg Center for Housing Studies at the University of Florida www.shimberg.ufl.edu
Massachusetts Institute of Technology Department of Urban Studies and Planning
 Massachusetts Institute of Technology Department of Urban Studies and Planning 11.204: Planning, Communications & Digital Media Fall 2002 Lecture 6: Tools for Transforming Data to Action Lorlene Hoyt October
Administrative Data Research Facility Linked HMDA and ACS Database
 University of Pennsylvania ScholarlyCommons 2017 ADRF Network Research Conference Presentations ADRF Network Research Conference Presentations 11-2017 Administrative Data Research Facility Linked HMDA
Employment Decentralization and Commuting in U.S. Metropolitan Areas. Symposium on the Work of Leon Moses
 Employment Decentralization and Commuting in U.S. Metropolitan Areas Alex Anas Professor of Economics University at Buffalo Symposium on the Work of Leon Moses February 7, 2014 9:30-11:15am, and 2:30-4:30pm
Geodatabase for Sustainable Urban Development. Presented By Rhonda Maronn Maurice Johns Daniel Ashney Jack Anliker
 Geodatabase for Sustainable Urban Development Presented By Rhonda Maronn Maurice Johns Daniel Ashney Jack Anliker Objective Build a Geodatabase that will enable urban planners to create and assess the
Neighborhood Locations and Amenities
 University of Maryland School of Architecture, Planning and Preservation Fall, 2014 Neighborhood Locations and Amenities Authors: Cole Greene Jacob Johnson Maha Tariq Under the Supervision of: Dr. Chao
Get Over, and Beyond, the Half-Mile Circle (for Some Transit Options)
") Get Over, and Beyond, the Half-Mile Circle (for Some Transit Options) Arthur C. Nelson, Ph.D., FAICP Associate Dean for Research & Discovery College of Architecture, Planning and Landscape Architecture
Get Over, and Beyond, the Half-Mile Circle (for Some Transit Options) Arthur C. Nelson, Ph.D., FAICP Associate Dean for Research & Discovery College of Architecture, Planning and Landscape Architecture
Density and Walkable Communities
 Density and Walkable Communities Reid Ewing Professor & Chair City and Metropolitan Planning University of Utah ewing@arch.utah.edu Department of City & Metropolitan Planning, University of Utah MRC Research
The Role of Transitways in Our Region s Economic Competitiveness. The 23rd CTS Annual Research Conference St. Paul, MN May 23, 2012
 The Role of Transitways in Our Region s Economic Competitiveness The 23rd CTS Annual Research Conference St. Paul, MN May 23, 2012 1 2 Twin Cities Competitive Clusters 3 Competitive Clusters interconnected
Understanding China Census Data with GIS By Shuming Bao and Susan Haynie China Data Center, University of Michigan
 Understanding China Census Data with GIS By Shuming Bao and Susan Haynie China Data Center, University of Michigan The Census data for China provides comprehensive demographic and business information
An online data and consulting resource of THE UNIVERSITY OF TOLEDO THE JACK FORD URBAN AFFAIRS CENTER
 An online data and consulting resource of THE JACK FORD URBAN AFFAIRS CENTER THE CENTER FOR GEOGRAPHIC INFORMATION SCIENCE AND APPLIED GEOGRAPHICS DEPARTMENT OF GEOGRAPHY AND PLANNING THE UNIVERSITY OF
Council Workshop on Neighbourhoods Thursday, October 4 th, :00 to 4:00 p.m. Burlington Performing Arts Centre
 Council Workshop on Neighbourhoods Thursday, October 4 th, 2012 1:00 to 4:00 p.m. Burlington Performing Arts Centre Agenda Introductions Warm-Up Exercise Presentation Exercise Neighbourhood Planning Break
Local Economic Activity Around Rapid Transit Stations
 Local Economic Activity Around Rapid Transit Stations The Case of Chicago s Orange Line Julie Cooper, MPP 2014 Harris School of Public Policy Transport Chicago June 6, 2014 Motivation Impacts of transit
THE FUTURE OF FORECASTING AT METROPOLITAN COUNCIL. CTS Research Conference May 23, 2012
 THE FUTURE OF FORECASTING AT METROPOLITAN COUNCIL CTS Research Conference May 23, 2012 Metropolitan Council forecasts Regional planning agency and MPO for Twin Cities metropolitan area Operates regional
Guide to the Data-Driven Planning Toolkit in CPD Maps
 The econ Planning Suite: Guide to the Data-Driven Planning Toolkit in CPD Maps Version: April 2014 TABLE OF CONTENTS Introduction... 1 The Data-Driven Planning Toolkit... 3 Overview of the Basic Model...
Opportunities to Strengthen Transit-Oriented Development through the New Starts Process
 Opportunities to Strengthen Transit-Oriented Development through the New Starts Process Congressional Testimony of Shelley Poticha, President Reconnecting America Presented before the Subcommittee on Highways
Developing and Validating Regional Travel Forecasting Models with CTPP Data: MAG Experience
 CTPP Webinar and Discussion Thursday, July 17, 1-3pm EDT Developing and Validating Regional Travel Forecasting Models with CTPP Data: MAG Experience Kyunghwi Jeon, MAG Petya Maneva, MAG Vladimir Livshits,
HORIZON 2030: Land Use & Transportation November 2005
 PROJECTS Land Use An important component of the Horizon transportation planning process involved reviewing the area s comprehensive land use plans to ensure consistency between them and the longrange transportation
Jobs-Housing Fit: Linking Housing Affordability and Local Wages
 Jobs-Housing Fit: Linking Housing Affordability and Local Wages Alex Karner, PhD Assistant Professor School of City and Regional Planning Georgia Institute of Technology Chris Benner, PhD Dorothy E. Everett
Urban Planning Word Search Level 1
 Urban Planning Word Search Level 1 B C P U E C O S Y S T E M P A R E U O E U R B A N P L A N N E R T N S T D H E C O U N T Y G E R E R D W R E N I C I T Y C O U N C I L A A A S U G G C I L A G P R I R
Section 2. Indiana Geographic Information Council: Strategic Plan
 Section 2. Indiana Geographic Information Council: Strategic Plan Introduction A geographic information system (GIS) is an automated tool that allows the collection, modification, storage, analysis, and
A User s Guide to the Federal Statistical Research Data Centers
 A User s Guide to the Federal Statistical Research Data Centers Mark Roberts Professor of Economics and Director PSU FSRDC September 2016 M. Roberts () RDC User s Guide September 2016 1 / 14 Outline Introduction
Impact of Metropolitan-level Built Environment on Travel Behavior
 Impact of Metropolitan-level Built Environment on Travel Behavior Arefeh Nasri 1 and Lei Zhang 2,* 1. Graduate Research Assistant; 2. Assistant Professor (*Corresponding Author) Department of Civil and
How GIS based Visualizations Support Land Use and Transportation Modeling
 How GIS based Visualizations Support Land Use and Transportation Modeling ESRI International Users Conference San Diego, CA - July 23, 2015 Prepared by: Troy Hightower Introduction This presentation will
Are You Maximizing The Value Of All Your Data?
 Are You Maximizing The Value Of All Your Data? Using The SAS Bridge for ESRI With ArcGIS Business Analyst In A Retail Market Analysis SAS and ESRI: Bringing GIS Mapping and SAS Data Together Presented
The Attractive Side of Corpus Christi: A Study of the City s Downtown Economic Growth
 The Attractive Side of Corpus Christi: A Study of the City s Downtown Economic Growth GISC PROJECT DR. LUCY HUANG SPRING 2012 DIONNE BRYANT Introduction Background As a GIS Intern working with the City
Figure 8.2a Variation of suburban character, transit access and pedestrian accessibility by TAZ label in the study area
 Figure 8.2a Variation of suburban character, transit access and pedestrian accessibility by TAZ label in the study area Figure 8.2b Variation of suburban character, commercial residential balance and mix
Frequently Asked Questions
 What is the Regional Transit Engagement Series? As one of the fastest growing regions in the country, there is recognition that long-term transit planning efforts should be accelerated if we are to remain
CALOTS Upgrade for Performance Monitoring
 CALOTS Upgrade for Performance Monitoring A project of the Southern California Association of Governments supported by the UCLA Lewis Center for Regional Policy Studies Agenda 1. Revisit Project Overview
John Thomas & Lori Zeller US Environmental Protection Agency Office of Sustainable Communities. Rich Kuzmyak & Alex Bell Renaissance Planning Group
 Transportation Research Board ADD30 - Transportation and Land Development Committee Methods to Better Account for Land Use in Planning Multimodal Transportation Systems and Sustainable Communities Moderator:
The Spatial Structure of Cities: International Examples of the Interaction of Government, Topography and Markets
 Module 2: Spatial Analysis and Urban Land Planning The Spatial Structure of Cities: International Examples of the Interaction of Government, Topography and Markets Alain Bertaud Urbanist Summary What are
Can Public Transport Infrastructure Relieve Spatial Mismatch?
 Can Public Transport Infrastructure Relieve Spatial Mismatch? Evidence from Recent Light Rail Extensions Kilian Heilmann University of California San Diego April 20, 2015 Motivation Paradox: Even though
2040 MTP and CTP Socioeconomic Data
 SE Data 6-1 24 MTP and CTP Socioeconomic Data Purpose of Socioeconomic Data The socioeconomic data (SE Data) shows the location of the population and employment, median household income and other demographic
GIS Lecture 5: Spatial Data
 GIS Lecture 5: Spatial Data GIS 1 Outline Vector Data Formats Raster Data Formats Map Projections Coordinate Systems US Census geographic files US Census data files GIS Data Sources GIS 2 Vector Data Formats
Mind the Gap: Transit Need Analysis
 Mind the Gap: Transit Need Analysis Introduction Transit Propensity a measure of demographics that indicate the propensity for people in a given area to use transit GIS: heat maps Emphasizes the transit
Spatial Variation in Local Road Pedestrian and Bicycle Crashes
 2015 Esri International User Conference July 20 24, 2015 San Diego, California Spatial Variation in Local Road Pedestrian and Bicycle Crashes Musinguzi, Abram, Graduate Research Assistant Chimba,Deo, PhD.,
Leveraging Urban Mobility Strategies to Improve Accessibility and Productivity of Cities
 Leveraging Urban Mobility Strategies to Improve Accessibility and Productivity of Cities Aiga Stokenberga World Bank GPSC African Regional Workshop May 15, 2018 Roadmap 1. Africa s urbanization and its
SPATIAL ANALYSIS OF URBAN BUILT ENVIRONMENTS AND VEHICLE TRANSIT BEHAVIOR. Daniel Currie Eisman
 SPATIAL ANALYSIS OF URBAN BUILT ENVIRONMENTS AND VEHICLE TRANSIT BEHAVIOR by Daniel Currie Eisman A Thesis Presented to the FACULTY OF THE USC GRADUATE SCHOOL UNIVERSITY OF SOUTHERN CALIFORNIA In Partial
GIS-Based Analysis of the Commuting Behavior and the Relationship between Commuting and Urban Form
 GIS-Based Analysis of the Commuting Behavior and the Relationship between Commuting and Urban Form 1. Abstract A prevailing view in the commuting is that commuting would reconstruct the urban form. By
A Comprehensive Method for Identifying Optimal Areas for Supermarket Development. TRF Policy Solutions April 28, 2011
 A Comprehensive Method for Identifying Optimal Areas for Supermarket Development TRF Policy Solutions April 28, 2011 Profile of TRF The Reinvestment Fund builds wealth and opportunity for lowwealth communities
King City URA 6D Concept Plan
 King City URA 6D Concept Plan King City s Evolution Among the fastest growing cities 2000 Census 1,949 2010 Census 3,111 60% increase 2016 Census estimate 3,817 23% increase Average annual rate 4.3% Surpassing
GIS Geographical Information Systems. GIS Management
 GIS Geographical Information Systems GIS Management Difficulties on establishing a GIS Funding GIS Determining Project Standards Data Gathering Map Development Recruiting GIS Professionals Educating Staff
APPENDIX C-3 Equitable Target Areas (ETA) Technical Analysis Methodology
 Technical Analysis Methodology") APPENDIX C-3 Equitable Target Areas (ETA) Technical Analysis Methodology Contents Introduction... 1 ETA Index Methodology... 1 ETA Index Development... 1 Other EJ Measures... 4 The Limited English Proficiency
APPENDIX C-3 Equitable Target Areas (ETA) Technical Analysis Methodology Contents Introduction... 1 ETA Index Methodology... 1 ETA Index Development... 1 Other EJ Measures... 4 The Limited English Proficiency
Changes in the Spatial Distribution of Mobile Source Emissions due to the Interactions between Land-use and Regional Transportation Systems
 Changes in the Spatial Distribution of Mobile Source Emissions due to the Interactions between Land-use and Regional Transportation Systems A Framework for Analysis Urban Transportation Center University
LEO Catchment Profile (LCP) Key Data for Enterprise Strategy
 Key Data for Enterprise Strategy") Laois...Portarlington LEO Catchment Profile (LCP) Key Data for Enterprise Strategy Laois Local Enterprise Office Address: Business Support Unit, County Hall, Portlaoise, County Laois Web: https://www.localenterprise.ie/laois/
Laois...Portarlington LEO Catchment Profile (LCP) Key Data for Enterprise Strategy Laois Local Enterprise Office Address: Business Support Unit, County Hall, Portlaoise, County Laois Web: https://www.localenterprise.ie/laois/
The Elusive Connection between Density and Transit Use
 The Elusive Connection between Density and Transit Use Abstract: The connection between density and transportation is heralded by planners, yet results are often elusive. This paper analyzes two regions,
COMMUNITY SERVICE AREA
 INSTITUTE FOR TRIBAL ENVIRONMENTAL PROFESSIONALS Tribal Waste and Response Assistance Program (TWRAP) Developing and Implementing a Tribal Integrated Solid Waste Management Plan April 12-14, 2016 Palm
MULTIPLE CHOICE. Choose the one alternative that best completes the statement or answers the question.
 AP Test 13 Review Name MULTIPLE CHOICE. Choose the one alternative that best completes the statement or answers the question. 1) Compared to the United States, poor families in European cities are more
Service Area Analysis of Portland's METRO Bus System. Andy Smith-Petersen, University of Southern Maine -
 Andy Smith-Petersen, University of Southern Maine - andysp@usm.maine.edu METRO Background 8 routes serving Portland, South Portland, Falmouth and Westbrook 100,000+ passengers/month, +11% 1997-2005 (GPCOG/METRO,
Advancing Urban Models in the 21 st Century. Jeff Tayman Lecturer, Dept. of Economics University of California, San Diego
 Advancing Urban Models in the 21 st Century Jeff Tayman Lecturer, Dept. of Economics University of California, San Diego 1 Regional Decision System Better tools Better data Better access Better Decisions
StanCOG Transportation Model Program. General Summary
 StanCOG Transportation Model Program Adopted By the StanCOG Policy Board March 17, 2010 What are Transportation Models? General Summary Transportation Models are technical planning and decision support
Compact guides GISCO. Geographic information system of the Commission
 Compact guides GISCO Geographic information system of the Commission What is GISCO? GISCO, the Geographic Information System of the COmmission, is a permanent service of Eurostat that fulfils the requirements
Brian J. Morton Center for Urban and Regional Studies University of North Carolina - Chapel Hill June 8, 2010
 Brian J. Morton Center for Urban and Regional Studies University of North Carolina - Chapel Hill June 8, 2010 1. TRANUS Highway vehicle technology Trips Mode choice Link-level traffic volumes and average
Transit-Oriented Development. Christoffer Weckström
 Transit-Oriented Development Christoffer Weckström 31.10.2017 Outline Context of Transit-oriented Development Elements of Transit-oriented Development A short history of land use and transit integration
Assessing spatial distribution and variability of destinations in inner-city Sydney from travel diary and smartphone location data
 Assessing spatial distribution and variability of destinations in inner-city Sydney from travel diary and smartphone location data Richard B. Ellison 1, Adrian B. Ellison 1 and Stephen P. Greaves 1 1 Institute
Kitsap County 2016 Comprehensive Plan Update. Appendix A: Growth Estimates
 Kitsap County 2016 Comprehensive Plan Update Appendix A: Growth Estimates Appendix A 1 April 2016 Kitsap County 2016 Comprehensive Plan Update Appendix A: Growth Estimates Land Capacity Land capacity
Planning for Economic and Job Growth
 Planning for Economic and Job Growth Mayors Innovation Project Winter 2012 Meeting January 21, 2012 Mary Kay Leonard Initiative for a Competitive Inner City AGENDA The Evolving Model for Urban Economic
C) Discuss two factors that are contributing to the rapid geographical shifts in urbanization on a global scale.
 Discuss two factors that are contributing to the rapid geographical shifts in urbanization on a global scale.") AP Human Geography Unit VII. Cities and Urban Land Use Free Response Questions FRQ 1 Rapid urbanization in Least Developed Countries (LDCs) has many profound impacts for the world. Answer the following
AP Human Geography Unit VII. Cities and Urban Land Use Free Response Questions FRQ 1 Rapid urbanization in Least Developed Countries (LDCs) has many profound impacts for the world. Answer the following
Do TODs Make a Difference? NS Streetcar Line Portland, Oregon
 Portland State University PDXScholar Urban Studies and Planning Faculty Publications and Presentations Nohad A. Toulan School of Urban Studies and Planning 6-24-2014 Do TODs Make a Difference? NS Streetcar
Equity, Accessibility and Transit Use in large American cities
 Equity, Accessibility and Transit Use in large American cities Submitted: 1 August 2004 Word Count: 4600 + 1500 = 6100 Murtaza Haider, Ph.D. McGill University, School of Urban Planning 815 Sherbrooke St.
Initial Findings from Regional Initiatives Planning Enhancement Fair Housing & Equity Assessment
 NEW YORK AND CONNECTICUT SUSTAINABLE COMMUNITIES Initial Findings from Regional Initiatives Planning Enhancement Fair Housing & Equity Assessment July 30, 2013 White Plains Library Federal grant to improve
What are we like? Population characteristics from UK censuses. Justin Hayes & Richard Wiseman UK Data Service Census Support
 What are we like? Population characteristics from UK censuses Justin Hayes & Richard Wiseman UK Data Service Census Support Who are we? Richard Wiseman UK Data Service / Jisc Justin Hayes UK Data Service
Regional Snapshot Series: Transportation and Transit. Commuting and Places of Work in the Fraser Valley Regional District
 Regional Snapshot Series: Transportation and Transit Commuting and Places of Work in the Fraser Valley Regional District TABLE OF CONTENTS Complete Communities Daily Trips Live/Work Ratio Commuting Local