Mind the Gap: Transit Need Analysis
|
|
|
- Joel Gibbs
- 5 years ago
- Views:
Transcription


1 Mind the Gap: Transit Need Analysis
2 Introduction Transit Propensity a measure of demographics that indicate the propensity for people in a given area to use transit GIS: heat maps Emphasizes the transit dependent Travel Demand Model Flows projected origin-destination flows by mode and purpose Problem: How to expand transit propensity to capture choice riders in addition to dependent riders How to include generators in the mix How to combine transit propensity and travel demand model flows to analyze transit demand comprehensively
3 Develop a New Model Develop Transit Propensity Indexes that include: Transit-oriented population All commuters Places of work (generators) Non-work generators (retail, entertainment, schools ) Prioritize Origin-Destination Flows Link the appropriate index with the appropriate flow type Compare to existing transit system to identify gaps
4 Transit Index Four Indexes Weight categories according to local transit passenger surveys Gather data by block group from ACS and LEHD for service area Look at proportions, densities, and raw totals for inputs Simple rank/weight in excel, join to Census block group shapefile Transit-Oriented Population Population Age Households Income Vehicle Ownership Commuters Labor Force Commute Mode Work Jobs Non-Work Retail/ Restaurant Recreation Healthcare Education Government Disability
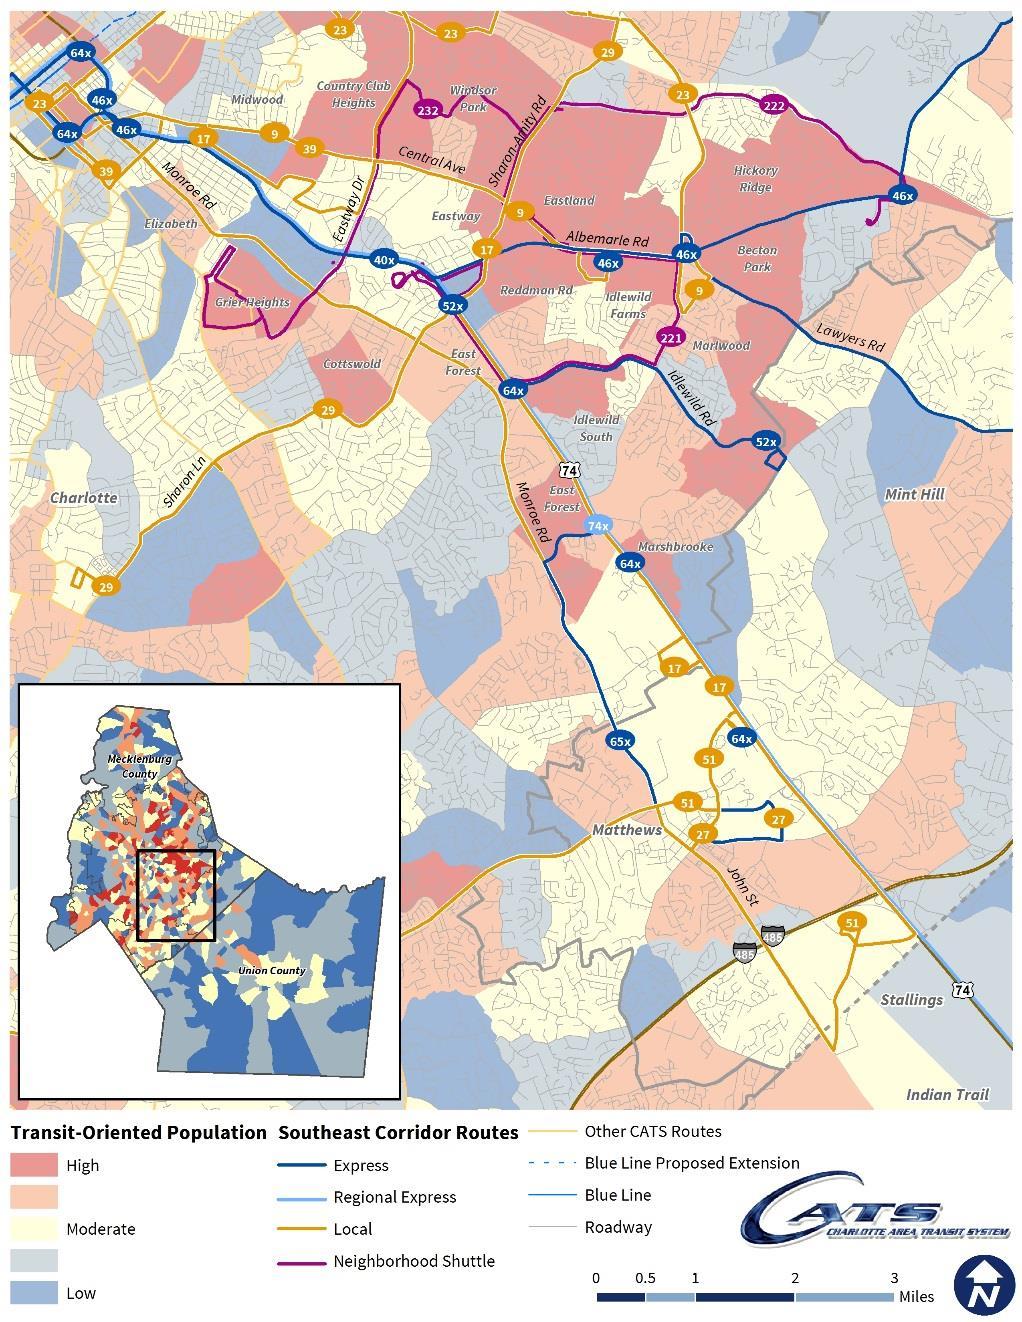

5 Transit-Oriented Pop./Commuter Indexes


6 Work/Non-Work Indexes
7 Travel Demand Model Flows Transportation Analysis Zones (TAZ) pairs with projected flows between them by mode and purpose TAZ typically close to census block group geography size Origin & destination TAZs Trip purpose_mode Join OTAZ and DTAZ coordinates from TAZ shapefile Concatenate OTAZ and DTAZ ID to create a new ID field OTAZ DTAZ hbw_all hbw_bus hbw_rail hbw_auto nhb_all nhb_bus nhb_rail nhb_auto hbo_all hbo_bus hbo_rail hbo_auto ox oy dx dy newid _ _ XY to Line function to create shapefile of flows Join spreadsheet to shapefile using the new ID you created (i.e. 100_210)
8 Model Flows Shapefile If TAZs are too small (too many flows), you can group them and pivot in excel beforehand
9 TAZ Grouping Example Build lookup Group TAZs into neighborhoods to reduce total Pivot by new neighborhood ID to get new totals TAZ Group 100 Midwood 101 Grier Heights 102 Elizabeth 103 Matthews New neighborhood ID Ogroup Dgroup hbw_all hbw_bus hbw_rail hbw_auto nhb_all nhb_bus nhb_rail nhb_auto hbo_all hbo_bus hbo_rail hbo_auto ox oy dx dy newid Midwood Matthews Midwood_Matthews Grier Heights East Forest Grier Heights_East Forest Elizabeth Eastland Matthews Hickory Ridge
10 Model Development Linking indexes to flows Peak Period Model: Combine commuter & work indexes into a peak index Use home-based work flows Can use all modes, or just transit Off-Peak Period Model: Combine transit-oriented & non-work indexes into an off-peak index Use sum of home-based other and non-home based flows All modes or just transit =max(!commuter!,!work!) =max(!tranor!,!nonwork!)
11 Models Peak Model: High flows connecting high peak index areas should have high quality, frequent transit service during peak periods Off-Peak Model: High flows connecting high off-peak index areas should have high quality, frequent service all day Overlap: High peak, high off-peak could have premium peak services (express, limited stop) in addition to frequent all-day service

12 Results
13 Use Typically do analysis as part of an existing conditions analysis for a Transit Development Plan or other transit corridor study Identify system gaps in both coverage and service levels No service but needs service Has peak service but needs all day service Has service but at an inadequate service level Used as a guide to service planning Needs to be justified against existing ridership patterns On/off by stop Overcrowding Productivity Transfers
14 Thank You! Contact: Adam Recchia, Senior Transportation Planner Foursquare Integrated Transportation Planning, Rockville, MD
Analyzing the Market Share of Commuter Rail Stations using LEHD Data
 Analyzing the Market Share of Commuter Rail Stations using LEHD Data Using Census Data for Transportation Applications Conference, Irvine, CA October 26, 2011 1. What is the size of Metrolink s commute
GIS Analysis of Crenshaw/LAX Line
 PDD 631 Geographic Information Systems for Public Policy, Planning & Development GIS Analysis of Crenshaw/LAX Line Biying Zhao 6679361256 Professor Barry Waite and Bonnie Shrewsbury May 12 th, 2015 Introduction
Speakers: Jeff Price, Federal Transit Administration Linda Young, Center for Neighborhood Technology Sofia Becker, Center for Neighborhood Technology
 Speakers: Jeff Price, Federal Transit Administration Linda Young, Center for Neighborhood Technology Sofia Becker, Center for Neighborhood Technology Peter Haas, Center for Neighborhood Technology Craig
BROOKINGS May
 Appendix 1. Technical Methodology This study combines detailed data on transit systems, demographics, and employment to determine the accessibility of jobs via transit within and across the country s 100
Local Economic Activity Around Rapid Transit Stations
 Local Economic Activity Around Rapid Transit Stations The Case of Chicago s Orange Line Julie Cooper, MPP 2014 Harris School of Public Policy Transport Chicago June 6, 2014 Motivation Impacts of transit
Figure 8.2a Variation of suburban character, transit access and pedestrian accessibility by TAZ label in the study area
 Figure 8.2a Variation of suburban character, transit access and pedestrian accessibility by TAZ label in the study area Figure 8.2b Variation of suburban character, commercial residential balance and mix
2040 MTP and CTP Socioeconomic Data
 SE Data 6-1 24 MTP and CTP Socioeconomic Data Purpose of Socioeconomic Data The socioeconomic data (SE Data) shows the location of the population and employment, median household income and other demographic
APPENDIX C-3 Equitable Target Areas (ETA) Technical Analysis Methodology
 Technical Analysis Methodology") APPENDIX C-3 Equitable Target Areas (ETA) Technical Analysis Methodology Contents Introduction... 1 ETA Index Methodology... 1 ETA Index Development... 1 Other EJ Measures... 4 The Limited English Proficiency
APPENDIX C-3 Equitable Target Areas (ETA) Technical Analysis Methodology Contents Introduction... 1 ETA Index Methodology... 1 ETA Index Development... 1 Other EJ Measures... 4 The Limited English Proficiency
Trip Generation Model Development for Albany
 Trip Generation Model Development for Albany Hui (Clare) Yu Department for Planning and Infrastructure Email: hui.yu@dpi.wa.gov.au and Peter Lawrence Department for Planning and Infrastructure Email: lawrence.peter@dpi.wa.gov.au
Typical information required from the data collection can be grouped into four categories, enumerated as below.
 Chapter 6 Data Collection 6.1 Overview The four-stage modeling, an important tool for forecasting future demand and performance of a transportation system, was developed for evaluating large-scale infrastructure
Developing the Transit Demand Index (TDI) Gregory Newmark, Regional Transportation Authority Transport Chicago Presentation July 25, 2012
 Gregory Newmark, Regional Transportation Authority Transport Chicago Presentation July 25, 2012") Developing the Transit Demand Index (TDI) Gregory Newmark, Regional Transportation Authority Transport Chicago Presentation July 25, 2012 Outline Present RTA methodology Transit Demand Index (TDI) Demonstrate
Developing the Transit Demand Index (TDI) Gregory Newmark, Regional Transportation Authority Transport Chicago Presentation July 25, 2012 Outline Present RTA methodology Transit Demand Index (TDI) Demonstrate
Land Use Advisory Committee. Updating the Transit Market Areas
 Land Use Advisory Committee Updating the Transit Market Areas March 20, 2014 Agenda Transit Market Areas Purpose of Transit Market Areas Transit Market Index Current Market Area boundaries Updating the
Data Collection. Lecture Notes in Transportation Systems Engineering. Prof. Tom V. Mathew. 1 Overview 1
 Data Collection Lecture Notes in Transportation Systems Engineering Prof. Tom V. Mathew Contents 1 Overview 1 2 Survey design 2 2.1 Information needed................................. 2 2.2 Study area.....................................
Identifying Inaccessible Areas with Potential to Enhance Transit Market
 Identifying Inaccessible Areas with Potential to Enhance Transit Market Srinivas S. Pulugurtha, Venkata Ramana Duddu, Rakesh Mora The University of North Carolina at Charlotte Abstract The focus of this
WOODRUFF ROAD CORRIDOR ORIGIN-DESTINATION ANALYSIS
 2018 WOODRUFF ROAD CORRIDOR ORIGIN-DESTINATION ANALYSIS Introduction Woodruff Road is the main road to and through the commercial area in Greenville, South Carolina. Businesses along the corridor have
Understanding Land Use and Walk Behavior in Utah
 Understanding Land Use and Walk Behavior in Utah 15 th TRB National Transportation Planning Applications Conference Callie New GIS Analyst + Planner STUDY AREA STUDY AREA 11 statistical areas (2010 census)
Developing Built Environment Indicators for Urban Oregon. Dan Rubado, MPH EPHT Epidemiologist Oregon Public Health Division
 Developing Built Environment Indicators for Urban Oregon Dan Rubado, MPH EPHT Epidemiologist Oregon Public Health Division What is the built environment? The built environment encompasses spaces and places
River North Multi-Modal Transit Analysis
 River North Multi-Modal Transit Analysis November 7, 2006 Dan Meyers, AICP URS Corporation 612-373-6446 / dan_meyers@urscorp.com River North Study Area Reasons for initiating the study Downtown areas north
FHWA Planning Data Resources: Census Data Planning Products (CTPP) HEPGIS Interactive Mapping Portal
 HEPGIS Interactive Mapping Portal") FHWA Planning Data Resources: Census Data Planning Products (CTPP) HEPGIS Interactive Mapping Portal Jeremy Raw, P.E. FHWA, Office of Planning, Systems Planning and Analysis August 2017 Outline Census
FHWA Planning Data Resources: Census Data Planning Products (CTPP) HEPGIS Interactive Mapping Portal Jeremy Raw, P.E. FHWA, Office of Planning, Systems Planning and Analysis August 2017 Outline Census
Transit Service Gap Technical Documentation
 Transit Service Gap Technical Documentation Introduction This document is an accompaniment to the AllTransit TM transit gap methods document. It is a detailed explanation of the process used to develop
HORIZON 2030: Land Use & Transportation November 2005
 PROJECTS Land Use An important component of the Horizon transportation planning process involved reviewing the area s comprehensive land use plans to ensure consistency between them and the longrange transportation
Regional Performance Measures
 G Performance Measures Regional Performance Measures Introduction This appendix highlights the performance of the MTP/SCS for 2035. The performance of the Revenue Constrained network also is compared to
Developing and Validating Regional Travel Forecasting Models with CTPP Data: MAG Experience
 CTPP Webinar and Discussion Thursday, July 17, 1-3pm EDT Developing and Validating Regional Travel Forecasting Models with CTPP Data: MAG Experience Kyunghwi Jeon, MAG Petya Maneva, MAG Vladimir Livshits,
Mapping Accessibility Over Time
 Journal of Maps, 2006, 76-87 Mapping Accessibility Over Time AHMED EL-GENEIDY and DAVID LEVINSON University of Minnesota, 500 Pillsbury Drive S.E., Minneapolis, MN 55455, USA; geneidy@umn.edu (Received
Developing Innovation Village, Baltimore
 Developing Innovation Village, Baltimore Rick Jenarine, Ridhima Mehrotra, Andrew Seguin, Claire Warner Under the supervision of Professor Chao Liu URSP688L: Planning Technologies The University of Maryland
Forecasts for the Reston/Dulles Rail Corridor and Route 28 Corridor 2010 to 2050
 George Mason University Center for Regional Analysis Forecasts for the Reston/Dulles Rail Corridor and Route 28 Corridor 21 to 25 Prepared for the Fairfax County Department of Planning and Zoning Lisa
Economic and Social Urban Indicators: A Spatial Decision Support System for Chicago Area Transportation Planning
 Economic and Social Urban Indicators: A Spatial Decision Support System for Chicago Area Transportation Planning Piyushimita Thakuriah (Vonu), P.S. Sriraj, Paul Metaxatos, Inshu Minocha & Tanushri Swarup
FHWA Peer Exchange Meeting on Transportation Systems Management during Inclement Weather
 Travel Demand Modeling & Simulation at GBNRTC Matt Grabau Kimberly Smith Mike Davis Why Model? Travel modeling is a tool for transportation planners and policy makers, to observe impacts of a transportation
Brian J. Morton Center for Urban and Regional Studies University of North Carolina - Chapel Hill June 8, 2010
 Brian J. Morton Center for Urban and Regional Studies University of North Carolina - Chapel Hill June 8, 2010 1. TRANUS Highway vehicle technology Trips Mode choice Link-level traffic volumes and average
POCATELLO REGIONAL TRANSIT MASTER TRANSIT PLAN MARKET ASSESSMENT
 POCATELLO REGIONAL TRANSIT MASTER TRANSIT PLAN MARKET ASSESSMENT September 2017 Table of Contents Introduction... 4 Land Use and Urban Form... 5 Location... 5 Historical Context and Urban Form... 6 Land
Regional Performance Measures
 G Performance Measures Regional Performance Measures Introduction This appendix highlights the performance of the MTP/SCS for 2035. The performance of the Revenue Constrained network also is compared to
Spatial Organization of Data and Data Extraction from Maptitude
 Spatial Organization of Data and Data Extraction from Maptitude N. P. Taliceo Geospatial Information Sciences The University of Texas at Dallas UT Dallas GIS Workshop Richardson, TX March 30 31, 2018 1/
DYNAMIC TRIP ATTRACTION ESTIMATION WITH LOCATION BASED SOCIAL NETWORK DATA BALANCING BETWEEN TIME OF DAY VARIATIONS AND ZONAL DIFFERENCES
 DYNAMIC TRIP ATTRACTION ESTIMATION WITH LOCATION BASED SOCIAL NETWORK DATA BALANCING BETWEEN TIME OF DAY VARIATIONS AND ZONAL DIFFERENCES Nicholas W. Hu a, Peter J. Jin b, * a Department of Civil and Environmental
Changes in the Spatial Distribution of Mobile Source Emissions due to the Interactions between Land-use and Regional Transportation Systems
 Changes in the Spatial Distribution of Mobile Source Emissions due to the Interactions between Land-use and Regional Transportation Systems A Framework for Analysis Urban Transportation Center University
The Built Environment, Car Ownership, and Travel Behavior in Seoul
 The Built Environment, Car Ownership, and Travel Behavior in Seoul Sang-Kyu Cho, Ph D. Candidate So-Ra Baek, Master Course Student Seoul National University Abstract Although the idea of integrating land
Identifying transit deserts in major Texas cities where the supplies missed the demands
 THE JOURNAL OF TRANSPORT AND LAND USE http://jtlu.org VOL. 10 NO. 1 [2017] pp. 529 540 Identifying transit deserts in major Texas cities where the supplies missed the demands Junfeng Jiao The University
A TRANSIT ACCESS ANALYSIS OF TANF RECIPIENTS IN THE CITY OF PORTLAND, OREGON
 A TRANSIT ACCESS ANALYSIS OF TANF RECIPIENTS IN THE CITY OF PORTLAND, OREGON By Thomas W. Sanchez Center for Urban Studies Portland State University ABSTRACT Little evidence exists regarding the relationship
OnTheMap for Emergency Management
 OnTheMap for Emergency Management Robert Pitts Geographer/Project Manager Longitudinal Employer Household Dynamics (LEHD) Center for Economic Studies U.S. Census Bureau Jody Hoon-Star Geographer/Application
Geospatial Analysis of Job-Housing Mismatch Using ArcGIS and Python
 Geospatial Analysis of Job-Housing Mismatch Using ArcGIS and Python 2016 ESRI User Conference June 29, 2016 San Diego, CA Jung Seo, Frank Wen, Simon Choi and Tom Vo, Research & Analysis Southern California
The Trade Area Analysis Model
 The Trade Area Analysis Model Trade area analysis models encompass a variety of techniques designed to generate trade areas around stores or other services based on the probability of an individual patronizing
A Comprehensive Method for Identifying Optimal Areas for Supermarket Development. TRF Policy Solutions April 28, 2011
 A Comprehensive Method for Identifying Optimal Areas for Supermarket Development TRF Policy Solutions April 28, 2011 Profile of TRF The Reinvestment Fund builds wealth and opportunity for lowwealth communities
StanCOG Transportation Model Program. General Summary
 StanCOG Transportation Model Program Adopted By the StanCOG Policy Board March 17, 2010 What are Transportation Models? General Summary Transportation Models are technical planning and decision support
American Boulevard Travelshed Analysis
 American Boulevard Travelshed Analysis Prepared by Steven Aviles and Sanjay Dhir Students in GEOG 5564: Urban Geographic Information Systems Analysis University of Minnesota Instructor: Jeff Matson On
Presentation of Travel Demand. And. Relationships to Land Use. Prepared for The Delaware Transportation Institute. David P. Racca
 Presentation of Travel Demand And Relationships to Land Use Prepared for The Delaware Transportation Institute By David P. Racca Center for Applied Demography and Survey Research College of Human Services,
GIS-Based Analysis of the Commuting Behavior and the Relationship between Commuting and Urban Form
 GIS-Based Analysis of the Commuting Behavior and the Relationship between Commuting and Urban Form 1. Abstract A prevailing view in the commuting is that commuting would reconstruct the urban form. By
Guidelines on Using California Land Use/Transportation Planning Tools
 Guidelines on Using California Land Use/Transportation Planning Tools 1. Selecting Ds Analysis Modules Appropriate to a Region In almost all cases, the appropriate Ds Analysis Module to use for analysis
Are You Maximizing The Value Of All Your Data?
 Are You Maximizing The Value Of All Your Data? Using The SAS Bridge for ESRI With ArcGIS Business Analyst In A Retail Market Analysis SAS and ESRI: Bringing GIS Mapping and SAS Data Together Presented
John Thomas & Lori Zeller US Environmental Protection Agency Office of Sustainable Communities. Rich Kuzmyak & Alex Bell Renaissance Planning Group
 Transportation Research Board ADD30 - Transportation and Land Development Committee Methods to Better Account for Land Use in Planning Multimodal Transportation Systems and Sustainable Communities Moderator:
Assessment of Models to Estimate Bus-Stop Level Transit Ridership using Spatial Modeling Methods
 Assessment of Models to Estimate Bus-Stop Level Transit Ridership using Spatial Modeling Methods Assessment of Models to Estimate Bus-Stop Level Transit Ridership using Spatial Modeling Methods Srinivas
Integrating Origin and Destination (OD) Study into GIS in Support of LIRR Services and Network Improvements
 Study into GIS in Support of LIRR Services and Network Improvements") Integrating Origin and Destination (OD) Study into GIS in Support of LIRR Services and Network Improvements GIS In Transit Conference, Washington, DC Long Island Rail Road Pyung ho Kim Date: September
Integrating Origin and Destination (OD) Study into GIS in Support of LIRR Services and Network Improvements GIS In Transit Conference, Washington, DC Long Island Rail Road Pyung ho Kim Date: September
Massachusetts Institute of Technology Department of Urban Studies and Planning
 Massachusetts Institute of Technology Department of Urban Studies and Planning 11.204: Planning, Communications & Digital Media Fall 2002 Lecture 6: Tools for Transforming Data to Action Lorlene Hoyt October
Case Study: Orange County, California. Overview. Context
 Case Study: Orange County, California Overview The Orange County Transportation Authority (OCTA) provides transit service in a generally automobile-oriented part of southern California. Consequently, OCTA
Employment Capacity in Transit Station Areas in Maryland
 Employment Capacity in Transit Station Areas in Maryland Prepared by: The National Center for Smart Growth Research and Education at the University of Maryland* Gerrit Knaap, PhD, Director Terry Moore,
Public Transport Versus Private Car: GIS-Based Estimation of Accessibility Applied to the Tel Aviv Metropolitan Area
 Public Transport Versus Private Car: GIS-Based Estimation of Accessibility Applied to the Tel Aviv Metropolitan Area Itzhak Benenson 1, Karel Martens 3, Yodan Rofe 2, Ariela Kwartler 1 1 Dept of Geography
Foreword. Vision and Strategy
 GREATER MANCHESTER SPATIAL FRAMEWORK Friends of Walkden Station Consultation Response January 2017 Foreword Friends of Walkden Station are a group of dedicated volunteers seeking to raise the status and
Crow River Plaza - Retail Development South Diamond Lake Rd. Rogers, MN FOR LEASE 1,024 SF Retail Space. Lease Rate: $16.
 FEATURES: - Available in Rogers, MN Lease Rate: $16.00 / psf NNN - Excellent location with freeway signage on I-94! - Near large retailers such as Target, Kohls, & Applebees. Taxes $3.65 / psf Cam $3.20
Impact of Metropolitan-level Built Environment on Travel Behavior
 Impact of Metropolitan-level Built Environment on Travel Behavior Arefeh Nasri 1 and Lei Zhang 2,* 1. Graduate Research Assistant; 2. Assistant Professor (*Corresponding Author) Department of Civil and
Urban Planning Word Search Level 1
 Urban Planning Word Search Level 1 B C P U E C O S Y S T E M P A R E U O E U R B A N P L A N N E R T N S T D H E C O U N T Y G E R E R D W R E N I C I T Y C O U N C I L A A A S U G G C I L A G P R I R
Urban Revival in America
 Urban Revival in America Victor Couture 1 Jessie Handbury 2 1 University of California, Berkeley 2 University of Pennsylvania and NBER May 2016 1 / 23 Objectives 1. Document the recent revival of America
Service Area Analysis of Portland's METRO Bus System. Andy Smith-Petersen, University of Southern Maine -
 Andy Smith-Petersen, University of Southern Maine - andysp@usm.maine.edu METRO Background 8 routes serving Portland, South Portland, Falmouth and Westbrook 100,000+ passengers/month, +11% 1997-2005 (GPCOG/METRO,
Crow River Plaza - Retail Development South Diamond Lake Rd. Rogers, MN FOR LEASE 2,066 SF Retail Space. Lease Rate: $16.
 FEATURES: - 2,066 SF End Cap Retail Space Available in Rogers, MN - Excellent location with freeway signage on I-94! - Near large retailers such as Target, Kohls, & Applebees. - Convenient location off
CIV3703 Transport Engineering. Module 2 Transport Modelling
 CIV3703 Transport Engineering Module Transport Modelling Objectives Upon successful completion of this module you should be able to: carry out trip generation calculations using linear regression and category
Transit Time Shed Analyzing Accessibility to Employment and Services
 Transit Time Shed Analyzing Accessibility to Employment and Services presented by Ammar Naji, Liz Thompson and Abdulnaser Arafat Shimberg Center for Housing Studies at the University of Florida www.shimberg.ufl.edu
How Geography Affects Consumer Behaviour The automobile example
 How Geography Affects Consumer Behaviour The automobile example Murtaza Haider, PhD Chuck Chakrapani, Ph.D. We all know that where a consumer lives influences his or her consumption patterns and behaviours.
North Jersey Regional Transportation Model- Enhanced Transportation Modeling Overview May 19, 2008
 North Jersey Regional Transportation Model- Enhanced Transportation Modeling Overview May 19, 2008 Instructors David Schellinger, P.E. Wade White, AICP 1 Agenda Transportation Planning and Modeling Typical
The I-81 Challenge: Study update and overview of travel demand model CNY Engineering Expo November 12, 2012
 The I-81 Challenge: Study update and overview of travel demand model CNY Engineering Expo November 12, 2012 Presented by: Meghan Vitale, SMTC Jason Deshaies, SMTC Presentation overview Part 1: Overview
Demographic Data in ArcGIS. Harry J. Moore IV
 Demographic Data in ArcGIS Harry J. Moore IV Outline What is demographic data? Esri Demographic data - Real world examples with GIS - Redistricting - Emergency Preparedness - Economic Development Next
How GIS based Visualizations Support Land Use and Transportation Modeling
 How GIS based Visualizations Support Land Use and Transportation Modeling ESRI International Users Conference San Diego, CA - July 23, 2015 Prepared by: Troy Hightower Introduction This presentation will
An Aggregated Public Transit Accessibility Measure
 1 Title Page An Aggregated Public Transit Accessibility Measure Md. Sha Al Mamun * Graduate Student Department of Civil and Environmental Engineering University of Connecticut 261 Glenbrook Road, Unit
Simplified Trips-on-Project Software (STOPS): Strategies for Successful Application
: Strategies for Successful Application") Simplified Trips-on-Project Software (STOPS): Strategies for Successful Application presented to Transit Committee Florida Model Task Force presented by Cambridge Systematics, Inc. John (Jay) Evans, AICP
Simplified Trips-on-Project Software (STOPS): Strategies for Successful Application presented to Transit Committee Florida Model Task Force presented by Cambridge Systematics, Inc. John (Jay) Evans, AICP
Improving the Model s Sensitivity to Land Use Policies and Nonmotorized Travel
 Improving the Model s Sensitivity to Land Use Policies and Nonmotorized Travel presented to MWCOG/NCRTPB Travel Forecasting Subcommittee presented by John (Jay) Evans, P.E., AICP Cambridge Systematics,
= 5342 words + 5 tables + 2 figures (250 words each) = 7092 words
 = 7092 words") Influence of Neighborhood Types on Trip Distances A Case Study of Central Ohio Gulsah Akar, PhD (Corresponding Author) Assistant Professor City and Regional Planning Knowlton School of Architecture The
Influence of Neighborhood Types on Trip Distances A Case Study of Central Ohio Gulsah Akar, PhD (Corresponding Author) Assistant Professor City and Regional Planning Knowlton School of Architecture The
GIS 520 Data Cardinality. Joining Tabular Data to Spatial Data in ArcGIS
 GIS 520 Data Cardinality Joining Tabular Data to Spatial Data in ArcGIS Joining Tabular Data to Spatial Data in ArcGIS Outline Working with Zip Code Data Data Cardinality Issues Exploring Data Format Requirements
Population Profiles
 U N D E R S T A N D I N G A N D E X P L O R I N G D E M O G R A P H I C C H A N G E MAPPING AMERICA S FUTURES, BRIEF 6 2000 2010 Population Profiles Atlanta, Las Vegas, Washington, DC, and Youngstown Allison
INSIDE. Metric Descriptions by Topic Area. Data Sources and Methodology by Topic Area. Technical Appendix
 As part of the Chicago Neighborhoods 2015 (CN2015) project, the Institute for Housing Studies at DePaul University collected data and built metrics to help The Chicago Community Trust and the City of Chicago
Westside Extension Los Angeles, California
 Westside Extension Los Angeles, California Rail~Volution 2010 Portland, Oregon Monica Villalobos AECOM History of Westside Suburban Growth in the Westside (1920 1970 s) LA Centers Concept + Employment
Frequently Asked Questions
 What is the Regional Transit Engagement Series? As one of the fastest growing regions in the country, there is recognition that long-term transit planning efforts should be accelerated if we are to remain
Behavioural Analysis of Out Going Trip Makers of Sabarkantha Region, Gujarat, India
 Behavioural Analysis of Out Going Trip Makers of Sabarkantha Region, Gujarat, India C. P. Prajapati M.E.Student Civil Engineering Department Tatva Institute of Technological Studies Modasa, Gujarat, India
Geographic Systems and Analysis
 Geographic Systems and Analysis New York University Robert F. Wagner Graduate School of Public Service Instructor Stephanie Rosoff Contact: stephanie.rosoff@nyu.edu Office hours: Mondays by appointment
Orien Ori t en a t tion a Webi W nar: ebi CPD Maps 2
 Orientation Webinar: CPD Maps 2 Agenda 1. Background - econ Planning Suite 2. Expanded Planning Data 3. CPD Maps Overview 4. Demonstration Guide Me Wizard Map Selection Identify Tool Printing and Saving
Social Studies Grade 2 - Building a Society
 Social Studies Grade 2 - Building a Society Description The second grade curriculum provides students with a broad view of the political units around them, specifically their town, state, and country.
Metrolinx Transit Accessibility/Connectivity Toolkit
 Metrolinx Transit Accessibility/Connectivity Toolkit Christopher Livett, MSc Transportation Planning Analyst Research and Planning Analytics Tweet about this presentation #TransitGIS OUTLINE 1. Who is
Census Transportation Planning Products (CTPP)
") Census Transportation Planning Products (CTPP) Penelope Weinberger CTPP Program Manager - AASHTO September 15, 2010 1 What is the CTPP Program Today? The CTPP is an umbrella program of data products, custom
Census Transportation Planning Products (CTPP) Penelope Weinberger CTPP Program Manager - AASHTO September 15, 2010 1 What is the CTPP Program Today? The CTPP is an umbrella program of data products, custom
Visualization of Origin- Destination Commuter Flow Using CTPP Data and ArcGIS
 Visualization of Origin- Destination Commuter Flow Using CTPP Data and ArcGIS Research & Analysis Department Southern California Association of Governments 2015 ESRI User Conference l July 23, 2015 l San
Are Travel Demand Forecasting Models Biased because of Uncorrected Spatial Autocorrelation? Frank Goetzke RESEARCH PAPER
 Are Travel Demand Forecasting Models Biased because of Uncorrected Spatial Autocorrelation? By Frank Goetzke RESEARCH PAPER 2003-10 Graduate Research Assistant Department of Economics College of Business
THE LEGACY OF DUBLIN S HOUSING BOOM AND THE IMPACT ON COMMUTING
 Proceedings ITRN2014 4-5th September, Caulfield and Ahern: The Legacy of Dublin s housing boom and the impact on commuting THE LEGACY OF DUBLIN S HOUSING BOOM AND THE IMPACT ON COMMUTING Brian Caulfield
Compiled by the Queensland Studies Authority
 Geography Annotated sample assessment Practical exercise Compiled by the February 2007 About this task This sample demonstrates several features: A practical exercise should be conducted under examination
A User s Guide to the Federal Statistical Research Data Centers
 A User s Guide to the Federal Statistical Research Data Centers Mark Roberts Professor of Economics and Director PSU FSRDC September 2016 M. Roberts () RDC User s Guide September 2016 1 / 14 Outline Introduction
Visualization of Commuter Flow Using CTPP Data and GIS
 Visualization of Commuter Flow Using CTPP Data and GIS Research & Analysis Department Southern California Association of Governments 2015 ESRI User Conference l July 23, 2015 l San Diego, CA Jung Seo,
Modeling the land-use correlates of vehicle-trip lengths for assessing the transportation impacts of land developments
 THE JOURL OF TRANSPORT AND LAND USE http://jtlu.org VOL. 6 NO. 2 [2013] pp. 59 75 doi: 10.5198/jtlu.v6i2.254 Modeling the land-use correlates of vehicle-trip lengths for assessing the transportation impacts
Douglas County/Carson City Travel Demand Model
 Douglas County/Carson City Travel Demand Model FINAL REPORT Nevada Department of Transportation Douglas County Prepared by Parsons May 2007 May 2007 CONTENTS 1. INTRODUCTION... 1 2. DEMOGRAPHIC INFORMATION...
Transit Modeling Update. Trip Distribution Review and Recommended Model Development Guidance
 Transit Modeling Update Trip Distribution Review and Recommended Model Development Guidance Contents 1 Introduction... 2 2 FSUTMS Trip Distribution Review... 2 3 Proposed Trip Distribution Approach...
What are we like? Population characteristics from UK censuses. Justin Hayes & Richard Wiseman UK Data Service Census Support
 What are we like? Population characteristics from UK censuses Justin Hayes & Richard Wiseman UK Data Service Census Support Who are we? Richard Wiseman UK Data Service / Jisc Justin Hayes UK Data Service
Traffic Demand Forecast
 Chapter 5 Traffic Demand Forecast One of the important objectives of traffic demand forecast in a transportation master plan study is to examine the concepts and policies in proposed plans by numerically
CONSTRUCTING THE POVERTY AND OPPORTUNITIES/PUBLIC SERVICES MAPS INFORMATION MANAGEMENT. Background: Brazil Without Extreme Poverty Plan
 INFORMATION MANAGEMENT CONSTRUCTING THE POVERTY AND OPPORTUNITIES/PUBLIC SERVICES MAPS Background: Brazil Without Extreme Poverty Plan The Brazil Without Extreme Poverty Plan (BSM), designed to overcome
Transportation Statistical Data Development Report OKALOOSA-WALTON OUTLOOK 2035 LONG RANGE TRANSPORTATION PLAN
 Transportation Statistical Data Development Report OKALOOSA-WALTON OUTLOOK 2035 LONG RANGE TRANSPORTATION PLAN Prepared for the Okaloosa-Walton Transportation Planning Organization and The Florida Department
Alternatives Analysis
 Alternatives Analysis Prepared for: Metropolitan Atlanta Rapid Transit Authority Prepared by: AECOM/Jacobs-JJG Joint Venture Atlanta, GA November 2012 Page Left Intentionally Blank ii TABLE OF CONTENTS
A universal model for mobility and migration patterns
 A universal model for mobility and migration patterns US migrations image by Mauro Martino www.mamartino.com Filippo Simini 1,2,3, Marta C. González 4, Amos Maritan 2, and Albert-László Barabási 1 1 Center
Economic Geography of the Long Island Region
 Geography of Data Economic Geography of the Long Island Region Copyright 2011 AFG 1 The geography of economic activity requires: - the gathering of spatial data - the location of data geographically -
Transit as Solution for Spatial Mismatch
 Transit as Solution for Spatial Mismatch Tianran Zeng Georgia Institute of Technology Abstract From the late 1980s, as the trend of suburbanization and welfare reform draw researchers and policymaker s