Developing the Transit Demand Index (TDI) Gregory Newmark, Regional Transportation Authority Transport Chicago Presentation July 25, 2012
|
|
|
- Frederick Lyons
- 5 years ago
- Views:
Transcription

1 Developing the Transit Demand Index (TDI) Gregory Newmark, Regional Transportation Authority Transport Chicago Presentation July 25, 2012
2 Outline Present RTA methodology Transit Demand Index (TDI) Demonstrate online application Regional Transit Index Data Viewer
3 How to Assess the Demand for Transit in Chicago s Suburbs?

4 Methodology Must: 1. Be simple to apply and interpret 2. Rely on available, frequently updated data 3. Scale to different geographies 4. Emphasize planning variables 5. Quantify the demand

5 Existing Methodologies 1. Density Thresholds 2. Relative Comparison 3. Multiple Regression
6 Density Thresholds Nelson/Nygaard Consulting Associates

7 Existing Methodologies 1. Density Thresholds 2. Relative Comparison 3. Multiple Regression

8 Existing Methodologies 1. Density Thresholds 2. Relative Comparison 3. Multiple Regression
9 Multiple Regression Example: Housing Price = 90(SQFT) (#Bedrooms) - 700(Age) Generic Form Y = B 1 X 1 + B 2 X 2 + B 3 X 3 Y = Dependent Variable (What we are predicting) X = Explanatory Variable (What we use to predict) B = Coefficients (How much each variable contributes)

10 Multiple Regression DVRPC Transit Score
11 Our Approach Multiple Regression Differentiation in explanatory variables Incorporate all trip types A meaningful dependent variable A mappable dependent variable Transit Trip End Density

12 CATS Travel Demand Model Transit Trip Tables

13 CMAP Transportation Analysis Zones
14 Transit Trip End Density Quantiles Transit Trip Ends / Mile CBD Chicago (exclud Suburbs Quantile n = 47 Quantile n = 272 Quantile n = 1,371
15 How to Assess the Demand for Transit in Chicago s Suburbs?
16 How to Account for Potential Demand?
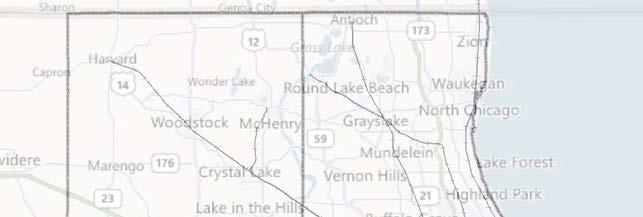
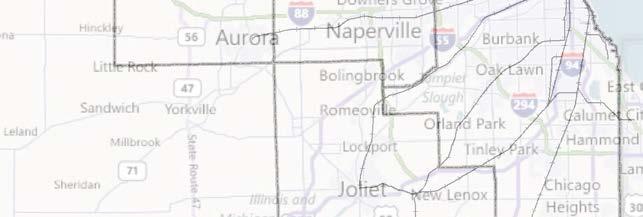
17 The Switch Derive transit demand relationship for city of Chicago ( Chicago Model ) Apply Chicago Model to Suburbs Legend Suburbs Chicago Study Areas Outliers CBD Miles
18 Outliers Removed Suburbs CBD Legend Study Areas Outliers Chicago Miles
19 Explanatory Variables Correlation Correlations Ratio Category Variable Chicago Suburbs Suburbs/Chicago Demographic Total Population % Children (17 and under) % Adults (18 to 64) % Seniors (65 and older) % Workers % Vehicles % Total Households % Households with No Vehicles % Households with Income <$25k % Employment Total Employment % Retail Employment % Non-Retail Employment % Total School Enrollment % Elementary School Enrollment % High School Enrollment % Small College Enrollment % Large College Enrollment % Urban Form Pedestrian Environment Factor (PEF) % Regional Employment Context % 5-Mile Radius Employment Context %
20 TDI Transit Demand Index Chicago Model Suburban Model Coefficient Ratio Variable Coefficient Sig. b Coefficient Sig. Suburban/Chicago Demographic Children (17 and under) *** * 64% Adults (18 to 64) *** *** 58% Seniors (65 and older) *** *** 92% Vehicles *** ** 39% Employment Retail Employment *** *** 32% Non-Retail Employment *** *** 29% Model Adjusted R F Statistic df 6, df 6, 1349 P Value

21 TDI Transit Demand Index What does the TDI mean?

22 TDI Transit Demand Index How do we interpret the TDI?
23 Compare the TSI and the TDI Comparing TSI and TDI in Chicago TSI TDI
24 TDI = TSI / TDI Thresholds Levels TDI Exemplar Bus Weekday Bus Operations Trips Service Span Headways (minutes) (minutes) Low North Riverside - LaGrange Medium 1, Cicero - River Forest 63 1, High 3, Halstead 165 1, TDI Thresholds correspond to transit service levels
25 Application Scaled the TDI to the subzone for suburbs 2010 Census Data 2010 CMAP Employment Data 2012 DMV Data Put the data online in an interactive map

26 Innovations Transit trip end density as a measure Consideration of potential demand Explanatory variable differentiation
27 Limitations Modeled, not actual data used for regression Several social factors not included Only considers walk access to transit Relies on current transit conditions in Chicago as the upper bound
28 Future Steps Incorporate drive / park and ride access Apply at the subzone level Employ in planning studies (e.g. I-90) Thank you for listening We welcome your feedback!
Figure 8.2a Variation of suburban character, transit access and pedestrian accessibility by TAZ label in the study area
 Figure 8.2a Variation of suburban character, transit access and pedestrian accessibility by TAZ label in the study area Figure 8.2b Variation of suburban character, commercial residential balance and mix
BROOKINGS May
 Appendix 1. Technical Methodology This study combines detailed data on transit systems, demographics, and employment to determine the accessibility of jobs via transit within and across the country s 100
California Urban Infill Trip Generation Study. Jim Daisa, P.E.
 California Urban Infill Trip Generation Study Jim Daisa, P.E. What We Did in the Study Develop trip generation rates for land uses in urban areas of California Establish a California urban land use trip
Analyzing the Market Share of Commuter Rail Stations using LEHD Data
 Analyzing the Market Share of Commuter Rail Stations using LEHD Data Using Census Data for Transportation Applications Conference, Irvine, CA October 26, 2011 1. What is the size of Metrolink s commute
Mapping Accessibility Over Time
 Journal of Maps, 2006, 76-87 Mapping Accessibility Over Time AHMED EL-GENEIDY and DAVID LEVINSON University of Minnesota, 500 Pillsbury Drive S.E., Minneapolis, MN 55455, USA; geneidy@umn.edu (Received
Regional Performance Measures
 G Performance Measures Regional Performance Measures Introduction This appendix highlights the performance of the MTP/SCS for 2035. The performance of the Revenue Constrained network also is compared to
Transport Planning in Large Scale Housing Developments. David Knight
 Transport Planning in Large Scale Housing Developments David Knight Large Scale Housing Developments No longer creating great urban spaces in the UK (Hall 2014) Transport Planning Transport planning processes
Regional Performance Measures
 G Performance Measures Regional Performance Measures Introduction This appendix highlights the performance of the MTP/SCS for 2035. The performance of the Revenue Constrained network also is compared to
THE LEGACY OF DUBLIN S HOUSING BOOM AND THE IMPACT ON COMMUTING
 Proceedings ITRN2014 4-5th September, Caulfield and Ahern: The Legacy of Dublin s housing boom and the impact on commuting THE LEGACY OF DUBLIN S HOUSING BOOM AND THE IMPACT ON COMMUTING Brian Caulfield
Local Economic Activity Around Rapid Transit Stations
 Local Economic Activity Around Rapid Transit Stations The Case of Chicago s Orange Line Julie Cooper, MPP 2014 Harris School of Public Policy Transport Chicago June 6, 2014 Motivation Impacts of transit
Land Use Advisory Committee. Updating the Transit Market Areas
 Land Use Advisory Committee Updating the Transit Market Areas March 20, 2014 Agenda Transit Market Areas Purpose of Transit Market Areas Transit Market Index Current Market Area boundaries Updating the
Trip Generation Model Development for Albany
 Trip Generation Model Development for Albany Hui (Clare) Yu Department for Planning and Infrastructure Email: hui.yu@dpi.wa.gov.au and Peter Lawrence Department for Planning and Infrastructure Email: lawrence.peter@dpi.wa.gov.au
Can Public Transport Infrastructure Relieve Spatial Mismatch?
 Can Public Transport Infrastructure Relieve Spatial Mismatch? Evidence from Recent Light Rail Extensions Kilian Heilmann University of California San Diego April 20, 2015 Motivation Paradox: Even though
Understanding Land Use and Walk Behavior in Utah
 Understanding Land Use and Walk Behavior in Utah 15 th TRB National Transportation Planning Applications Conference Callie New GIS Analyst + Planner STUDY AREA STUDY AREA 11 statistical areas (2010 census)
Forecasts for the Reston/Dulles Rail Corridor and Route 28 Corridor 2010 to 2050
 George Mason University Center for Regional Analysis Forecasts for the Reston/Dulles Rail Corridor and Route 28 Corridor 21 to 25 Prepared for the Fairfax County Department of Planning and Zoning Lisa
Economic and Social Urban Indicators: A Spatial Decision Support System for Chicago Area Transportation Planning
 Economic and Social Urban Indicators: A Spatial Decision Support System for Chicago Area Transportation Planning Piyushimita Thakuriah (Vonu), P.S. Sriraj, Paul Metaxatos, Inshu Minocha & Tanushri Swarup
Transit Market Index. Validating Local Potential for Transit Ridership
 Transit Market Index Validating Local Potential for Transit Ridership Transit Market Areas Characteristics 2010 TPP Characterized by different levels of transit service. Core Areas, 1 & 2: A variety of
A Comprehensive Method for Identifying Optimal Areas for Supermarket Development. TRF Policy Solutions April 28, 2011
 A Comprehensive Method for Identifying Optimal Areas for Supermarket Development TRF Policy Solutions April 28, 2011 Profile of TRF The Reinvestment Fund builds wealth and opportunity for lowwealth communities
APPENDIX C-3 Equitable Target Areas (ETA) Technical Analysis Methodology
 Technical Analysis Methodology") APPENDIX C-3 Equitable Target Areas (ETA) Technical Analysis Methodology Contents Introduction... 1 ETA Index Methodology... 1 ETA Index Development... 1 Other EJ Measures... 4 The Limited English Proficiency
APPENDIX C-3 Equitable Target Areas (ETA) Technical Analysis Methodology Contents Introduction... 1 ETA Index Methodology... 1 ETA Index Development... 1 Other EJ Measures... 4 The Limited English Proficiency
Urban Revival in America
 Urban Revival in America Victor Couture 1 Jessie Handbury 2 1 University of California, Berkeley 2 University of Pennsylvania and NBER May 2016 1 / 23 Objectives 1. Document the recent revival of America
Transit Service Gap Technical Documentation
 Transit Service Gap Technical Documentation Introduction This document is an accompaniment to the AllTransit TM transit gap methods document. It is a detailed explanation of the process used to develop
Travel behavior of low-income residents: Studying two contrasting locations in the city of Chennai, India
 Travel behavior of low-income residents: Studying two contrasting locations in the city of Chennai, India Sumeeta Srinivasan Peter Rogers TRB Annual Meet, Washington D.C. January 2003 Environmental Systems,
A TRANSIT ACCESS ANALYSIS OF TANF RECIPIENTS IN THE CITY OF PORTLAND, OREGON
 A TRANSIT ACCESS ANALYSIS OF TANF RECIPIENTS IN THE CITY OF PORTLAND, OREGON By Thomas W. Sanchez Center for Urban Studies Portland State University ABSTRACT Little evidence exists regarding the relationship
Volume Title: Empirical Models of Urban Land Use: Suggestions on Research Objectives and Organization. Volume URL:
 This PDF is a selection from an out-of-print volume from the National Bureau of Economic Research Volume Title: Empirical Models of Urban Land Use: Suggestions on Research Objectives and Organization Volume
New insights about the relation between modal split and urban density: the Lisbon Metropolitan Area case study revisited
 Urban Transport 405 New insights about the relation between modal split and urban density: the Lisbon Metropolitan Area case study revisited J. de Abreu e Silva 1, 2 & F. Nunes da Silva 1 1 CESUR Centre
Subject: Note on spatial issues in Urban South Africa From: Alain Bertaud Date: Oct 7, A. Spatial issues
 Page 1 of 6 Subject: Note on spatial issues in Urban South Africa From: Alain Bertaud Date: Oct 7, 2009 A. Spatial issues 1. Spatial issues and the South African economy Spatial concentration of economic
VALIDATING THE RELATIONSHIP BETWEEN URBAN FORM AND TRAVEL BEHAVIOR WITH VEHICLE MILES TRAVELLED. A Thesis RAJANESH KAKUMANI
 VALIDATING THE RELATIONSHIP BETWEEN URBAN FORM AND TRAVEL BEHAVIOR WITH VEHICLE MILES TRAVELLED A Thesis by RAJANESH KAKUMANI Submitted to the Office of Graduate Studies of Texas A&M University in partial
HORIZON 2030: Land Use & Transportation November 2005
 PROJECTS Land Use An important component of the Horizon transportation planning process involved reviewing the area s comprehensive land use plans to ensure consistency between them and the longrange transportation
CIV3703 Transport Engineering. Module 2 Transport Modelling
 CIV3703 Transport Engineering Module Transport Modelling Objectives Upon successful completion of this module you should be able to: carry out trip generation calculations using linear regression and category
GROWING APART: THE CHANGING FIRM-SIZE WAGE PREMIUM AND ITS INEQUALITY CONSEQUENCES ONLINE APPENDIX
 GROWING APART: THE CHANGING FIRM-SIZE WAGE PREMIUM AND ITS INEQUALITY CONSEQUENCES ONLINE APPENDIX The following document is the online appendix for the paper, Growing Apart: The Changing Firm-Size Wage
GIS Analysis of Crenshaw/LAX Line
 PDD 631 Geographic Information Systems for Public Policy, Planning & Development GIS Analysis of Crenshaw/LAX Line Biying Zhao 6679361256 Professor Barry Waite and Bonnie Shrewsbury May 12 th, 2015 Introduction
EXPLORING THE IMPACTS OF BUILT ENVIRONMENTS ON VEHICLE OWNERSHIP
 EXPLORING THE IMPACTS OF BUILT ENVIRONMENTS ON VEHICLE OWNERSHIP Ali SOLTANI PhD Student School of Natural and Built Environments University of South Australia North Terrace, GPO Box 2471, Adelaide, SA
Brian J. Morton Center for Urban and Regional Studies University of North Carolina - Chapel Hill June 8, 2010
 Brian J. Morton Center for Urban and Regional Studies University of North Carolina - Chapel Hill June 8, 2010 1. TRANUS Highway vehicle technology Trips Mode choice Link-level traffic volumes and average
The Journal of Database Marketing, Vol. 6, No. 3, 1999, pp Retail Trade Area Analysis: Concepts and New Approaches
 Retail Trade Area Analysis: Concepts and New Approaches By Donald B. Segal Spatial Insights, Inc. 4938 Hampden Lane, PMB 338 Bethesda, MD 20814 Abstract: The process of estimating or measuring store trade
INCORPORATING URBAN DESIGN VARIABLES IN METROPOLITAN PLANNING ORGANIZATIONS TRAVEL DEMAND MODELS
 INCORPORATING URBAN DESIGN VARIABLES IN METROPOLITAN PLANNING ORGANIZATIONS TRAVEL DEMAND MODELS RONALD EASH Chicago Area Transportation Study 300 West Adams Street Chicago, Illinois 60606 Metropolitan
Service Area Analysis of Portland's METRO Bus System. Andy Smith-Petersen, University of Southern Maine -
 Andy Smith-Petersen, University of Southern Maine - andysp@usm.maine.edu METRO Background 8 routes serving Portland, South Portland, Falmouth and Westbrook 100,000+ passengers/month, +11% 1997-2005 (GPCOG/METRO,
Employment Decentralization and Commuting in U.S. Metropolitan Areas. Symposium on the Work of Leon Moses
 Employment Decentralization and Commuting in U.S. Metropolitan Areas Alex Anas Professor of Economics University at Buffalo Symposium on the Work of Leon Moses February 7, 2014 9:30-11:15am, and 2:30-4:30pm
Changes in the Spatial Distribution of Mobile Source Emissions due to the Interactions between Land-use and Regional Transportation Systems
 Changes in the Spatial Distribution of Mobile Source Emissions due to the Interactions between Land-use and Regional Transportation Systems A Framework for Analysis Urban Transportation Center University
Douglas County/Carson City Travel Demand Model
 Douglas County/Carson City Travel Demand Model FINAL REPORT Nevada Department of Transportation Douglas County Prepared by Parsons May 2007 May 2007 CONTENTS 1. INTRODUCTION... 1 2. DEMOGRAPHIC INFORMATION...
Transit Modeling Update. Trip Distribution Review and Recommended Model Development Guidance
 Transit Modeling Update Trip Distribution Review and Recommended Model Development Guidance Contents 1 Introduction... 2 2 FSUTMS Trip Distribution Review... 2 3 Proposed Trip Distribution Approach...
Equity, Accessibility and Transit Use in large American cities
 Equity, Accessibility and Transit Use in large American cities Submitted: 1 August 2004 Word Count: 4600 + 1500 = 6100 Murtaza Haider, Ph.D. McGill University, School of Urban Planning 815 Sherbrooke St.
Adapting an Existing Activity Based Modeling Structure for the New York Region
 Adapting an Existing Activity Based Modeling Structure for the New York Region presented to 2018 TRB Innovations in Travel Modeling Conference Attendees presented by Rachel Copperman Jason Lemp with Thomas
Edexcel Geography Advanced Paper 2
 Edexcel Geography Advanced Paper 2 SECTION B: SHAPING PLACES Assessment objectives AO1 Demonstrate knowledge and understanding of places, environments, concepts, processes, interactions and change, at
Data Collection. Lecture Notes in Transportation Systems Engineering. Prof. Tom V. Mathew. 1 Overview 1
 Data Collection Lecture Notes in Transportation Systems Engineering Prof. Tom V. Mathew Contents 1 Overview 1 2 Survey design 2 2.1 Information needed................................. 2 2.2 Study area.....................................
c. What is the most distinctive above ground result of high land costs and intensive land use? i. Describe the vertical geography of a skyscraper?
 AP Human Geography Unit 7b Guided Reading: Urban Patterns and Social Issues Mr. Stepek Key Issue #1: Why Do Services Cluster Downtown? (Rubenstein p 404 410) 1. What is the CBD? What does it contain and
SBCAG Travel Model Upgrade Project 3rd Model TAC Meeting. Jim Lam, Stewart Berry, Srini Sundaram, Caliper Corporation December.
 SBCAG Travel Model Upgrade Project 3rd Model TAC Meeting Jim Lam, Stewart Berry, Srini Sundaram, Caliper Corporation December. 7, 2011 1 Outline Model TAZs Highway and Transit Networks Land Use Database
Managing Growth: Integrating Land Use & Transportation Planning
 Managing Growth: Integrating Land Use & Transportation Planning Metro Vancouver Sustainability Community Breakfast Andrew Curran Manager, Strategy June 12, 2013 2 Integrating Land Use & Transportation
The Church Demographic Specialists
 The Church Demographic Specialists Easy-to-Use Features Map-driven, Web-based Software An Integrated Suite of Information and Query Tools Providing An Insightful Window into the Communities You Serve Key
APPENDIX I: Traffic Forecasting Model and Assumptions
 APPENDIX I: Traffic Forecasting Model and Assumptions Appendix I reports on the assumptions and traffic model specifications that were developed to support the Reaffirmation of the 2040 Long Range Plan.
Typical information required from the data collection can be grouped into four categories, enumerated as below.
 Chapter 6 Data Collection 6.1 Overview The four-stage modeling, an important tool for forecasting future demand and performance of a transportation system, was developed for evaluating large-scale infrastructure
MULTIPLE CHOICE. Choose the one alternative that best completes the statement or answers the question.
 AP Test 13 Review Name MULTIPLE CHOICE. Choose the one alternative that best completes the statement or answers the question. 1) Compared to the United States, poor families in European cities are more
Assessing spatial distribution and variability of destinations in inner-city Sydney from travel diary and smartphone location data
 Assessing spatial distribution and variability of destinations in inner-city Sydney from travel diary and smartphone location data Richard B. Ellison 1, Adrian B. Ellison 1 and Stephen P. Greaves 1 1 Institute
Speakers: Jeff Price, Federal Transit Administration Linda Young, Center for Neighborhood Technology Sofia Becker, Center for Neighborhood Technology
 Speakers: Jeff Price, Federal Transit Administration Linda Young, Center for Neighborhood Technology Sofia Becker, Center for Neighborhood Technology Peter Haas, Center for Neighborhood Technology Craig
1RYHPEHU 3UHSDUHGIRU 3HUIRUPDQFH0HDVXUHV6XEFRPPLWWHHRIWKH 2UHJRQ0RGHOLQJ6WHHULQJ&RPPLWWHH
 67$7,67,&$/$1$/
How Geography Affects Consumer Behaviour The automobile example
 How Geography Affects Consumer Behaviour The automobile example Murtaza Haider, PhD Chuck Chakrapani, Ph.D. We all know that where a consumer lives influences his or her consumption patterns and behaviours.
The 3V Approach. Transforming the Urban Space through Transit Oriented Development. Gerald Ollivier Transport Cluster Leader World Bank Hub Singapore
 Transforming the Urban Space through Transit Oriented Development The 3V Approach Gerald Ollivier Transport Cluster Leader World Bank Hub Singapore MDTF on Sustainable Urbanization The China-World Bank
Impact of Metropolitan-level Built Environment on Travel Behavior
 Impact of Metropolitan-level Built Environment on Travel Behavior Arefeh Nasri 1 and Lei Zhang 2,* 1. Graduate Research Assistant; 2. Assistant Professor (*Corresponding Author) Department of Civil and
Urban Transportation Planning Prof. Dr.V.Thamizh Arasan Department of Civil Engineering Indian Institute of Technology Madras
 Urban Transportation Planning Prof. Dr.V.Thamizh Arasan Department of Civil Engineering Indian Institute of Technology Madras Module #03 Lecture #12 Trip Generation Analysis Contd. This is lecture 12 on
2040 MTP and CTP Socioeconomic Data
 SE Data 6-1 24 MTP and CTP Socioeconomic Data Purpose of Socioeconomic Data The socioeconomic data (SE Data) shows the location of the population and employment, median household income and other demographic
Demographic Data in ArcGIS. Harry J. Moore IV
 Demographic Data in ArcGIS Harry J. Moore IV Outline What is demographic data? Esri Demographic data - Real world examples with GIS - Redistricting - Emergency Preparedness - Economic Development Next
Environmental Analysis, Chapter 4 Consequences, and Mitigation
 Environmental Analysis, Chapter 4 4.17 Environmental Justice This section summarizes the potential impacts described in Chapter 3, Transportation Impacts and Mitigation, and other sections of Chapter 4,
Impact of Light Rail Implementation on Labor Market Accessibility: A Transportation Equity Perspective
 Impact of Light Rail Implementation on Labor Market Accessibility: A Transportation Equity Perspective Yingling Fan *, Andrew Guthrie, and David Levinson * Corresponding Author. Email: yingling@umn.edu;
Compiled by the Queensland Studies Authority
 Geography Annotated sample assessment Practical exercise Compiled by the February 2007 About this task This sample demonstrates several features: A practical exercise should be conducted under examination
Mind the Gap: Transit Need Analysis
 Mind the Gap: Transit Need Analysis Introduction Transit Propensity a measure of demographics that indicate the propensity for people in a given area to use transit GIS: heat maps Emphasizes the transit
STAR COMMUNITY RATING SYSTEM OBJECTIVE EE-4: EQUITABLE SERVICES & ACCESS COMMUNITY LEVEL OUTCOMES FOR KING COUNTY, WA
 STAR COMMUNITY RATING SYSTEM OBJECTIVE EE-4: EQUITABLE SERVICES & ACCESS COMMUNITY LEVEL OUTCOMES FOR KING COUNTY, WA OUTCOME I: EQUITABLE ACCESS AND PROXIMITY Background: This analysis has been developed
Sensitivity of estimates of travel distance and travel time to street network data quality
 Sensitivity of estimates of travel distance and travel time to street network data quality Paul Zandbergen Department of Geography University of New Mexico Outline Street network quality Approaches to
Measuring connectivity in London
 Measuring connectivity in London OECD, Paris 30 th October 2017 Simon Cooper TfL City Planning 1 Overview TfL Connectivity measures in TfL PTALs Travel time mapping Catchment analysis WebCAT Current and
The Built Environment, Car Ownership, and Travel Behavior in Seoul
 The Built Environment, Car Ownership, and Travel Behavior in Seoul Sang-Kyu Cho, Ph D. Candidate So-Ra Baek, Master Course Student Seoul National University Abstract Although the idea of integrating land
APPENDIX PHASE 1 GREEN INFRASTRUCTURE FRAMEWORK
 APPENDIX PHASE 1 GREEN INFRASTRUCTURE FRAMEWORK KANSAS MISSOURI CONTENTS A DATA WISHLIST 4 B PRECEDENTS 7 C WORKSHOP MATERIALS 13 D ANALYSIS PROCESS 124 E ATLAS & PLAYBOOK DETAILS 156 F POLICY ANALYSIS
Too Close for Comfort
 Too Close for Comfort Overview South Carolina consists of urban, suburban, and rural communities. Students will utilize maps to label and describe the different land use classifications. Connection to
Hennepin GIS. Tree Planting Priority Areas - Analysis Methodology. GIS Services April 2018 GOAL:
 Hennepin GIS GIS Services April 2018 Tree Planting Priority Areas - Analysis Methodology GOAL: To create a GIS data layer that will aid Hennepin County Environment & Energy staff in determining where to
Trip Generation Study: A 7-Eleven Gas Station with a Convenience Store Land Use Code: 945
 Trip Generation Study: A 7-Eleven Gas Station with a Convenience Store Land Use Code: 945 Introduction The Brigham Young University Institute of Transportation Engineers student chapter (BYU ITE) completed
StanCOG Transportation Model Program. General Summary
 StanCOG Transportation Model Program Adopted By the StanCOG Policy Board March 17, 2010 What are Transportation Models? General Summary Transportation Models are technical planning and decision support
Presentation of Travel Demand. And. Relationships to Land Use. Prepared for The Delaware Transportation Institute. David P. Racca
 Presentation of Travel Demand And Relationships to Land Use Prepared for The Delaware Transportation Institute By David P. Racca Center for Applied Demography and Survey Research College of Human Services,
Foreword. Vision and Strategy
 GREATER MANCHESTER SPATIAL FRAMEWORK Friends of Walkden Station Consultation Response January 2017 Foreword Friends of Walkden Station are a group of dedicated volunteers seeking to raise the status and
Transferability of Household Travel Data Across Geographic Areas Using NHTS 2001
 Transferability of Household Travel Data Across Geographic Areas Using NHTS 2001 Jane Lin PhD Assistant Professor Department of Civil and Materials Engineering Institute for Environmental Science and Policy
Coordinated Transit and Land Use Planning in the Region of Waterloo
 Coordinated Transit and Land Use Planning in the Region of Waterloo Jeffrey M. Casello University of Waterloo Kevin Curtis Graham Vincent Region of Waterloo Transportation Research Board Best Practices:
Spotlight on Population Resources for Geography Teachers. Pat Beeson, Education Services, Australian Bureau of Statistics
 Spotlight on Population Resources for Geography Teachers Pat Beeson, Education Services, Australian Bureau of Statistics Population Population size Distribution Age Structure Ethnic composition Gender
Assessment of Models to Estimate Bus-Stop Level Transit Ridership using Spatial Modeling Methods
 Assessment of Models to Estimate Bus-Stop Level Transit Ridership using Spatial Modeling Methods Assessment of Models to Estimate Bus-Stop Level Transit Ridership using Spatial Modeling Methods Srinivas
Identifying Inaccessible Areas with Potential to Enhance Transit Market
 Identifying Inaccessible Areas with Potential to Enhance Transit Market Srinivas S. Pulugurtha, Venkata Ramana Duddu, Rakesh Mora The University of North Carolina at Charlotte Abstract The focus of this
Metrolinx Transit Accessibility/Connectivity Toolkit
 Metrolinx Transit Accessibility/Connectivity Toolkit Christopher Livett, MSc Transportation Planning Analyst Research and Planning Analytics Tweet about this presentation #TransitGIS OUTLINE 1. Who is
City of Hermosa Beach Beach Access and Parking Study. Submitted by. 600 Wilshire Blvd., Suite 1050 Los Angeles, CA
 City of Hermosa Beach Beach Access and Parking Study Submitted by 600 Wilshire Blvd., Suite 1050 Los Angeles, CA 90017 213.261.3050 January 2015 TABLE OF CONTENTS Introduction to the Beach Access and Parking
United Growth s Revitalizing Neighborhoods Indicator Project
 United Growth s Revitalizing Neighborhoods Indicator Project Group Members: Prachi Kulkarni Mark O Neall Kent Harding Megan O Brien Paris Howard Blake Hamilton Kerry Hoo http://www.city-data.com/picfilesc/picc32475.php
MOR CO Analysis of future residential and mobility costs for private households in Munich Region
 MOR CO Analysis of future residential and mobility costs for private households in Munich Region The amount of the household budget spent on mobility is rising dramatically. While residential costs can
Cities in Bad Shape: Urban Geometry in India
 Cities in Bad Shape: Urban Geometry in India Mariaflavia Harari MIT IGC Cities Research Group Conference 21 May 2015 Introduction Why Study City Shape A wide range of factors determine intra-urban commuting
March 31, diversity. density. 4 D Model Development. submitted to: design. submitted by: destination
 March 31, 2010 diversity density 4 D Model Development submitted to: design submitted by: destination 4 D Model Development Team SANDAG: Mike Calandra Rick Curry Rob Rundle Parsons Brinckerhoff: Bill Davidson
Palmerston North Area Traffic Model
 Palmerston North Area Traffic Model Presentation to IPWEA 7 November 2014 PNATM Presentation Overview Model Scope and type Data collected The model Forecasting inputs Applications PNCC Aims and Objectives
Decentralisation and its efficiency implications in suburban public transport
 Decentralisation and its efficiency implications in suburban public transport Daniel Hörcher 1, Woubit Seifu 2, Bruno De Borger 2, and Daniel J. Graham 1 1 Imperial College London. South Kensington Campus,
Key Issue 1: Why Do Services Cluster Downtown?
 Key Issue 1: Why Do Services Cluster Downtown? Pages 460-465 1. Define the term CBD in one word. 2. List four characteristics of a typical CBD. Using your knowledge of services from chapter 12, define
THE IMPACT OF URBAN SPATIAL STRUCTURE
 THE IMPACT OF URBAN SPATIAL STRUCTURE ON TRAVEL DEMAND IN THE UNITED STATES Antonio M. Bento University of California, Santa Barbara Maureen L. Cropper The World Bank Ahmed Mushfiq Mobarak University of
Transit-Oriented Development. Christoffer Weckström
 Transit-Oriented Development Christoffer Weckström 31.10.2017 Outline Context of Transit-oriented Development Elements of Transit-oriented Development A short history of land use and transit integration
Bus Transit and Land Use: Illuminating the Interaction
 Bus Transit and Land Use: Illuminating the Interaction Andy Johnson Oregon Department of Transportation Abstract Attracting people to public transit in urban areas has proven to be a difficult task indeed.
Jobs-Housing Fit: Linking Housing Affordability and Local Wages
 Jobs-Housing Fit: Linking Housing Affordability and Local Wages Alex Karner, PhD Assistant Professor School of City and Regional Planning Georgia Institute of Technology Chris Benner, PhD Dorothy E. Everett
Environmental Justice Analysis
 Environmental Justice Analysis October 2013 Transportation Department Environmental Justice Analysis Background The U.S. Environmental Protection Agency (EPA) defines environmental justice as the fair
Xiaoguang Wang, Assistant Professor, Department of Geography, Central Michigan University Chao Liu,
 Xiaoguang Wang, Email: wang9x@cmich.edu Assistant Professor, Department of Geography, Central Michigan University Chao Liu, Email: cliu8@umd.edu Research Associate, National Center for Smart Growth, Research
INSIDE. Metric Descriptions by Topic Area. Data Sources and Methodology by Topic Area. Technical Appendix
 As part of the Chicago Neighborhoods 2015 (CN2015) project, the Institute for Housing Studies at DePaul University collected data and built metrics to help The Chicago Community Trust and the City of Chicago
CIVL 7012/8012. Collection and Analysis of Information
 CIVL 7012/8012 Collection and Analysis of Information Uncertainty in Engineering Statistics deals with the collection and analysis of data to solve real-world problems. Uncertainty is inherent in all real
Access Across America: Transit 2016
 Access Across America: Transit 2016 Final Report Prepared by: Andrew Owen Brendan Murphy Accessibility Observatory Center for Transportation Studies University of Minnesota David Levinson School of Civil
A/Prof. Mark Zuidgeest ACCESSIBILITY EFFECTS OF RELOCATION AND HOUSING PROJECT FOR THE URBAN POOR IN AHMEDABAD, INDIA
 A/Prof. Mark Zuidgeest ACCESSIBILITY EFFECTS OF RELOCATION AND HOUSING PROJECT FOR THE URBAN POOR IN AHMEDABAD, INDIA South African Cities Network/University of Pretoria, 09 April 2018 MOBILITY Ability
Methodological issues in the development of accessibility measures to services: challenges and possible solutions in the Canadian context
 Methodological issues in the development of accessibility measures to services: challenges and possible solutions in the Canadian context Alessandro Alasia 1, Frédéric Bédard 2, and Julie Bélanger 1 (1)