Xiaoguang Wang, Assistant Professor, Department of Geography, Central Michigan University Chao Liu,
|
|
|
- Amos Lynch
- 5 years ago
- Views:
Transcription


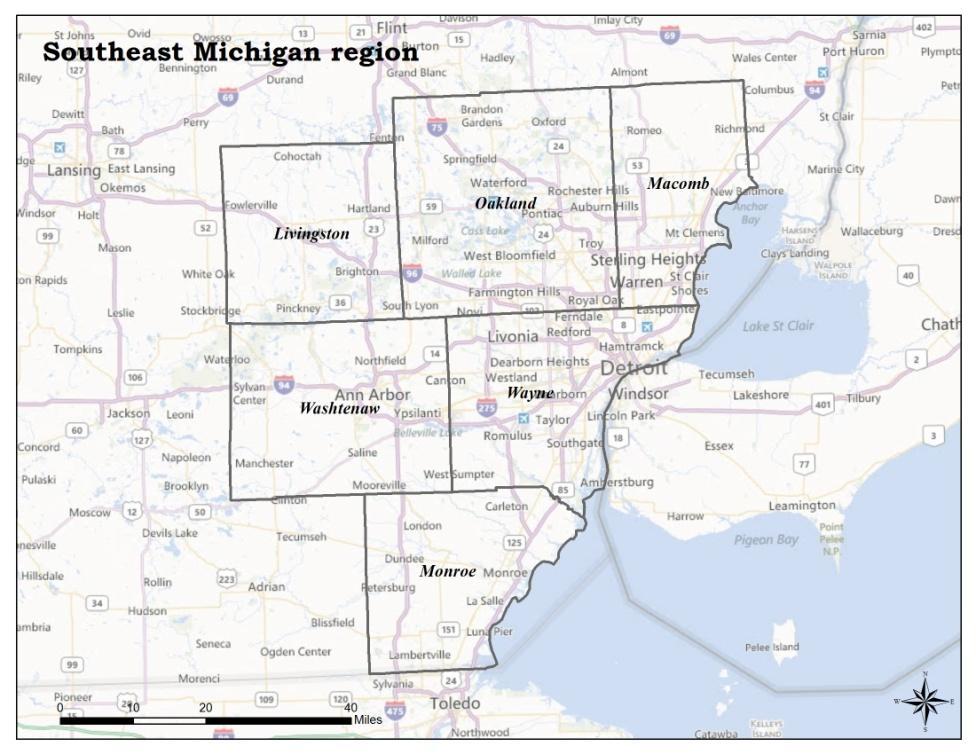
1 Xiaoguang Wang, Assistant Professor, Department of Geography, Central Michigan University Chao Liu, Research Associate, National Center for Smart Growth, Research and Education, University of Maryland Lidia Kostyniuk, Research Scientist, University of Michigan Transportation Research Institute Qing Shen, Professor and Chair, Department of Urban Design and Planning College of Built Environments, University of Washington Shan Bao, Research Fellow, University of Michigan Transportation Research Institute


2 Complete Street Sprawl Street Birmingham, MI Whittaker Rd, MI
3 Whether and to what extent does the street environment influence fuel efficiency? More specifically Whether and to what extent do complete streets decrease fuel efficiency, and whether there might be countermeasures to improve fuel efficiency of such complete streets?
4 Roadway Environment On road (lanes, lane widths, pavements, intersections, speed limit,traffic lights, etc.) Off road (business patterns, land uses, parking, density) Trip Trip purpose Trip length Time of day Drivers Gender Age Weather Temperature Rain/Snow Traffic condition Volume (congestion or not) Driving behavior Speed acceleration/decelera tion Energy consumption rate Vehicle Technology Age Size
5
6 GPS Traces Integrated Vehicle-Based Safety Systems (IVBSS) collected by University Michigan Transportation Research Institute (UMTRI), automobile drivers driving Honda Accord LX sedans over 40 days with a data collection frequency of 10 Hz (26 GB data) Will be used to derive fuel rate, trip characteristics, driver characteristics, traffic condition, weather, and driving behaviours Road environments Road network data provided by Southeast Michigan Council of Governments (SEMCOG), 2011 Business pattern data from InfoUSA, 2006 Population data from Census 2010


7 Fuel efficiency for the m th trip travelling on the n th segment* * Segments which have been travelled by at least 5 different drivers were selected Road segment 1 Road segment 2 Road segment 3 Driver 2 Trip 3 Driver 2 Trip 2 Driver 2 Trip 1 Driver 1 Trip 2 Driver 1 Trip 1


8 Road segment 1 Road segment 2 Road segment 3 Off road environment (buffer area) Big box density Small retail density Population density Employment density On road environment Speed limit # of lanes Intersection density

 Off road (business patterns, land uses, parking,")


9 Roadway Environment On road (lanes, lane widths, pavements, intersections, speed limit, stop signs,traffic lights, etc.) Off road (business patterns, land uses, parking, density) Trip Trip purpose* Trip length Time of day Drivers Gender Age Weather Temperature Rain/Snow Traffic condition Volume (congestion or not) Driving behavior Speed acceleration/decelera tion Energy consumption rate Vehicle (controlled) Technology Age Size
10 108 drivers 16,886 trips 4,711 road segments 197,652 trip segments Average fuel economy: miles per gallon

11 Mean Std. Minimu Deviation m Maximum Women Young Middle Old Highway City Speed Limit # of Lanes Intersection density at 0.1 mile Employment density at 0.1 mile , , Population density at 0.1 mile , , Big box density at 0.1 mile Small retail density at 0.1 mile Intersection density at 0.25 mile Employment density at 0.25 mile 1, , , Population density at 0.25 mile 1, , , Big box density at 0.25 mile Small retail density at 0.25 mile
12 Young Middle Old Total Young Middle Old Total Young Middle Old Total Middle age women has the highest average fuel economy; older women has the lowest. Young drivers have lower fuel economy Mean Fuel Economy (mpg) Male Female Total *Drivers are equally divided by gender and age groups

13 Fuel Economy (mpg) interstate other freeways other principal arterial minor arterials major collectors 40% 35% 30% 25% 20% 15% 10% 5% 0% % of trip segments Fueleconomy.gov

14 Coefficients Sig. (Constant) Speed limit # of Lanes Intersection Density Employment Density Population Density Big box density Small retail density Women Young Old Highway Higher speed limit, higher number of lanes, higher intersection density -> higher fuel economy Both big box and small retails decrease fuel economy Women has better fuel economy

15 refine sprawl and complete streets typology testing structural equation models Use traffic and driving behaviors (speed, acceleration, cruising, etc.) as intermediate variables Refine road segment selections
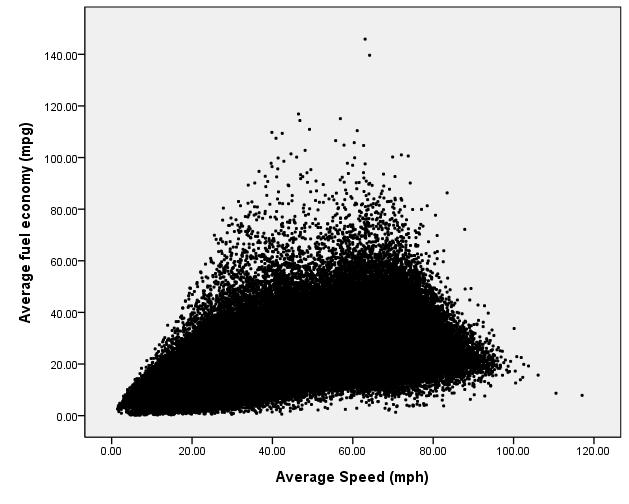
16 A U shape

17 Coefficients Sig. (Constant) Speed Limit # of Lanes Intersection Density Employment Density Population Density Big box density Small retail density Women Young Old City Roads Higher speed limit, higher number of lanes, higher intersection density -> higher fuel economy Both big box and small retails decrease fuel economy Women has better fuel economy
APPENDIX I: Traffic Forecasting Model and Assumptions
 APPENDIX I: Traffic Forecasting Model and Assumptions Appendix I reports on the assumptions and traffic model specifications that were developed to support the Reaffirmation of the 2040 Long Range Plan.
3.0 ANALYSIS OF FUTURE TRANSPORTATION NEEDS
 3.0 ANALYSIS OF FUTURE TRANSPORTATION NEEDS In order to better determine future roadway expansion and connectivity needs, future population growth and land development patterns were analyzed as part of
Refinement of the OECD regional typology: Economic Performance of Remote Rural Regions
 [Preliminary draft April 2010] Refinement of the OECD regional typology: Economic Performance of Remote Rural Regions by Lewis Dijkstra* and Vicente Ruiz** Abstract To account for differences among rural
JCRD501: RURAL COUNTY ROADWAY SPECIFICATIONS
 Typical ADT (Average Daily Traffic) UAL COUNTY OADWAY STANDADS AND SPECIFICATIONS Local oad A Local oad B Local oad C Minor Collector Major Collector Arterial 0-120 120-600 600-1,500 1,250-5,000 >4,500
Travel Time Calculation With GIS in Rail Station Location Optimization
 Travel Time Calculation With GIS in Rail Station Location Optimization Topic Scope: Transit II: Bus and Rail Stop Information and Analysis Paper: # UC8 by Sutapa Samanta Doctoral Student Department of
VHD Daily Totals. Population 14.5% change. VMT Daily Totals Suffolk 24-hour VMT. 49.3% change. 14.4% change VMT
 6.9 Suffolk 6-54 VMT Population and Travel Characteristics Population 14.5% change 2014 1,529,202 VHD Daily Totals 2014 251,060 49.3% change 2040 1,788,175 2040 374,850 VMT Daily Totals 2014 39,731,990
2015 Grand Forks East Grand Forks TDM
 GRAND FORKS EAST GRAND FORKS 2015 TRAVEL DEMAND MODEL UPDATE DRAFT REPORT To the Grand Forks East Grand Forks MPO October 2017 Diomo Motuba, PhD & Muhammad Asif Khan (PhD Candidate) Advanced Traffic Analysis
Expanding the GSATS Model Area into
 Appendix A Expanding the GSATS Model Area into North Carolina Jluy, 2011 Table of Contents LONG-RANGE TRANSPORTATION PLAN UPDATE 1. Introduction... 1 1.1 Background... 1 1.2 Existing Northern Extent of
Chao Liu, Ting Ma, and Sevgi Erdogan National Center for Smart Growth Research & Education (NCSG) University of Maryland, College Park
 University of Maryland, College Park") Chao Liu, Ting Ma, and Sevgi Erdogan National Center for Smart Growth Research & Education (NCSG) University of Maryland, College Park 2015 GIS in Transit, September 1-3, 2015 Shared-use Vehicle Services
Chao Liu, Ting Ma, and Sevgi Erdogan National Center for Smart Growth Research & Education (NCSG) University of Maryland, College Park 2015 GIS in Transit, September 1-3, 2015 Shared-use Vehicle Services
The effects of impact fees on urban form and congestion in Florida
 The effects of impact fees on urban form and congestion in Florida Principal Investigators: Andres G. Blanco Ruth Steiner Presenters: Hyungchul Chung Jeongseob Kim Urban and Regional Planning Contents
APPENDIX IV MODELLING
 APPENDIX IV MODELLING Kingston Transportation Master Plan Final Report, July 2004 Appendix IV: Modelling i TABLE OF CONTENTS Page 1.0 INTRODUCTION... 1 2.0 OBJECTIVE... 1 3.0 URBAN TRANSPORTATION MODELLING
City of Saginaw Right of Way Division Snow and Ice Removal Policy January 18, 2016
 Snow and Ice Removal Policy January 18, 2016 It is the policy of the to provide snowplowing and ice removal services in order to: Provide safe traveling conditions for motorists and pedestrians Assist
Employment Decentralization and Commuting in U.S. Metropolitan Areas. Symposium on the Work of Leon Moses
 Employment Decentralization and Commuting in U.S. Metropolitan Areas Alex Anas Professor of Economics University at Buffalo Symposium on the Work of Leon Moses February 7, 2014 9:30-11:15am, and 2:30-4:30pm
Statistical and Econometric Methods
 Statistical and Econometric Methods Assignment #1 (Continuous Data - Regression Analysis) You are given 151 observations of a travel survey collected in State College, Pennsylvania. All of the households
Urban Planning Word Search Level 1
 Urban Planning Word Search Level 1 B C P U E C O S Y S T E M P A R E U O E U R B A N P L A N N E R T N S T D H E C O U N T Y G E R E R D W R E N I C I T Y C O U N C I L A A A S U G G C I L A G P R I R
Given a polynomial and one of its factors, find the remaining factors of the polynomial. 4. x 3 6x x 6; x 1 SOLUTION: Divide by x 1.
 Use synthetic substitution to find f (4) and f ( 2) for each function. 2. f (x) = x 4 + 8x 3 + x 2 4x 10 Divide the function by x 4. The remainder is 758. Therefore, f (4) = 758. Divide the function by
Updating the Urban Boundary and Functional Classification of New Jersey Roadways using 2010 Census data
 Updating the Urban Boundary and Functional Classification of New Jersey Roadways using 2010 Census data By: Glenn Locke, GISP, PMP 1 GIS-T May, 2013 Presentation Overview Purpose of Project Methodology
North Carolina s First Quadrant Left: History and Lessons Learned
 0 0 0 North Carolina s First Quadrant Left: History and Lessons Learned Michael P. Reese, P.E. (Corresponding Author) Congestion Management Section Project Engineer North Carolina Department of Transportation
What s Your Mileage?
 Overview Math Concepts Materials Students use linear equations to model and solve real-world slope TI-30XS problems. Students also see the correlation between the fractions MultiView graph of an equation
Impact of Metropolitan-level Built Environment on Travel Behavior
 Impact of Metropolitan-level Built Environment on Travel Behavior Arefeh Nasri 1 and Lei Zhang 2,* 1. Graduate Research Assistant; 2. Assistant Professor (*Corresponding Author) Department of Civil and
PROPOSED PROJECT. Section PROJECT DESCRIPTION
 1 2 3 4 5 6 7 8 9 10 11 12 13 14 15 16 17 18 19 20 21 22 23 24 25 26 27 28 29 30 31 32 33 34 35 36 37 38 39 40 41 42 43 1.1 PROJECT DESCRIPTION This Environmental Assessment describes the proposed improvements
Market Street PDP. Nassau County, Florida. Transportation Impact Analysis. VHB/Vanasse Hangen Brustlin, Inc. Nassau County Growth Management
 Transportation Impact Analysis Market Street PDP Nassau County, Florida Submitted to Nassau County Growth Management Prepared for TerraPointe Services, Inc. Prepared by VHB/Vanasse Hangen Brustlin, Inc.
Modeling of Accidents Using Safety Performance Functions
 Modeling of Accidents Using Safety Performance Functions Khair S. Jadaan, Lamya Y. Foudeh, Mohammad N. Al-Marafi, and Majed Msallam Abstract Extensive research has been carried out in the field of road
2014 Certification Review Regional Data & Modeling
 2014 Certification Review Regional Data & Modeling July 22, 2014 Regional Data Census Program Coordination PAG works with and for member agencies to ensure full participation in all Census Bureau programs
A Driving Simulation Based Study on the Effects of. Road Marking Luminance Contrast on Driving Safety. Yong Cao, Jyh-Hone Wang
 A Driving Simulation Based Study on the Effects of Road Marking Luminance Contrast on Driving Safety Yong Cao, Jyh-Hone Wang Department of Industrial and Manufacturing Engineering University of Rhode Island,
2011 South Western Region Travel Time Monitoring Program Congestion Management Process. Executive Summary
 2011 South Western Region Travel Monitoring Program Executive Summary Prepared by: South Western Regional Planning Agency 888 Washington Blvd, 3rd Floor Stamford, CT 06901 Telephone: 203.6.5190 Facsimile:
North Carolina s First Quadrant Left: History and Lessons Learned
 North Carolina s First Quadrant Left: History and Lessons Learned Michael P. Reese, P.E. (Corresponding Author) Congestion Management Section Project Engineer North Carolina Department of Transportation
VISUAL EXPLORATION OF SPATIAL-TEMPORAL TRAFFIC CONGESTION PATTERNS USING FLOATING CAR DATA. Candra Kartika 2015
 VISUAL EXPLORATION OF SPATIAL-TEMPORAL TRAFFIC CONGESTION PATTERNS USING FLOATING CAR DATA Candra Kartika 2015 OVERVIEW Motivation Background and State of The Art Test data Visualization methods Result
Statewide State Roads Layer Michigan Geographic Framework Field Definitions
 Statewide State Roads Layer Michigan Geographic Framework Field Definitions (Shapefile Attribute Table) (June 1, 2012 Version 12b) The following field definitions make up the shapefile attribute table
WOODRUFF ROAD CORRIDOR ORIGIN-DESTINATION ANALYSIS
 2018 WOODRUFF ROAD CORRIDOR ORIGIN-DESTINATION ANALYSIS Introduction Woodruff Road is the main road to and through the commercial area in Greenville, South Carolina. Businesses along the corridor have
SBCAG Travel Model Upgrade Project 3rd Model TAC Meeting. Jim Lam, Stewart Berry, Srini Sundaram, Caliper Corporation December.
 SBCAG Travel Model Upgrade Project 3rd Model TAC Meeting Jim Lam, Stewart Berry, Srini Sundaram, Caliper Corporation December. 7, 2011 1 Outline Model TAZs Highway and Transit Networks Land Use Database
TRAFFIC FORECAST METHODOLOGY
 CHAPTER 5 TRAFFIC FORECAST METHODOLOGY Introduction Need for County-Level Traffic Forecasting 2030 HC-TSP Model Methodology Model Calibration Future Traffic Forecasts Hennepin County Transportation Systems
Influences of built environment characteristics and individual factors on commuting distance: a multilevel mixture hazard modeling approach
 Submitted for Transportation Research Part D: Transport and Environment Influences of built environment characteristics and individual factors on commuting distance: a multilevel mixture hazard modeling
Understanding Land Use and Walk Behavior in Utah
 Understanding Land Use and Walk Behavior in Utah 15 th TRB National Transportation Planning Applications Conference Callie New GIS Analyst + Planner STUDY AREA STUDY AREA 11 statistical areas (2010 census)
Multiple Changepoint Detection on speed profile in work zones using SHRP 2 Naturalistic Driving Study Data
 Multiple Changepoint Detection on speed profile in work zones using SHRP 2 Naturalistic Driving Study Data Hossein Naraghi 2017 Mid-Continent TRS Background Presence of road constructions and maintenance
Advancing Transportation Performance Management and Metrics with Census Data
 Advancing Transportation Performance Management and Metrics with Census Data Authors: Ivana Tasic, University of Utah, Department of Civil and Environmental Engineering, 110 Central Campus Drive, Salt
NORTH HOUSTON HIGHWAY IMPROVEMENT PROJECT (NHHIP)
") NORTH HOUSTON HIGHWAY IMPROVEMENT PROJECT (NHHIP) Project Overview Briefing Packet September 2015 RECOMMENDED ALTERNATIVES Environmental Impact Statement (EIS) Project Divided into 3 Segments Segment 1:
NORTH HOUSTON HIGHWAY IMPROVEMENT PROJECT (NHHIP) Project Overview Briefing Packet September 2015 RECOMMENDED ALTERNATIVES Environmental Impact Statement (EIS) Project Divided into 3 Segments Segment 1:
User perceptions of highway roughness. Kevan Shafizadeh and Fred Mannering
 User perceptions of highway roughness Kevan Shafizadeh and Fred Mannering Background States invest millions of dollars annually measuring the physical condition of their highways Such measurements are
Geospatial Big Data Analytics for Road Network Safety Management
 Proceedings of the 2018 World Transport Convention Beijing, China, June 18-21, 2018 Geospatial Big Data Analytics for Road Network Safety Management ABSTRACT Wei Liu GHD Level 1, 103 Tristram Street, Hamilton,
ACCESSIBILITY OF INTERMODAL CENTERS STUDY
 ACCESSIBILITY OF INTERMODAL CENTERS STUDY Presentation for VDOT Forum - Coordinating Transportation Planning and Land Use Wednesday, April 2, 2014 Vlad Gavrilovic, AICP - Renaissance Planning Group Tasks
TRAVEL DEMAND MODEL. Chapter 6
 Chapter 6 TRAVEL DEMAND MODEL As a component of the Teller County Transportation Plan development, a computerized travel demand model was developed. The model was utilized for development of the Transportation
NORTH HOUSTON HIGHWAY IMPROVEMENT PROJECT (NHHIP)
") NORTH HOUSTON HIGHWAY IMPROVEMENT PROJECT (NHHIP) Planning for a Mega Project in a Metropolitan Area TxDOT Short Course October 13, 2015 RECOMMENDED ALTERNATIVES Environmental Impact Statement (EIS) Project
NORTH HOUSTON HIGHWAY IMPROVEMENT PROJECT (NHHIP) Planning for a Mega Project in a Metropolitan Area TxDOT Short Course October 13, 2015 RECOMMENDED ALTERNATIVES Environmental Impact Statement (EIS) Project
6 th Line Municipal Class Environmental Assessment
 6 th Line Municipal Class Environmental Assessment County Road 27 to St John s Road Town of Innisfil, ON September 6, 2016 APPENDIX L: TRAVEL DEMAND FORECASTING MEMORANDUM Accessible formats are available
Transportation and Road Weather
 Portland State University PDXScholar TREC Friday Seminar Series Transportation Research and Education Center (TREC) 4-18-2014 Transportation and Road Weather Rhonda Young University of Wyoming Let us know
Effectiveness of Experimental Transverse- Bar Pavement Marking as Speed-Reduction Treatment on Freeway Curves
 Effectiveness of Experimental Transverse- Bar Pavement Marking as Speed-Reduction Treatment on Freeway Curves Timothy J. Gates, Xiao Qin, and David A. Noyce Researchers performed a before-and-after analysis
Contemporary Human Geography 3 rd Edition
 Contemporary Human Geography 3 rd Edition Chapter 13: Urban Patterns Marc Healy Elgin Community College Services are attracted to the Central Business District (CBD) because of A. accessibility. B. rivers.
106 PURDUE ENGINEERING EXTENSION DEPARTMENT
 106 PURDUE ENGINEERING EXTENSION DEPARTMENT distribution by stations can best be studied by examining Figs. 3 and 4. Figure 4 shows the frequency distribution between stations, and Fig. 3 shows the actual
Appendix BAL Baltimore, Maryland 2003 Annual Report on Freeway Mobility and Reliability
 (http://mobility.tamu.edu/mmp) Office of Operations, Federal Highway Administration Appendix BAL Baltimore, Maryland 2003 Annual Report on Freeway Mobility and Reliability This report is a supplement to:
= 5342 words + 5 tables + 2 figures (250 words each) = 7092 words
 = 7092 words") Influence of Neighborhood Types on Trip Distances A Case Study of Central Ohio Gulsah Akar, PhD (Corresponding Author) Assistant Professor City and Regional Planning Knowlton School of Architecture The
Influence of Neighborhood Types on Trip Distances A Case Study of Central Ohio Gulsah Akar, PhD (Corresponding Author) Assistant Professor City and Regional Planning Knowlton School of Architecture The
Travel Demand Model Report City of Peterborough Comprehensive Transportation Plan Update Supporting Document
 Travel Demand Model Report City of Peterborough Comprehensive Transportation Plan Update Supporting Document Prepared for: City of Peterborough and Morrison Hershfield June 2012 Paradigm Transportation
CVS Derwood. Local Area Transportation Review
 CVS Derwood Montgomery County, Maryland May 27, 2016 Local Area Transportation Review Prepared for: JC Bar Properties, Inc. Steve Fleming, PE 415 Fallowfield Road, Suite 301 Camp Hill, Pennsylvania 17011
Parking Regulations Dundas Street West, from Bathurst Street to Dovercourt Road
 STAFF REPORT ACTION REQUIRED Parking Regulations Dundas Street West, from Bathurst Street to Dovercourt Road Date: October 28, 2008 To: From: Toronto and East York Community Council Director, Transportation
Developing the Transit Demand Index (TDI) Gregory Newmark, Regional Transportation Authority Transport Chicago Presentation July 25, 2012
 Gregory Newmark, Regional Transportation Authority Transport Chicago Presentation July 25, 2012") Developing the Transit Demand Index (TDI) Gregory Newmark, Regional Transportation Authority Transport Chicago Presentation July 25, 2012 Outline Present RTA methodology Transit Demand Index (TDI) Demonstrate
Developing the Transit Demand Index (TDI) Gregory Newmark, Regional Transportation Authority Transport Chicago Presentation July 25, 2012 Outline Present RTA methodology Transit Demand Index (TDI) Demonstrate
Using GIS to Determine Goodness of Fit for Functional Classification. Eric Foster NWMSU MoDOT
 Using GIS to Determine Goodness of Fit for Functional Classification Eric Foster NWMSU MoDOT Northwest Missouri State Masters of GIScience Degree Program University All Online Coursework Missouri Department
Chapter 5 Traffic Flow Characteristics
 Chapter 5 Traffic Flow Characteristics 1 Contents 2 Introduction The Nature of Traffic Flow Approaches to Understanding Traffic Flow Parameters Connected with Traffic Flow Categories of Traffic Flow The
Appendix B. Land Use and Traffic Modeling Documentation
 Appendix B Land Use and Traffic Modeling Documentation Technical Memorandum Planning Level Traffic for Northridge Sub-Area Study Office of Statewide Planning and Research Modeling & Forecasting Section
FY 2010 Continuing i Planning Program Product Report. Local Transportation and Traffic Data. Wood-Washington-Wirt Interstate Planning Commission
 FY 2010 Continuing i Planning Program Product Report Local Transportation and Traffic Data Travel Time and Delay Data for Belpre and Marietta, Ohio Wood-Washington-Wirt Interstate Planning Commission CONTINUING
The Sunland Park flyover ramp is set to close the week of March 19 until early summer
 March 2, 2018 The Sunland Park flyover ramp is set to close the week of March 19 until early summer GO 10 is targeting the week of March 19 to close the Sunland Park Drive flyover entrance ramp to I 10
VALIDATING THE RELATIONSHIP BETWEEN URBAN FORM AND TRAVEL BEHAVIOR WITH VEHICLE MILES TRAVELLED. A Thesis RAJANESH KAKUMANI
 VALIDATING THE RELATIONSHIP BETWEEN URBAN FORM AND TRAVEL BEHAVIOR WITH VEHICLE MILES TRAVELLED A Thesis by RAJANESH KAKUMANI Submitted to the Office of Graduate Studies of Texas A&M University in partial
Mapping Accessibility Over Time
 Journal of Maps, 2006, 76-87 Mapping Accessibility Over Time AHMED EL-GENEIDY and DAVID LEVINSON University of Minnesota, 500 Pillsbury Drive S.E., Minneapolis, MN 55455, USA; geneidy@umn.edu (Received
Sensitivity of estimates of travel distance and travel time to street network data quality
 Sensitivity of estimates of travel distance and travel time to street network data quality Paul Zandbergen Department of Geography University of New Mexico Outline Street network quality Approaches to
Encapsulating Urban Traffic Rhythms into Road Networks
 Encapsulating Urban Traffic Rhythms into Road Networks Junjie Wang +, Dong Wei +, Kun He, Hang Gong, Pu Wang * School of Traffic and Transportation Engineering, Central South University, Changsha, Hunan,
CONTINUING PLANNING PROGRAM LOCAL TRANSPORTATION AND TRAFFIC DATA PRODUCT REPORT [OH Corridors]
![CONTINUING PLANNING PROGRAM LOCAL TRANSPORTATION AND TRAFFIC DATA PRODUCT REPORT [OH Corridors]](/thumbs/94/120123757.jpg "CONTINUING PLANNING PROGRAM LOCAL TRANSPORTATION AND TRAFFIC DATA PRODUCT REPORT [OH Corridors]") CONTINUING PLANNING PROGRAM LOCAL TRANSPORTATION AND TRAFFIC DATA PRODUCT REPORT [OH Corridors] Travel Time and Delay Analysis for Belpre (OH) and Marietta (OH) Fiscal Year 2009 Report WOOD WASHINGTON
CONTINUING PLANNING PROGRAM LOCAL TRANSPORTATION AND TRAFFIC DATA PRODUCT REPORT [OH Corridors] Travel Time and Delay Analysis for Belpre (OH) and Marietta (OH) Fiscal Year 2009 Report WOOD WASHINGTON
April 18, Accessibility and Smart Scale: Using Access Scores to Prioritize Projects
 Accessibility and Smart Scale: Using Access Scores to Prioritize Projects April 18, 2017 Accessibility and Smart Scale: Using Access Scores to Prioritize Projects State Smart Transportation Initiative
Area Classification of Surrounding Parking Facility Based on Land Use Functionality
 Open Journal of Applied Sciences, 0,, 80-85 Published Online July 0 in SciRes. http://www.scirp.org/journal/ojapps http://dx.doi.org/0.4/ojapps.0.709 Area Classification of Surrounding Parking Facility
Identification of Regional Subcenters Using Spatial Data Analysis for Estimating Traffic Volume
 Identification of Regional Subcenters Using Spatial Data Analysis for Estimating Traffic Volume Fang Zhao and Nokil Park Lehman Center for Transportation Research Department of Civil & Env.. Engineering
StanCOG Transportation Model Program. General Summary
 StanCOG Transportation Model Program Adopted By the StanCOG Policy Board March 17, 2010 What are Transportation Models? General Summary Transportation Models are technical planning and decision support
Smart Growth: Threat to the Quality of Life. Experience
 Smart Growth: Threat to the Quality of Life Presentation by Wendell Cox Wendell Cox Consultancy Visiting Professor Conservatoire National des Arts et Metiers Paris Frontier Centre for Public Policy Winnipeg
AKTIVE SICHERHEIT 4.0. Prof. K. Kompass, Dr. S. Nitsche April 2017
 AKTIVE SICHERHEIT 4.0 Prof. K. Kompass, Dr. S. Nitsche April 2017 L e v e l of p e r f o r m a n c e ASSISTED AND AUTOMATED DRIVING HIGHER LEVELS OF AUTOMATION ACTIVE SAFETY L e v e l of a u t o m a t
Appendixx C Travel Demand Model Development and Forecasting Lubbock Outer Route Study June 2014
 Appendix C Travel Demand Model Development and Forecasting Lubbock Outer Route Study June 2014 CONTENTS List of Figures-... 3 List of Tables... 4 Introduction... 1 Application of the Lubbock Travel Demand
CITY OF NEW LONDON WINTER ROAD & SIDEWALK MAINTENANCE POLICY
 CITY OF NEW LONDON WINTER ROAD & SIDEWALK MAINTENANCE POLICY GENERAL The purpose of this policy is to set up acceptable procedures and policies for the winter maintenance of public areas in the City of
Research Article Headway Distributions Based on Empirical Erlang and Pearson Type III Time Methods Compared
 Research Journal of Applied Sciences, Engineering and Technology 7(21): 4410-4414, 2014 DOI:10.19026/rjaset.7.817 ISSN: 2040-7459; e-issn: 2040-7467 2014 Maxwell Scientific Publication Corp. Submitted:
PATREC PERSPECTIVES Sensing Technology Innovations for Tracking Congestion
 PATREC PERSPECTIVES Sensing Technology Innovations for Tracking Congestion Drivers have increasingly been using inexpensive mapping applications imbedded into mobile devices (like Google Maps, MapFactor,
NATHAN HALE HIGH SCHOOL PARKING AND TRAFFIC ANALYSIS. Table of Contents
 Parking and Traffic Analysis Seattle, WA Prepared for: URS Corporation 1501 4th Avenue, Suite 1400 Seattle, WA 98101-1616 Prepared by: Mirai Transportation Planning & Engineering 11410 NE 122nd Way, Suite
TEEN DRIVER ELECTRONIC DEVICE OBSERVATION FORM
 TEEN OBSERVATION FORM High Schools will count only teen drivers. If your school does not have many teen drivers, please use the Junior High form to count adult drivers. Choose a day to conduct your pre-observations.
March 31, diversity. density. 4 D Model Development. submitted to: design. submitted by: destination
 March 31, 2010 diversity density 4 D Model Development submitted to: design submitted by: destination 4 D Model Development Team SANDAG: Mike Calandra Rick Curry Rob Rundle Parsons Brinckerhoff: Bill Davidson
Factors Impacting Link Travel Speed Reliability: A Case Study at Cairo, Egypt
 Factors Impacting Link Travel Speed Reliability: A Case Study at Cairo, Egypt Akram Sabry Nile University, Giza, Egypt Email: akramsabry@hotmail.com Hoda Talaat Faculty of Engineering, Cairo University,
Unobserved Heterogeneity and the Statistical Analysis of Highway Accident Data. Fred Mannering University of South Florida
 Unobserved Heterogeneity and the Statistical Analysis of Highway Accident Data Fred Mannering University of South Florida Highway Accidents Cost the lives of 1.25 million people per year Leading cause
The Emerging Southeast MegaRegion
 The Emerging Southeast MegaRegion Catherine L. Ross, Ph.D. Director, Center for Quality Growth and Regional Development presented at the Think Global, Act Regional Symposium January 30, 2006 Case Study:
International Journal of Scientific & Engineering Research Volume 9, Issue 6, June ISSN
 International Journal of Scientific & Engineering Research Volume 9, Issue 6, June-2018 109 Quantifying Traffic Congestion by Studying Traffic Flow Characteristics in Wolaita Sodo Town, Ethiopia Mengistu
Taming the Modeling Monster
 Taming the Modeling Monster Starring: Ellen Greenberg Scott McCarey Jim Charlier Audience Poll, part 1 Elected Officials Board Members Public Staff Consultants Journalists Other Audience Poll, part 2 Modeling
Leaving the Ivory Tower of a System Theory: From Geosimulation of Parking Search to Urban Parking Policy-Making
 Leaving the Ivory Tower of a System Theory: From Geosimulation of Parking Search to Urban Parking Policy-Making Itzhak Benenson 1, Nadav Levy 1, Karel Martens 2 1 Department of Geography and Human Environment,
Dan Graham Professor of Statistical Modelling. Centre for Transport Studies
 Quantifying the effects of urban road capacity expansions on network performance and productivity via a mixed model generalised propensity score estimator Dan Graham Professor of Statistical Modelling
An Investigation of Urban form in Lahore and neighboring cities
 An Investigation of Urban form in Lahore and neighboring cities PRESENTER NAME: ENGR. MUHAMMAD KAMRAN Author Names: Engr. Muhammad Kamran Dr. Zahara Batool Engr. Umair Durrani Contents Introduction Literature
5-6 The Remainder and Factor Theorems
 Use synthetic substitution to find f (4) and f ( 2) for each function. 1. f (x) = 2x 3 5x 2 x + 14 58; 20 2. f (x) = x 4 + 8x 3 + x 2 4x 10 758; 46 3. NATURE The approximate number of bald eagle nesting
Douglas County/Carson City Travel Demand Model
 Douglas County/Carson City Travel Demand Model FINAL REPORT Nevada Department of Transportation Douglas County Prepared by Parsons May 2007 May 2007 CONTENTS 1. INTRODUCTION... 1 2. DEMOGRAPHIC INFORMATION...
GIS ANALYSIS METHODOLOGY
 GIS ANALYSIS METHODOLOGY No longer the exclusive domain of cartographers, computer-assisted drawing technicians, mainframes, and workstations, geographic information system (GIS) mapping has migrated to
Planning Level Regression Models for Crash Prediction on Interchange and Non-Interchange Segments of Urban Freeways
 Planning Level Regression Models for Crash Prediction on Interchange and Non-Interchange Segments of Urban Freeways Arun Chatterjee, Professor Department of Civil and Environmental Engineering The University
Traffic Demand Forecast
 Chapter 5 Traffic Demand Forecast One of the important objectives of traffic demand forecast in a transportation master plan study is to examine the concepts and policies in proposed plans by numerically
Keywords: Travel Behavior; Transportation Finance; Global Positioning Systems (GPS)
") 0 0 0 How Local is Travel? Michael Scharenbroich Humphrey Institute of Public Affairs University of Minnesota 0 th Ave. S Minneapolis, MN scha0@umn.edu Michael Iacono* Department of Civil Engineering University
0 0 0 How Local is Travel? Michael Scharenbroich Humphrey Institute of Public Affairs University of Minnesota 0 th Ave. S Minneapolis, MN scha0@umn.edu Michael Iacono* Department of Civil Engineering University
EXAMINATION OF THE SAFETY IMPACTS OF VARYING FOG DENSITIES: A CASE STUDY OF I-77 IN VIRGINIA
 0 0 0 EXAMINATION OF THE SAFETY IMPACTS OF VARYING FOG DENSITIES: A CASE STUDY OF I- IN VIRGINIA Katie McCann Graduate Research Assistant University of Virginia 0 Edgemont Road Charlottesville, VA 0 --
III. FORECASTED GROWTH
 III. FORECASTED GROWTH In order to properly identify potential improvement projects that will be required for the transportation system in Milliken, it is important to first understand the nature and volume
Factors Affecting the Severity of Injuries Sustained in Collisions with Roadside Objects
 Factors Affecting the Severity of Injuries Sustained in Collisions with Roadside Objects Presenter: Ashirwad Barnwal Adviser: Dr. Peter T. Savolainen Source: clipartbest.com 1 Overview Background Research
Active Traffic & Safety Management System for Interstate 77 in Virginia. Chris McDonald, PE VDOT Southwest Regional Operations Director
 Active Traffic & Safety Management System for Interstate 77 in Virginia Chris McDonald, PE VDOT Southwest Regional Operations Director Interstate 77 at Fancy Gap Mountain Mile markers 0-15 Built in late
I. M. Schoeman North West University, South Africa. Abstract
 Urban Transport XX 607 Land use and transportation integration within the greater area of the North West University (Potchefstroom Campus), South Africa: problems, prospects and solutions I. M. Schoeman
suppressing traffic flow instabilities
 suppressing traffic flow instabilities S S VF VC VL D D Berthold K.P. Horn Traffic flow instabilities waste energy: At high densities traffic flow becomes unstable Traffic acts as if it was a dilatant
TUESDAYS AT APA PLANNING AND HEALTH. SAGAR SHAH, PhD AMERICAN PLANNING ASSOCIATION SEPTEMBER 2017 DISCUSSING THE ROLE OF FACTORS INFLUENCING HEALTH
 SAGAR SHAH, PhD sshah@planning.org AMERICAN PLANNING ASSOCIATION SEPTEMBER 2017 TUESDAYS AT APA PLANNING AND HEALTH DISCUSSING THE ROLE OF FACTORS INFLUENCING HEALTH Outline of the Presentation PLANNING
A Cellular Automaton Model for Heterogeneous and Incosistent Driver Behavior in Urban Traffic
 Commun. Theor. Phys. 58 (202) 744 748 Vol. 58, No. 5, November 5, 202 A Cellular Automaton Model for Heterogeneous and Incosistent Driver Behavior in Urban Traffic LIU Ming-Zhe ( ), ZHAO Shi-Bo ( ô ),,
COUNCIL POLICY BACKGROUND
 COUNCIL POLICY Policy Title: Snow and Ice Control Policy Policy Number: TP004 Report Number: TTP2003-39, C2007-44, LPT2011-57 Approved by: City Council Effective Date: Interim policy approved 2009 December
A Micro-Analysis of Accessibility and Travel Behavior of a Small Sized Indian City: A Case Study of Agartala
 A Micro-Analysis of Accessibility and Travel Behavior of a Small Sized Indian City: A Case Study of Agartala Moumita Saha #1, ParthaPratim Sarkar #2,Joyanta Pal #3 #1 Ex-Post graduate student, Department