VISUAL EXPLORATION OF SPATIAL-TEMPORAL TRAFFIC CONGESTION PATTERNS USING FLOATING CAR DATA. Candra Kartika 2015
|
|
|
- Clara Leonard
- 6 years ago
- Views:
Transcription
1 VISUAL EXPLORATION OF SPATIAL-TEMPORAL TRAFFIC CONGESTION PATTERNS USING FLOATING CAR DATA Candra Kartika 2015
2 OVERVIEW Motivation Background and State of The Art Test data Visualization methods Result and Analysis Conclusion
3 Motivation Traffic congestion big issues in traffic management Solution explore traffic patterns Several data sources for traffic monitoring cctv, inductive loop, fcd Floating car data reliable data source for traffic information
4 Research Goal Visual exploration of traffic congestion patterns in spatial and temporal dimension. When Where How long

5 Background What is traffic congestion? Classification of traffic? Traffic Congestion : Road volume > Road capacity Classification : Recurrent traffic congestion Non-recurrent traffic congestion Identified by : Speed, Travel time, Density
6 Background What is floating car data? How to get it? Floating Car Data : Collect real-time traffic data from vehicles Methods : FCD based on GPS systems FCD based on cellular phones
7 State of the Art What is visual analytics? Data mining and visualization? Visual Data Exploration User Interaction Mapping Visualization Transformation Data Model Building Model Visualization Knowledge Data Mining Models Automated Data Analysis Parameter refinement Feedback loop

8 Related Works 1. X. Liu, et al (2012) used FCD data from 6000 taxis in Changsha city to detect urban traffic in road network by using road joint_road section_zone model. As a result, 12.7% roads are in heavy congestion degree which mainly concentrated in center zone, AM is the morning peak and PM is the evening peak hour.
9 Related Works 2. Lin Xu, Yang Yue and Qingquan Li (2013) proposed a FCD analysis method for congestion exploration based on data cube by using FCD dataset from about 1,200 taxis for one week.
10 General Workflow Methodological Framework FCD set Data Filtering and Map Matching Travel Speed Estimation of Road Segments Congestion Event Identification Traffic Congestion Visualization Traffic Congestion Patterns and Analysis
 Test")
11 Study area (Shanghai) Test Data
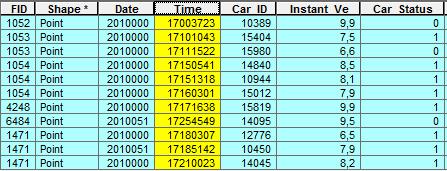
12 Test Data Set Fieldname Field Value Details Date digits number Time digits number Car ID The unique ID of the taxi, 5 digits Company Code QS Initials of the taxi company Driving Direction 6 Direction in 2 digits Longitude in degree; accurate to the 6th decimal place Latitude in degree; accurate to the 6th decimal place Instaneous Velocity 34.9 accurate to 0.1 km/h Instaneous Altitude 255 accurate to 1 m Car Status 0 0 for empty; 1 otherwise GPS Effectiveness 0 1 for effective; 0 otherwise Record Time Stamp :07:17 In form of YYYY-MM-DD hh:mm:ss

13 Pre-processing of FCD Filtering Map matching


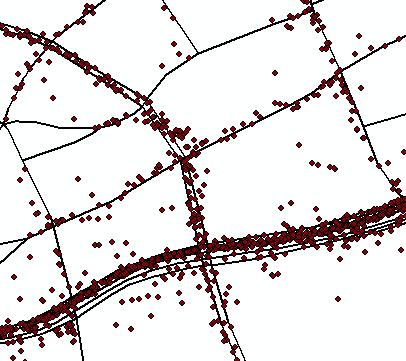
14 Point Density Mapping Density estimation by using Kernel Density Method GPS points density is calculated based on the instaneous velocity with search radius 20 meters.

15 Line Density Mapping Line-density method is used to determine the frequently used road segment. Trajectories from each taxi are used to calculate the line density with search radius 20 m.
16 Density Mapping Analysis From the result of the point density mapping, the highest density are mostly in the elevated roads/expressway. The frequently used of road segment are also on the expressway/elevated roads.

17 Density Mapping of Stop Taxis Clustering for stop taxis is used to visualize the stop taxi patterns. GPS points which have instaneous velocity less than 5 km/h are used. Only taxis which have passengers are used. Grid base clustering is used.
18 Visualization of traffic congestion on road network Identification of traffic congestion is based on the travel speed, and classify by using classification proposed by Duan, et al (2009) Road type State 1 State 2 State 3 State 4 State 5 Elevated road < Expressway < Main arterial road < Arterial road < Collector road < Branch road < For each road segment, the GPS points which located near the road segments were aggregated to calculate the mean speed to identified the congestion and to calculate the duration of congestion. > 75 > 75 > 40 > 40 > 33 > 33


19 Visualization Methods Visualization of traffic congestion on road network
20 Analysis of Visualization on Road Network Congested roads could be easily pointed on the map by using different color for each level. The distribution of congested road and high density taxis in spatial dimension could be easily depicted on the map. The heavy congested roads also have the highest density of the taxis.

21 3D visualization by Using Extrusion Graph Using the data from the traffic congestion visualization on the road network. Different color is used to differentiate the level of congestion, and the height is used to visualize the average velocity.
22 Analysis of 3D Extrusion By using this visualization, the differences between each level of traffic congestion will be shown clearly by using different color. Interesting pattern between traffic congestion level and average velocity could be extracted, which is the highest the average velocity the lowest probability the road will be congested.

23 Animation using Time Slider Using sequential maps from the result of traffic congestion on the road network. It shows temporal changes of the traffic congestion events.
24 Analysis of Time Slider Animation From time slider animation, the changes of the traffic congestion events on the road network could identified for different time interval. Some part of road segment remains the same for different time periods, such as a part of road segment in Yan an Elevated Road with heavy congestion level.

25 MEAN SPEED Result and Analysis Temporal analysis When the peak of traffic congestion? How long? 70 Mean Speed (km/h) in a Day TIME PERIOD
26 Result and Analysis Spatial Analysis Type Traffic Events Percentage Expressway/Elevated Road ,22659 Main Arterial Road ,66079 Arterial Road 238 8,07327 Colector Road 237 8, Traffic congestion mostly occurs in the expressway/elevated roads and the main arterial roads. The Yan an Elevated Road and North South Elevated Road have the most frequent traffic congestion. The Yan an Elevated Road and North South Elevated Road which have the highest density are also have the most frequent traffic congestion.
27 Result and Analysis Spatial Analysis Stop taxis clusters mostly located near the intersections or in the congested roads which shows stop and go traffic patterns. The higher the average velocity, the lower the probability of traffic congestion. Density Mapping and Visualization of traffic congestion on the road network helps to identify traffic congestion in spatial dimension. 3D extrusion graph could be used to visualize two different attributes of the data in the same time window. Animation with time slider could be used to identify changes of the traffic congestion events in both spatial and temporal dimension.
28 Conclusion FCD is a very useful data source to derive information about spatio-temporal pattern of traffic congestion in the city area. Density Mapping and Visualiazation on the road network methods are more suitable to visualize the traffic congestion on spatial dimension. 3D extrusion graph is used to visualize and emphasize two different attributes in the same time window by using coloration and height. Time slider animation is used to show changes of the traffic congestion events both in spatial and temporal dimension. Map-matching and clustering techniques, a suitable time ranges, classfication ranges and visualization methods should be chosen wisely so that the results could really represented the actual condition of the traffic congestion.
29 Questions?
Encapsulating Urban Traffic Rhythms into Road Networks
 Encapsulating Urban Traffic Rhythms into Road Networks Junjie Wang +, Dong Wei +, Kun He, Hang Gong, Pu Wang * School of Traffic and Transportation Engineering, Central South University, Changsha, Hunan,
Improving the travel time prediction by using the real-time floating car data
 Improving the travel time prediction by using the real-time floating car data Krzysztof Dembczyński Przemys law Gawe l Andrzej Jaszkiewicz Wojciech Kot lowski Adam Szarecki Institute of Computing Science,
Where to Find My Next Passenger?
 Where to Find My Next Passenger? Jing Yuan 1 Yu Zheng 2 Liuhang Zhang 1 Guangzhong Sun 1 1 University of Science and Technology of China 2 Microsoft Research Asia September 19, 2011 Jing Yuan et al. (USTC,MSRA)
Exploring the Patterns of Human Mobility Using Heterogeneous Traffic Trajectory Data
 Exploring the Patterns of Human Mobility Using Heterogeneous Traffic Trajectory Data Jinzhong Wang April 13, 2016 The UBD Group Mobile and Social Computing Laboratory School of Software, Dalian University
Identifying Urban Traffic Congestion Pattern from Historical Floating Car Data
 Available online at www.sciencedirect.com ScienceDirect Procedia - Social and Behavioral Scien ce s 96 ( 2013 ) 2084 2095 13th COTA International Conference of Transportation Professionals (CICTP 2013)
PATREC PERSPECTIVES Sensing Technology Innovations for Tracking Congestion
 PATREC PERSPECTIVES Sensing Technology Innovations for Tracking Congestion Drivers have increasingly been using inexpensive mapping applications imbedded into mobile devices (like Google Maps, MapFactor,
DO TAXI DRIVERS CHOOSE THE SHORTEST ROUTES?
 DO TAXI DRIVERS CHOOSE THE SHORTEST ROUTES? A Large-Scale Analysis of Route Choice Behavior of Taxi Drivers Using Floating Car Data in Shanghai Junyan Li Superviors: Juliane Cron M.Sc. (Technische Universität
Tutorial: Urban Trajectory Visualization. Case Studies. Ye Zhao
 Case Studies Ye Zhao Use Cases We show examples of the web-based visual analytics system TrajAnalytics The case study information and videos are available at http://vis.cs.kent.edu/trajanalytics/ Porto
Scalable Analysis of Movement Data for Extracting and Exploring Significant Places
 IEEE TRANSACTIONS ON VISUALIZATION AND COMPUTER GRAPHICS, MANUSCRIPT ID 1 Scalable Analysis of Movement Data for Extracting and Exploring Significant Places Gennady Andrienko, Natalia Andrienko, Christophe
GIS-BASED VISUALIZATION FOR ESTIMATING LEVEL OF SERVICE Gozde BAKIOGLU 1 and Asli DOGRU 2
 Presented at the FIG Congress 2018, May 6-11, 2018 in Istanbul, Turkey GIS-BASED VISUALIZATION FOR ESTIMATING LEVEL OF SERVICE Gozde BAKIOGLU 1 and Asli DOGRU 2 1 Department of Transportation Engineering,
Traffic flows analysis and visualization based on data from an advanced Vilnius traveller s information system
 The 9 th International Conference ENVIRONMENTAL ENGINEERING 22 23 May 2014, Vilnius, Lithuania SELECTED PAPERS eissn 2029-7092 / eisbn 978-609-457-640-9 Available online at http://enviro.vgtu.lt Section:
Driving Restriction, Traffic Congestion, and Air Pollution: Evidence from Beijing
 Driving Restriction, Traffic Congestion, and Air Pollution: Evidence from Beijing Chen Liu Junjie Zhang UC San Diego Camp Resources XXI August 10-12, 2014 Traffic Congestion and Air Pollution 1 Motivation
Detecting Origin-Destination Mobility Flows From Geotagged Tweets in Greater Los Angeles Area
 Detecting Origin-Destination Mobility Flows From Geotagged Tweets in Greater Los Angeles Area Song Gao 1, Jiue-An Yang 1,2, Bo Yan 1, Yingjie Hu 1, Krzysztof Janowicz 1, Grant McKenzie 1 1 STKO Lab, Department
2.1 Traffic Stream Characteristics. Time Space Diagram and Measurement Procedures Variables of Interest
 2.1 Traffic Stream Characteristics Time Space Diagram and Measurement Procedures Variables of Interest Traffic Stream Models 2.1 Traffic Stream Characteristics Time Space Diagram Speed =100km/h = 27.78
Mapcube and Mapview. Two Web-based Spatial Data Visualization and Mining Systems. C.T. Lu, Y. Kou, H. Wang Dept. of Computer Science Virginia Tech
 Mapcube and Mapview Two Web-based Spatial Data Visualization and Mining Systems C.T. Lu, Y. Kou, H. Wang Dept. of Computer Science Virginia Tech S. Shekhar, P. Zhang, R. Liu Dept. of Computer Science University
PERFORMANCE of traffic flow along corridors is of
 Assessing Traffic Performance using Position Density of Sparse FCD Anita Graser, Wolfgang Ponweiser, Melitta Dragaschnig, Norbert Brändle and Peter Widhalm Abstract We present an approach for evaluating
Visualization of Trajectory Attributes in Space Time Cube and Trajectory Wall
 Visualization of Trajectory Attributes in Space Time Cube and Trajectory Wall Gennady Andrienko, Natalia Andrienko, Heidrun Schumann and Christian Tominski Abstract Space time cube is often used as a visualization
Visualisation of Spatial Data
 Visualisation of Spatial Data VU Visual Data Science Johanna Schmidt WS 2018/19 2 Visual Data Science Introduction to Visualisation Basics of Information Visualisation Charts and Techniques Introduction
Traffic Demand Forecast
 Chapter 5 Traffic Demand Forecast One of the important objectives of traffic demand forecast in a transportation master plan study is to examine the concepts and policies in proposed plans by numerically
OPTIMIZATION OF TRAFFIC SAFETY ON RURAL ROADS BY TRAFFIC DATA BASED STRATEGIES
 OPTIMIZATION OF TRAFFIC SAFETY ON RURAL ROADS BY TRAFFIC DATA BASED STRATEGIES STEFFEN AXER, BERNHARD FRIEDRICH INSTITUTE OF TRANSPORTATION AND URBAN ENGINEERING TECHNISCHE UNIVERSITÄT BRAUNSCHWEIG This
Exploring Human Mobility with Multi-Source Data at Extremely Large Metropolitan Scales. ACM MobiCom 2014, Maui, HI
 Exploring Human Mobility with Multi-Source Data at Extremely Large Metropolitan Scales Desheng Zhang & Tian He University of Minnesota, USA Jun Huang, Ye Li, Fan Zhang, Chengzhong Xu Shenzhen Institute
Implementing Visual Analytics Methods for Massive Collections of Movement Data
 Implementing Visual Analytics Methods for Massive Collections of Movement Data G. Andrienko, N. Andrienko Fraunhofer Institute Intelligent Analysis and Information Systems Schloss Birlinghoven, D-53754
Activity Identification from GPS Trajectories Using Spatial Temporal POIs Attractiveness
 Activity Identification from GPS Trajectories Using Spatial Temporal POIs Attractiveness Lian Huang, Qingquan Li, Yang Yue State Key Laboratory of Information Engineering in Survey, Mapping and Remote
Measuring Social Functions of City Regions from Large-scale Taxi Behaviors
 Work in Progress workshop at PerCom 2 Measuring Social Functions of City Regions from Large-scale Taxi Behaviors Guande Qi, Xiaolong Li, Shijian Li, Gang Pan and Zonghui Wang Department of Computer Science
Coimisiún na Scrúduithe Stáit State Examinations Commission. Leaving Certificate Examination Mathematics
 2017. M30 Coimisiún na Scrúduithe Stáit State Examinations Commission Leaving Certificate Examination 2017 Mathematics Paper 2 Higher Level Monday 12 June Morning 9:30 12:00 300 marks Examination number
Xiaoguang Wang, Assistant Professor, Department of Geography, Central Michigan University Chao Liu,
 Xiaoguang Wang, Email: wang9x@cmich.edu Assistant Professor, Department of Geography, Central Michigan University Chao Liu, Email: cliu8@umd.edu Research Associate, National Center for Smart Growth, Research
Refinement of the OECD regional typology: Economic Performance of Remote Rural Regions
 [Preliminary draft April 2010] Refinement of the OECD regional typology: Economic Performance of Remote Rural Regions by Lewis Dijkstra* and Vicente Ruiz** Abstract To account for differences among rural
WEATHER IMPACT. on FLOATING CAR DATA
 WEATHER IMPACT on FLOATING CAR DATA Alexander Sohr Research Scientist, DLR Institute of Transportation Systems Rutherfordstr. 2, 12489 Berlin, Germany TEL +49 3 67 55 458, FAX +49 3 67 55 291, alexander.sohr@dlr.de
INTRODUCTION PURPOSE DATA COLLECTION
 DETERMINATION OF VEHICLE OCCUPANCY ON THE KATY AND NORTHWEST FREEWAY MAIN LANES AND FRONTAGE ROADS Mark Ojah and Mark Burris Houston Value Pricing Project, March 2004 INTRODUCTION In the late 1990s, an
Real-Time Travel Time Prediction Using Multi-level k-nearest Neighbor Algorithm and Data Fusion Method
 1861 Real-Time Travel Time Prediction Using Multi-level k-nearest Neighbor Algorithm and Data Fusion Method Sehyun Tak 1, Sunghoon Kim 2, Kiate Jang 3 and Hwasoo Yeo 4 1 Smart Transportation System Laboratory,
Phys 111 Exam 1 September 19, You cannot use CELL PHONES, ipad, IPOD... Good Luck!!! Name Section University ID
 Phys 111 Exam 1 September 19, 2017 Name Section University ID Please fill in your computer answer sheet as follows: 1) In the NAME grid, fill in your last name, leave one blank space, then your first name.
Data Mining II Mobility Data Mining
 Data Mining II Mobility Data Mining F. Giannotti& M. Nanni KDD Lab ISTI CNR Pisa, Italy Outline Mobility Data Mining Introduction MDM methods MDM methods at work. Understanding Human Mobility Clustering
Modelling, Simulation & Computing Laboratory (msclab) Faculty of Engineering, Universiti Malaysia Sabah, Malaysia
 Faculty of Engineering, Universiti Malaysia Sabah, Malaysia") 1.0 Introduction Intelligent Transportation Systems (ITS) Long term congestion solutions Advanced technologies Facilitate complex transportation systems Dynamic Modelling of transportation (on-road traffic):
1.0 Introduction Intelligent Transportation Systems (ITS) Long term congestion solutions Advanced technologies Facilitate complex transportation systems Dynamic Modelling of transportation (on-road traffic):
Towards Fully-automated Driving
 Towards Fully-automated Driving Challenges and Potential Solutions Dr. Gijs Dubbelman Mobile Perception Systems EE-SPS/VCA Mobile Perception Systems 6 PhDs, postdoc, project manager, software engineer,
A route map to calibrate spatial interaction models from GPS movement data
 A route map to calibrate spatial interaction models from GPS movement data K. Sila-Nowicka 1, A.S. Fotheringham 2 1 Urban Big Data Centre School of Political and Social Sciences University of Glasgow Lilybank
Evgeny Spodarev. Institute of Stochastics
 of city road traffic Modelling, simulation and prediction of city road traffic CURANDO Evgeny Spodarev Institute of Stochastics UNIVERSITÄT ULM SCIENDO DOCENDO Joint work with Hans Braxmeier and Volker
Understanding taxi travel demand patterns through Floating Car Data Nuzzolo, A., Comi, A., Papa, E. and Polimeni, A.
 WestminsterResearch http://www.westminster.ac.uk/westminsterresearch Understanding taxi travel demand patterns through Floating Car Data Nuzzolo, A., Comi, A., Papa, E. and Polimeni, A. A paper presented
Exploring Urban Mobility from Taxi Trajectories: A Case Study of Nanjing, China
 Exploring Urban Mobility from Taxi Trajectories: A Case Study of Nanjing, China Yihong Yuan and Maël Le Noc Department of Geography, Texas State University, San Marcos, TX, U.S.A. {yuan, mael.lenoc}@txstate.edu
Belief Propagation for Traffic forecasting
 Belief Propagation for Traffic forecasting Cyril Furtlehner (INRIA Saclay - Tao team) context : Travesti project http ://travesti.gforge.inria.fr/) Anne Auger (INRIA Saclay) Dimo Brockhoff (INRIA Lille)
Fusion of xfcd and local road weather data for a reliable determination of the road surface condition SIRWEC Prague 2008
 Fusion of xfcd and local road weather data for a reliable determination of the road surface condition SIRWEC Prague 2008 Alexander Dinkel, Axel Leonhardt Technische Universität München Chair of Traffic
Exploring Urban Mobility from Taxi Trajectories: A Case Study of Nanjing, China
 Exploring Urban Mobility from Taxi Trajectories: A Case Study of Nanjing, China Yihong Yuan, Maël Le Noc Department of Geography, Texas State University,San Marcos, TX, USA {yuan, mael.lenoc}@ txstate.edu
Spontaneous Jam Formation
 Highway Traffic Introduction Traffic = macroscopic system of interacting particles (driven or self-driven) Nonequilibrium physics: Driven systems far from equilibrium Collective phenomena physics! Empirical
Texas A&M University
 Texas A&M University CVEN 658 Civil Engineering Applications of GIS Hotspot Analysis of Highway Accident Spatial Pattern Based on Network Spatial Weights Instructor: Dr. Francisco Olivera Author: Zachry
Visual Exploration of Sparse Traffic Trajectory Data
 IEEE TRANSACTIONS ON VISUALIZATION AND COMPUTER GRAPHICS, VOL. 20, NO. 12, DECEM BER 2014 1813 Visual Exploration of Sparse Traffic Trajectory Data Zuchao Wang, Tangzhi Ye, Min Lu, Xiaoru Yuan, Member,
LABELING RESIDENTIAL COMMUNITY CHARACTERISTICS FROM COLLECTIVE ACTIVITY PATTERNS USING TAXI TRIP DATA
 LABELING RESIDENTIAL COMMUNITY CHARACTERISTICS FROM COLLECTIVE ACTIVITY PATTERNS USING TAXI TRIP DATA Yang Zhou 1, 3, *, Zhixiang Fang 2 1 Wuhan Land Use and Urban Spatial Planning Research Center, 55Sanyang
Network Equilibrium Models: Varied and Ambitious
 Network Equilibrium Models: Varied and Ambitious Michael Florian Center for Research on Transportation University of Montreal INFORMS, November 2005 1 The applications of network equilibrium models are
Traffic Flow Simulation using Cellular automata under Non-equilibrium Environment
 Traffic Flow Simulation using Cellular automata under Non-equilibrium Environment Hideki Kozuka, Yohsuke Matsui, Hitoshi Kanoh Institute of Information Sciences and Electronics, University of Tsukuba,
Assessing the uncertainty in micro-simulation model outputs
 Assessing the uncertainty in micro-simulation model outputs S. Zhu 1 and L. Ferreira 2 1 School of Civil Engineering, Faculty of Engineering, Architecture and Information Technology, The University of
Extracting mobility behavior from cell phone data DATA SIM Summer School 2013
 Extracting mobility behavior from cell phone data DATA SIM Summer School 2013 PETER WIDHALM Mobility Department Dynamic Transportation Systems T +43(0) 50550-6655 F +43(0) 50550-6439 peter.widhalm@ait.ac.at
Validation of ATIS Journey Time and Traffic Speed Estimates by Floating Car Survey
 Validation of ATIS Journey Time and Traffic Speed Estimates by Floating Car Survey Mei Lam TAM a, William H.K. LAM b a,b Department of Civil and Environmental Engineering, The Hong Kong Polytechnic University,
GIScience & Mobility. Prof. Dr. Martin Raubal. Institute of Cartography and Geoinformation SAGEO 2013 Brest, France
 GIScience & Mobility Prof. Dr. Martin Raubal Institute of Cartography and Geoinformation mraubal@ethz.ch SAGEO 2013 Brest, France 25.09.2013 1 www.woodsbagot.com 25.09.2013 2 GIScience & Mobility Modeling
City-wide examining transport network accessibility using taxi GPS data
 City-wide examining transport network accessibility using taxi GPS data Jianxun Cui 1, Feng Liu 2,3, Davy Janssens 2, An Shi 1 and Geert Wets 2 1 School of Transportation Science and Engineering, Harbin
Analysis Based on SVM for Untrusted Mobile Crowd Sensing
 Analysis Based on SVM for Untrusted Mobile Crowd Sensing * Ms. Yuga. R. Belkhode, Dr. S. W. Mohod *Student, Professor Computer Science and Engineering, Bapurao Deshmukh College of Engineering, India. *Email
Variable Speed Approach for Congestion Alleviation on Boshporus Bridge Crossing
 Variable Speed Approach for Congestion Alleviation on Boshporus Bridge Crossing A. Akbas a,1, V. Topuz a,1, H.H. Celik b,2 and M. Ergun c,3 a University of Marmara, Vocational High School of Technical
Urban Traffic Speed Management: The Use of GPS/GIS
 Urban Traffic Speed Management: The Use of GPS/GIS Keywords: Speed Management, Traffic Congestion, Urban Traffic Flow, Geographical Information System (GIS), Global Positioning System (GPS) SUMMARY The
Estimating the vehicle accumulation: Data-fusion of loop-detector flow and floating car speed data
 Estimating the vehicle accumulation: Data-fusion of loop-detector flow and floating car speed data Paul B.C. van Erp (corresponding author) Victor L. Knoop Serge P. Hoogendoorn Department of Transport
Map Matching Algorithms in GPS Navigating System and Their Functions
 Map Matching Algorithms in GPS Navigating System and Their Functions Abstract R.Kamalambal (M.Phil. Student) Department of computer science & Technology Kajamalai Campus, Bharathidasan University, Trichy,
Visual Analytics ofmovement
 Gennady Andrienko. Natalia Andrienko Peter Bak Daniel Keim Stefan Wrobel Visual Analytics ofmovement ~ Springer Contents 1 Introduction... 1 1.1 A Single Trajectory.....................................
Development of the Probe Information Based System PROROUTE
 Development of the Probe Information Based System PROROUTE YAO Enjian, SATO Akinori Abstract PROROUTE is a dynamic route guidance system based on the probe information, currently under development by the
IMPROVING INFRASTRUCTURE FOR TRANSPORTATION SYSTEMS USING CLUSTERING
 IMPROVING INFRASTRUCTURE FOR TRANSPORTATION SYSTEMS USING CLUSTERING Presented By: Apeksha Aggarwal Research Scholar, C.S.E. Department, IIT Roorkee Supervisor: Dr. Durga Toshniwal Associate Professor,
Travel Time Calculation With GIS in Rail Station Location Optimization
 Travel Time Calculation With GIS in Rail Station Location Optimization Topic Scope: Transit II: Bus and Rail Stop Information and Analysis Paper: # UC8 by Sutapa Samanta Doctoral Student Department of
VISUALIZATION OF SPATIO-TEMPORAL RELATIONS IN MOVEMENT EVENT USING MULTI-VIEW
 VISUALIZATION OF SPATIO-TEMPORAL RELATIONS IN MOVEMENT EVENT USING MULTI-VIEW Kun Zheng, Danpeng Gu*, Falin Fang, Yanghui Wang, Hongyu Liu, Wenyu Zhao, Miao Zhang, Qi Li Faculty of Information and Engineering,
TEEN DRIVER SEAT BELT OBSERVATION FORM
 TEEN DRIVER SEAT BELT OBSERVATION FORM High Schools will count only teen drivers and passengers. If the vehicle is being driven by an adult, only count teen passengers. DO NOT notify students that counts
Extracting Patterns of Individual Movement Behaviour from a Massive Collection of Tracked Positions
 Extracting Patterns of Individual Movement Behaviour from a Massive Collection of Tracked Positions Gennady Andrienko and Natalia Andrienko Fraunhofer Institute IAIS Schloss Birlinghoven, 53754 Sankt Augustin,
QUANTIFICATION OF THE NATURAL VARIATION IN TRAFFIC FLOW ON SELECTED NATIONAL ROADS IN SOUTH AFRICA
 QUANTIFICATION OF THE NATURAL VARIATION IN TRAFFIC FLOW ON SELECTED NATIONAL ROADS IN SOUTH AFRICA F DE JONGH and M BRUWER* AECOM, Waterside Place, Tygerwaterfront, Carl Cronje Drive, Cape Town, South
Spatial Extension of the Reality Mining Dataset
 R&D Centre for Mobile Applications Czech Technical University in Prague Spatial Extension of the Reality Mining Dataset Michal Ficek, Lukas Kencl sponsored by Mobility-Related Applications Wanted! Urban
City monitoring with travel demand momentum vector fields: theoretical and empirical findings
 City monitoring with travel demand momentum vector fields: theoretical and empirical findings Xintao Liu 1, Joseph Y.J. Chow 2 1 Department of Civil Engineering, Ryerson University, Canada 2 Tandon School
Addis Ababa University Addis Ababa Institute of Technology School Of Mechanical and Industrial Engineering Extension Division` Assignment 1
 Assignment 1 1. Vehicle B is stopped at a traffic light, as shown in the figure. At the instant that the light turns green, vehicle B starts to accelerate at 0.9144m/s 2. At this time vehicle A is 91.44m
Urban Computing Using Big Data to Solve Urban Challenges
 Urban Computing Using Big Data to Solve Urban Challenges Dr. Yu Zheng Lead Researcher, Microsoft Research Asia Chair Professor at Shanghai Jiaotong University http://research.microsoft.com/en-us/projects/urbancomputing/default.aspx
Predicting Link Travel Times from Floating Car Data
 MITSUBISHI ELECTRIC RESEARCH LABORATORIES http://www.merl.com Predicting Link Travel Times from Floating Car Data Jones, M.; Geng, Y.; Nikovski, D.; Hirata, T. TR2013-095 October 2013 Abstract We study
DP Project Development Pvt. Ltd.
 Dear Sir/Madam, Greetings!!! Thanks for contacting DP Project Development for your training requirement. DP Project Development is leading professional training provider in GIS technologies and GIS application
Validating general human mobility patterns on massive GPS data
 Validating general human mobility patterns on massive GPS data Luca Pappalardo, Salvatore Rinzivillo, Dino Pedreschi, and Fosca Giannotti KDDLab, Institute of Information Science and Technologies (ISTI),
A framework for spatio-temporal clustering from mobile phone data
 A framework for spatio-temporal clustering from mobile phone data Yihong Yuan a,b a Department of Geography, University of California, Santa Barbara, CA, 93106, USA yuan@geog.ucsb.edu Martin Raubal b b
GIS ANALYSIS METHODOLOGY
 GIS ANALYSIS METHODOLOGY No longer the exclusive domain of cartographers, computer-assisted drawing technicians, mainframes, and workstations, geographic information system (GIS) mapping has migrated to
Visual Analytics for Transportation: State of the Art and Further Research Directions
 Visual Analytics for Transportation: State of the Art and Further Research Directions Gennady Andrienko, Natalia Andrienko, Wei Chen, Ross Maciejewski, and Ye Zhao Abstract Many cities and countries are
TEEN DRIVER ELECTRONIC DEVICE OBSERVATION FORM
 TEEN OBSERVATION FORM High Schools will count only teen drivers. If your school does not have many teen drivers, please use the Junior High form to count adult drivers. Choose a day to conduct your pre-observations.
VHD Daily Totals. Population 14.5% change. VMT Daily Totals Suffolk 24-hour VMT. 49.3% change. 14.4% change VMT
 6.9 Suffolk 6-54 VMT Population and Travel Characteristics Population 14.5% change 2014 1,529,202 VHD Daily Totals 2014 251,060 49.3% change 2040 1,788,175 2040 374,850 VMT Daily Totals 2014 39,731,990
Caesar s Taxi Prediction Services
 1 Caesar s Taxi Prediction Services Predicting NYC Taxi Fares, Trip Distance, and Activity Paul Jolly, Boxiao Pan, Varun Nambiar Abstract In this paper, we propose three models each predicting either taxi
arxiv: v1 [cs.cv] 28 Nov 2017
![arxiv: v1 [cs.cv] 28 Nov 2017](/thumbs/90/103039080.jpg "arxiv: v1 [cs.cv] 28 Nov 2017") A fatal point concept and a low-sensitivity quantitative measure for traffic safety analytics arxiv:1711.10131v1 [cs.cv] 28 Nov 2017 Shan Suthaharan Department of Computer Science University of North Carolina
A fatal point concept and a low-sensitivity quantitative measure for traffic safety analytics arxiv:1711.10131v1 [cs.cv] 28 Nov 2017 Shan Suthaharan Department of Computer Science University of North Carolina
Twitter s Effectiveness on Blackout Detection during Hurricane Sandy
 Twitter s Effectiveness on Blackout Detection during Hurricane Sandy KJ Lee, Ju-young Shin & Reza Zadeh December, 03. Introduction Hurricane Sandy developed from the Caribbean stroke near Atlantic City,
2011 South Western Region Travel Time Monitoring Program Congestion Management Process. Executive Summary
 2011 South Western Region Travel Monitoring Program Executive Summary Prepared by: South Western Regional Planning Agency 888 Washington Blvd, 3rd Floor Stamford, CT 06901 Telephone: 203.6.5190 Facsimile:
In-class determine between which cube root. Assignments two consecutive whole
 Unit 1: Expressions Part A: Powers and Roots (2-3 Weeks) Essential Questions How can algebraic expressions be used to model, analyze, and solve mathematical situations? I CAN Statements Vocabulary Standards
IV Course Spring 14. Graduate Course. May 4th, Big Spatiotemporal Data Analytics & Visualization
 Spatiotemporal Data Visualization IV Course Spring 14 Graduate Course of UCAS May 4th, 2014 Outline What is spatiotemporal data? How to analyze spatiotemporal data? How to visualize spatiotemporal data?
Measurement of human activity using velocity GPS data obtained from mobile phones
 Measurement of human activity using velocity GPS data obtained from mobile phones Yasuko Kawahata 1 Takayuki Mizuno 2 and Akira Ishii 3 1 Graduate School of Information Science and Technology, The University
Generating Urban Mobility Data Sets Using Scalable GANs
 Generating Urban Mobility Data Sets Using Scalable GANs Abhinav Jauhri & John Paul Shen ECE Department Carnegie Mellon University {ajauhri, jpshen}@cmu.edu Objective Generate city-scale human mobility
TOP: Vehicle Trajectory based Driving Speed Optimization Strategy for Travel Time Minimization and Road Congestion Avoidance
 TOP: Vehicle Trajectory based Driving Speed Optimization Strategy for Travel Time Minimization and Road Congestion Avoidance Authors: Li Yan and Haiying Shen Presenter: Ankur Sarker IEEE MASS Brasília,
Uncovering the Digital Divide and the Physical Divide in Senegal Using Mobile Phone Data
 Uncovering the Digital Divide and the Physical Divide in Senegal Using Mobile Phone Data Song Gao, Bo Yan, Li Gong, Blake Regalia, Yiting Ju, Yingjie Hu STKO Lab, Department of Geography, University of
`Name: Period: Unit 4 Modeling with Advanced Functions
 `Name: Period: Unit 4 Modeling with Advanced Functions 1 2 Piecewise Functions Example 1: f 1 3 2 x, if x) x 3, if ( 2 x x 1 1 For all x s < 1, use the top graph. For all x s 1, use the bottom graph Example
Estimating traffic delays and network speeds from lowfrequency GPS taxis traces for urban transport modelling
 EJTIR Issue 15(4), 2015 pp. 639-661 ISSN: 1567-7141 tlo.tbm.tudelft.nl/ejtir Estimating traffic delays and network speeds from lowfrequency GPS taxis traces for urban transport modelling Bin Deng 1 Martin
City of Hermosa Beach Beach Access and Parking Study. Submitted by. 600 Wilshire Blvd., Suite 1050 Los Angeles, CA
 City of Hermosa Beach Beach Access and Parking Study Submitted by 600 Wilshire Blvd., Suite 1050 Los Angeles, CA 90017 213.261.3050 January 2015 TABLE OF CONTENTS Introduction to the Beach Access and Parking
How to Construct Urban Three Dimensional GIS Model based on ArcView 3D Analysis
 How to Construct Urban Three Dimensional GIS Model based on ArcView 3D Analysis Ko Ko Lwin Division of Spatial Information Science Graduate School of Life and Environmental Sciences University of Tsukuba
Quantum Computing at Volkswagen: Traffic Flow Optimization using the D-Wave Quantum Annealer
 Quantum Computing at Volkswagen: Traffic Flow Optimization using the D-Wave Quantum Annealer D-Wave Users Group Meeting - National Harbour, MD 27.09.2017 Dr. Gabriele Compostella The Volkswagen Data:Lab
Crowd Sensing of Traffic Anomalies based on Human Mobility and Social Media
 Crowd Sensing of Traffic Anomalies based on Human Mobility and Social Media Bei Pan 1 Yu Zheng 2 David Wilkie 3 Cyrus Shahabi 1 1 University of Southern California, Los Angeles, USA 2 Microsoft Research,
Spatial Variation in Local Road Pedestrian and Bicycle Crashes
 2015 Esri International User Conference July 20 24, 2015 San Diego, California Spatial Variation in Local Road Pedestrian and Bicycle Crashes Musinguzi, Abram, Graduate Research Assistant Chimba,Deo, PhD.,
City form and its macroscopic fundamental diagram
 Research Collection Presentation City form and its macroscopic fundamental diagram Author(s): Axhausen, Kay W. Publication Date: 2018-06 Permanent Link: https://doi.org/10.3929/ethz-b-000267750 Rights
Open Notify API. Release 0.2. Nathan Bergey
 Open Notify API Release 0.2 Nathan Bergey Mar 15, 2017 Contents 1 International Space Station Current Location 3 2 International Space Station Pass Predictions 5 3 Open APIs From Space 7 3.1 APIs:...................................................
A Computational Movement Analysis Framework For Exploring Anonymity In Human Mobility Trajectories
 A Computational Movement Analysis Framework For Exploring Anonymity In Human Mobility Trajectories Jennifer A. Miller 2015 UT CID Report #1512 This UT CID research was supported in part by the following
Research Article Urban Mobility Dynamics Based on Flexible Discrete Region Partition
 International Journal of Distributed Sensor Networks, Article ID 782649, 1 pages http://dx.doi.org/1.1155/214/782649 Research Article Urban Mobility Dynamics Based on Flexible Discrete Region Partition
Research Article Impacts of Snowy Weather Conditions on Expressway Traffic Flow Characteristics
 Discrete Dynamics in Nature and Society Volume 2013, Article ID 791743, 6 pages http://dx.doi.org/10.1155/2013/791743 Research Article Impacts of Snowy Weather Conditions on Expressway Traffic Flow Characteristics
Date: Location: Den Haag - Nootdorp. Yufei Yuan Aurélien Duret Hans van Lint. Conference on Traffic and Granular Flow 15
 Network-wide mesoscopic traffic state estimation based on a variational formulation of the LWR model and using both Lagrangian and Eulerian observations Yufei Yuan Aurélien Duret Hans van Lint Date: 28-10-2015