Exploring Human Mobility with Multi-Source Data at Extremely Large Metropolitan Scales. ACM MobiCom 2014, Maui, HI
|
|
|
- MargaretMargaret Stokes
- 6 years ago
- Views:
Transcription


1 Exploring Human Mobility with Multi-Source Data at Extremely Large Metropolitan Scales Desheng Zhang & Tian He University of Minnesota, USA Jun Huang, Ye Li, Fan Zhang, Chengzhong Xu Shenzhen Institute of Advanced Technology, China ACM MobiCom 2014, Maui, HI 1
2 Outline Introduction Design Evaluation Application Conclusion 2


3 Human Mobility Patterns Mobile Networking Location Based Services Real-time Navigation Transit Services Social Networking Mobile Networking Location Based Services Real-Time Navigation Transit Services Social Networking 3

 Cell Tower")
")


4 Human Location Tracking Devices GPS Devices Cellphones by Call Detail Records (CDR) Cell Tower Levels Automatic Fare Collection System (AFC) Station Levels: Subways, Buses, Taxicabs Massive Empirical Data Collection Onboard GPS Cellphone Subway Station Bus Taxi 4


5 Empirical Mobility Data Empirical Data for Mobility Modeling Large Scale Fine Granularity Long Collection Period Taxicab Passengers in Shenzhen 5
6 Human Mobility Models Legacy Mobility Models: MobiCom 03: Obstacles based Mobility Model by Jardosh et al. MobiCom 04: Weighted Waypoint Model by Hsu et al. MobiCom 07: Mobility Modeling in Bus-based DTN: Zhang et al. UbiComp 11: Mobility Modeling with Smartcards: Lathia et al. KDD 11: Mobility in Social Networks: Cho et al. MobiSys 12: Cellphone based Mobility Model: Isaacman et al. MobiCom 13: Residence Time Prediction: Baumann et al. MobiCom 13: Ballistic Model: Bogo et al. Models based on Single-Source Data Cellphone One Kind of Urban Transit Taxicab, Subway or Bus 6
7 Common Drawback: Biased Sampling Using Residents in Single-Source Data as a Sample for ALL 7
8 Common Drawback: Biased Sampling Using Residents in Single-Source Data as a Sample for ALL Introducing a Bias against Residents not Involved 7


9 Models Based on Cellphone Data Use Residents with cellphone activities as a Sample for all Biased against Residents without cellphone activities Biased Sample 9


10 Models Based on Transit Data Use a type of Passengers (e.g., taxicab) as a sample Biased against Residents using other transit Sample Biased Biased Biased Taxi Passengers Bus Passengers Subway Passengers Private Cars 10
11 Visualizing Biased Sampling with Mobility Graph Vertex: a Urban Region Vertex Size: Number of Mobile Residents Edge: Mobility between a Pair of Regions Edge thickness: Mobility Volume Mobility Volume Urban Region Urban Region Number of Residents Urban Region 11
12 Mobility Graph based on Cellphone Data Urban Region Urban Region Industrial 12 Colors: Different Urban Districts


13 Biased Low Industrial Cellphone Mobility High Industrial Transit Mobility 13 (Subway+Bus+Taxi)
14 Possible Solution: Multi-Source Data Quick Expansion of Urban Infrastructures Enabling Multi-Source Data to address biased sampling Integrating Transit Networks with Cellular networks Subway Network SmartCard Data Bus Network Taxicab Network Bus Data Taxicab Data Multi-Source Data Cellular Network Cellphone Dataset Cellphone Data 14
15 Contributions Mitigating biased sampling in single-source data by crossreferencing multi-source data Analyzing spatial-temporal dynamics of multi-source data to infer real-time mobility Designing the first generic architecture mpat for mobility modeling, separating low level data collection and high level service design Implementing mpat with extremely large-scale multi-source data capturing 10 million residents in Shenzhen Enabling an inter-region mobility inference with a 75% accuracy Developing a transit service based on inferred inter-region mobility to reduce 46% of passenger travel time 15
16 Outline Introduction Design Evaluation Application Conclusion 16
17 mpat Architecture Application Design Layer Wi-Fi AP Deployment Cell Tower Depolyment Ad hoc Networking Inter- Region Transit Mobility Abstraction Layer Mobility Abstraction Real-Time Data Feed Layer Cellular Data Feed Taxicab Data Feed Bus Data Feed Subway Data Feed Urban Infrastructures (Taxicabs, Buses, Subway, Cellular Networks) 17
18 Data Feed Layer: Overview Data Feeding Data Managing Data Storing Data Cleaning Data Protecting 18


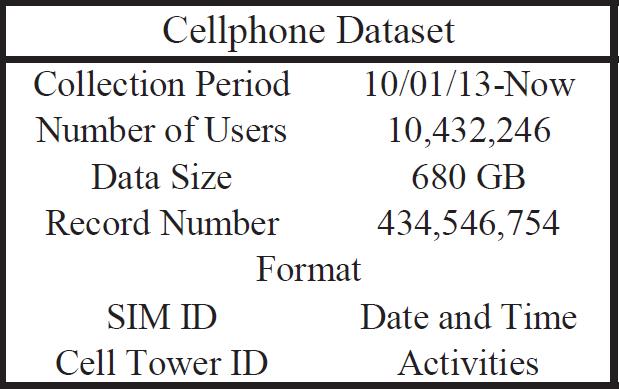
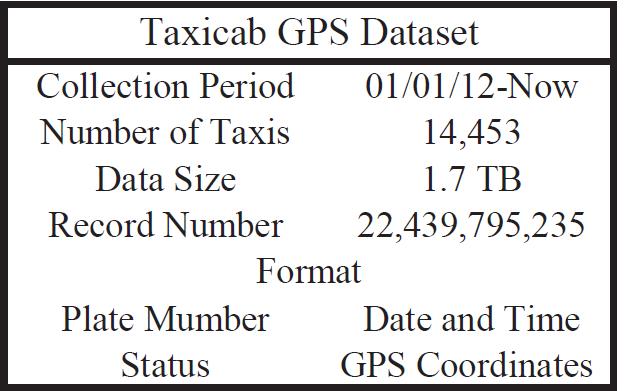
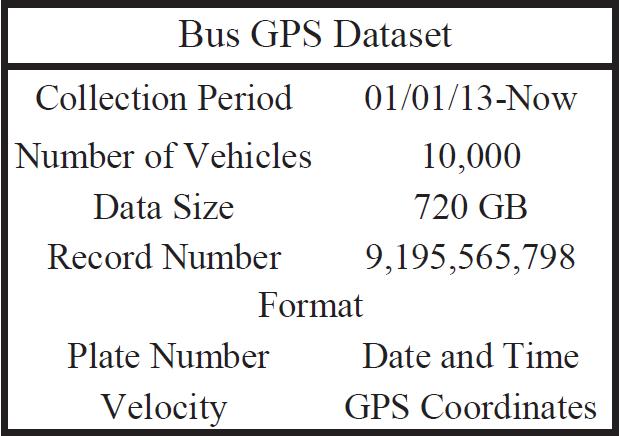
19 Data Feeding Close Collaboration Shenzhen Government Agencies A Reliable Feeding Mechanism Cellphones: CDRs for 10.4 Million Users Smart Cards: Fare Transactions for 16 Million Users Taxicabs: GPS for 14 Thousand Taxicabs Buses: GPS for 10 Thousand Buses Shenzhen Transport Commission 19


 Pig and")
20 Data Managing Hardware: 11 Node Cluster with 34 TB Storage Node with 32 Cores and 32 GB RAM Software: Hadoop Distributed File System (HDFS) Pig and Hive Cluster in Shenzhen 20

21 Data Storing 21


22 Data Cleaning Errant Data in mpat Errant GPS Data Duplicated Data Data with Logical Errors Missing Data 11% of Data Removed Raw GPS Removing Errant and Duplicated GPS Map Matching 22


23 Data Protecting: Privacy Anonymization: Anonymizing All Data Replacing IDs with Serial Numbers Minimal Exposure: Processing Mobility Info Only Dropping Other Info Aggregation: Presenting Mobility in Aggregation Not Focusing on Individual Users 23
24 Mobility Abstraction Layer: Overview Trip Extraction Spatial and Temporal Characteristic Analysis Urban Region Partition Inter-Region Mobility Inference 24
25 Trip Extraction Cellphone User Trips Obtaining trips by a continuous trace of cellphone towers associated CDRs for the same user Taxicab Passenger Trips By finding pickup and related dropoff locations Bus Passenger Trips By finding boarding and alighting bus stations Subway Passenger Trips By finding entering and exiting metro stations Details in the paper 25

26 Trip Extraction Cell User Origin Bus/Sub Passenger Origin Taxi Passenger Destination Taxi Passenger Origin Cell User Destination Bus/Sub Passenger Destination 26


27 Characteristic Analysis Classifying All Trips Cellphone Trips Transit Trips Spatial Characteristic Variety in Lengths Temporal Characteristic Variety in Time Periods 50% 40% 30% 20% 10% 0% 27
28 Spatial Characteristic Trips from Transit Data Trips between 1 km and 35 km Trips from Cellphone data Trips with various lengths 28
29 Temporal Characteristic Captured Trips in the slot 7-8 AM in 14 different Mondays Fewer Trips from Cellphone data More Trips from Transit data 29
30 Empirical Insights Bias in Transit Data: Capturing fewer short (<1km) or long (>35km) trips Difficult to be mitigated Bias in Cellphone Data: Capturing fewer trips in a given time slot Possible to be mitigated Mitigating the Bias in Cellphone Data: Urban trips are highly repeatable, e.g., daily commute A traveling resident may use cellphone before Accumulatively using historical data to capture residents 30
31 Cumulatively using Historical Data Captured Trips from Unique Residents in Accumulative Mondays Cellphone Data are better 31

32 Urban Region Partition Utilizing 496 Shenzhen Urban Regions as a spatial partition Bus Trips Cell Trips Taxi Trips Downtown Subway Trips Color: Population Level 32
33 Cellphone User Mobility Graph Taxicab Passenger Mobility Graph Urban Region Partition Mobility Graph Vertex: a Urban Region Vertex Size: Number of Mobile Residents Edge: Mobility between a Pair of Regions Edge thickness: Mobility Volume Bus Passenger Mobility Graph Subway Passenger Mobility Graph 33
34 Online Inference: Objective: inferring the real-time mobility among different urban regions by a mobility graph G for the current slot Aggregating individual mobility to obtain mobility volumes for every region pairs Trips from Data Urban Region Partition A mobility graph G 34


35 Online Inference by Cellphone Data: 90% of urban residents have cellphones Infer G = G c +G c in a slot τ G c for active cellphone users with activities in τ G c for inactive cellphone users without activities in τ Active Users G c Inactive Users Key Challenge: G c? G c for inactive users is Unknown 35
36 Online Inference: Solution: Infer G c by accumulatively using historical data Active Users Inactive Users All Cellphone Users G c Plus G c Approx ~ G Today Real Time Cellphone Data Yester day Day Before Day X Yesterday Historical Cellphone Data Repeatable Trip: Inactive users may use cellphones before for same 36trip
37 Design Issue: Accumulation When to Stop Accumulatively Using Historical Data? One Day or One Week or One Month Avoiding Under or Overestimated Finding a Bound by another Data Source to stop the accumulation Using Mobility from Transit Data as a Lower Bound for Total Mobility Yester day Inactive Users G c Day X Historical Cellphone Data 37

38 Online Inference: Active Users Inactive Users Lower Bound Transit Users G c Today X Real Time Cellphone Data Plus Day X-1 G c Day X-2 Day X-3 Historical Cellphone Data Cover? G t Today X Real Time Transit Data Stop Accumulation, if G c plus G c covers G t in terms of edge weights 38
39 Online Inference: Active Users Inactive Users All Cellphone Users G c G c Approx ~ Today X Real Time Cellphone Data Day X-1 Day X-2 Day X-3 Historical Cellphone Data Using G c plus G c to approximate G for all inter region mobility G 39
40 Outline Introduction Design Evaluation Application Conclusion 40
41 Evaluation Summary Comparison: Radiation: Statistical Model without Real-Time Data WHERE: Single-Source Model with Cellphone Data Metric: Mean Average Percent Error (MAPE) Among : Inferred Mobility in an OD pair region pairs, i.e., an OD pair : Real Mobility in an OD pair (Ground Truth) Ground Truth: Obtained by a location updating dataset of 7 million cellphone users Logging locations of all users in every 15 mins even without activities Did not use in analysis since it cannot generalize to their cities, and need extra support in terms of software, hardware, and policies 41
42 Accuracy on different levels Region Levels Street Levels 42
43 Impact of slot length 43
44 Impact of Historical Data Accuracy Running Time mpat-s: using all historical cellphone data without analyzing the correlation with transit data 44
45 Outline Introduction Design Evaluation Application Conclusion 45
 Indicating Inadequate Transit Service Providing non-stop express inter region transit (IRT) services between these region")
46 Inter Region Transit Based on mpat, finding urban region pairs with High human mobility (Cellphone Data) Low public transit mobility (Transit Data) Indicating Inadequate Transit Service Providing non-stop express inter region transit (IRT) services between these region pairs 46

47 Real World Implementation Implementing between two urban regions Using 3 taxis as IRT Vehicles to deliver 12 volunteers Logging Travel Time for 30 days 47
48 Experiment Results Comparing IRT with walking and taking regular bus Quantifying speed difference between taxicabs and buses with a factor v 48
49 Conclusion Design an architecture mpat for the analysis and inference of the human mobility with a 75% inference accuracy Two key insights models based on single-source data introduce biases, which can be mitigated by multi-source data multi-source data can be used for cross-referencing to increase the performance 49
50 Thanks 50
Exploring Human Mobility with Multi-Source Data at Extremely Large Metropolitan Scales
 Exploring Human Mobility with Multi-Source Data at Extremely Large Metropolitan Scales Desheng Zhang zhang@cs.umn.edu Fan Zhang zhangfan@siat.ac.cn Jun Huang jun.huang@siat.ac.cn Chengzhong Xu cz.xu@siat.ac.cn
A Heterogeneous Model Integration for Multi-source Urban Infrastructure Data
 A Heterogeneous Model Integration for Multi-source Urban Infrastructure Data DESHENG ZHANG, Rutgers University, USA JUANJUAN ZHAO, Shenzhen Institutes of Advanced Technology, China FAN ZHANG, Shenzhen
Exploring the Patterns of Human Mobility Using Heterogeneous Traffic Trajectory Data
 Exploring the Patterns of Human Mobility Using Heterogeneous Traffic Trajectory Data Jinzhong Wang April 13, 2016 The UBD Group Mobile and Social Computing Laboratory School of Software, Dalian University
Travel Pattern Recognition using Smart Card Data in Public Transit
 International Journal of Emerging Engineering Research and Technology Volume 4, Issue 7, July 2016, PP 6-13 ISSN 2349-4395 (Print) & ISSN 2349-4409 (Online) Travel Pattern Recognition using Smart Card
Encapsulating Urban Traffic Rhythms into Road Networks
 Encapsulating Urban Traffic Rhythms into Road Networks Junjie Wang +, Dong Wei +, Kun He, Hang Gong, Pu Wang * School of Traffic and Transportation Engineering, Central South University, Changsha, Hunan,
ArcGIS GeoAnalytics Server: An Introduction. Sarah Ambrose and Ravi Narayanan
 ArcGIS GeoAnalytics Server: An Introduction Sarah Ambrose and Ravi Narayanan Overview Introduction Demos Analysis Concepts using GeoAnalytics Server GeoAnalytics Data Sources GeoAnalytics Server Administration
Bus Landscapes: Analyzing Commuting Pattern using Bus Smart Card Data in Beijing
 Bus Landscapes: Analyzing Commuting Pattern using Bus Smart Card Data in Beijing Ying Long, Beijing Institute of City Planning 龙瀛 Jean-Claude Thill, The University of North Carolina at Charlotte 1 INTRODUCTION
The Challenge of Geospatial Big Data Analysis
 288 POSTERS The Challenge of Geospatial Big Data Analysis Authors - Teerayut Horanont, University of Tokyo, Japan - Apichon Witayangkurn, University of Tokyo, Japan - Shibasaki Ryosuke, University of Tokyo,
Analysis of the urban travel structure using smartcard and GPS data from Santiago, Chile
 Analysis of the urban travel structure using smartcard and GPS data from Santiago, Chile Marcela Munizaga, Felipe Hernández, Universidad de Chile Ricardo Hurtubia, Pontificia Universidad Católica de Chile
Smart Card clustering to extract typical temporal passenger habits in Transit network. Two case studies: Rennes in France and Gatineau in Canada
 Smart Card clustering to extract typical temporal passenger habits in Transit network. Two case studies: Rennes in France and Gatineau in Canada Anne Sarah Briand, Etienne Come, Martin Trepanier, Latifa
Assessing spatial distribution and variability of destinations in inner-city Sydney from travel diary and smartphone location data
 Assessing spatial distribution and variability of destinations in inner-city Sydney from travel diary and smartphone location data Richard B. Ellison 1, Adrian B. Ellison 1 and Stephen P. Greaves 1 1 Institute
Typical information required from the data collection can be grouped into four categories, enumerated as below.
 Chapter 6 Data Collection 6.1 Overview The four-stage modeling, an important tool for forecasting future demand and performance of a transportation system, was developed for evaluating large-scale infrastructure
Urban Link Travel Time Estimation Using Large-scale Taxi Data with Partial Information
 Urban Link Travel Time Estimation Using Large-scale Taxi Data with Partial Information * Satish V. Ukkusuri * * Civil Engineering, Purdue University 24/04/2014 Outline Introduction Study Region Link Travel
Data Collection. Lecture Notes in Transportation Systems Engineering. Prof. Tom V. Mathew. 1 Overview 1
 Data Collection Lecture Notes in Transportation Systems Engineering Prof. Tom V. Mathew Contents 1 Overview 1 2 Survey design 2 2.1 Information needed................................. 2 2.2 Study area.....................................
Characterizing Travel Time Reliability and Passenger Path Choice in a Metro Network
 Characterizing Travel Time Reliability and Passenger Path Choice in a Metro Network Lijun SUN Future Cities Laboratory, Singapore-ETH Centre lijun.sun@ivt.baug.ethz.ch National University of Singapore
Mapping Accessibility Over Time
 Journal of Maps, 2006, 76-87 Mapping Accessibility Over Time AHMED EL-GENEIDY and DAVID LEVINSON University of Minnesota, 500 Pillsbury Drive S.E., Minneapolis, MN 55455, USA; geneidy@umn.edu (Received
* Abstract. Keywords: Smart Card Data, Public Transportation, Land Use, Non-negative Matrix Factorization.
 Analysis of Activity Trends Based on Smart Card Data of Public Transportation T. N. Maeda* 1, J. Mori 1, F. Toriumi 1, H. Ohashi 1 1 The University of Tokyo, 7-3-1 Hongo Bunkyo-ku, Tokyo, Japan *Email:
Now That You ve Downloaded Some StreetLight Data, What Should You Do First? Data Representativeness and Expansion Considerations
 Now That You ve Downloaded Some StreetLight Data, What Should You Do First? Data Representativeness and Expansion Considerations Vince Bernardin, PhD, September 8, 2017 Quick Recap of last December 2 Experience
Assessing pervasive user-generated content to describe tourist dynamics
 Assessing pervasive user-generated content to describe tourist dynamics Fabien Girardin, Josep Blat Universitat Pompeu Fabra, Barcelona, Spain {Fabien.Girardin, Josep.Blat}@upf.edu Abstract. In recent
Extracting mobility behavior from cell phone data DATA SIM Summer School 2013
 Extracting mobility behavior from cell phone data DATA SIM Summer School 2013 PETER WIDHALM Mobility Department Dynamic Transportation Systems T +43(0) 50550-6655 F +43(0) 50550-6439 peter.widhalm@ait.ac.at
Sensitivity of estimates of travel distance and travel time to street network data quality
 Sensitivity of estimates of travel distance and travel time to street network data quality Paul Zandbergen Department of Geography University of New Mexico Outline Street network quality Approaches to
VISUAL EXPLORATION OF SPATIAL-TEMPORAL TRAFFIC CONGESTION PATTERNS USING FLOATING CAR DATA. Candra Kartika 2015
 VISUAL EXPLORATION OF SPATIAL-TEMPORAL TRAFFIC CONGESTION PATTERNS USING FLOATING CAR DATA Candra Kartika 2015 OVERVIEW Motivation Background and State of The Art Test data Visualization methods Result
GIS Analysis of Crenshaw/LAX Line
 PDD 631 Geographic Information Systems for Public Policy, Planning & Development GIS Analysis of Crenshaw/LAX Line Biying Zhao 6679361256 Professor Barry Waite and Bonnie Shrewsbury May 12 th, 2015 Introduction
Data Mining II Mobility Data Mining
 Data Mining II Mobility Data Mining F. Giannotti& M. Nanni KDD Lab ISTI CNR Pisa, Italy Outline Mobility Data Mining Introduction MDM methods MDM methods at work. Understanding Human Mobility Clustering
Exploiting Geographic Dependencies for Real Estate Appraisal
 Exploiting Geographic Dependencies for Real Estate Appraisal Yanjie Fu Joint work with Hui Xiong, Yu Zheng, Yong Ge, Zhihua Zhou, Zijun Yao Rutgers, the State University of New Jersey Microsoft Research
PATREC PERSPECTIVES Sensing Technology Innovations for Tracking Congestion
 PATREC PERSPECTIVES Sensing Technology Innovations for Tracking Congestion Drivers have increasingly been using inexpensive mapping applications imbedded into mobile devices (like Google Maps, MapFactor,
Detecting Origin-Destination Mobility Flows From Geotagged Tweets in Greater Los Angeles Area
 Detecting Origin-Destination Mobility Flows From Geotagged Tweets in Greater Los Angeles Area Song Gao 1, Jiue-An Yang 1,2, Bo Yan 1, Yingjie Hu 1, Krzysztof Janowicz 1, Grant McKenzie 1 1 STKO Lab, Department
ArcGIS is Advancing. Both Contributing and Integrating many new Innovations. IoT. Smart Mapping. Smart Devices Advanced Analytics
 ArcGIS is Advancing IoT Smart Devices Advanced Analytics Smart Mapping Real-Time Faster Computing Web Services Crowdsourcing Sensor Networks Both Contributing and Integrating many new Innovations ArcGIS
Forecasts from the Strategy Planning Model
 Forecasts from the Strategy Planning Model Appendix A A12.1 As reported in Chapter 4, we used the Greater Manchester Strategy Planning Model (SPM) to test our long-term transport strategy. A12.2 The origins
Discovering Urban Spatial-Temporal Structure from Human Activity Patterns
 ACM SIGKDD International Workshop on Urban Computing (UrbComp 2012) Discovering Urban Spatial-Temporal Structure from Human Activity Patterns Shan Jiang, shanjang@mit.edu Joseph Ferreira, Jr., jf@mit.edu
Research Seminar on Urban Information Systems
 11.522 Research Seminar on Urban Information Systems Instructor: Joe Ferreira, jf@mit.edu Monday, 6-8 PM in Room 9-451 Opportunity for students to build on basic skills in GIS and urban analytics in order
Traffic Demand Forecast
 Chapter 5 Traffic Demand Forecast One of the important objectives of traffic demand forecast in a transportation master plan study is to examine the concepts and policies in proposed plans by numerically
Understanding individual and collective mobility patterns from smart card records: A case study in Shenzhen
 Understanding individual and collective mobility patterns from smart card records: A case study in Shenzhen The MIT Faculty has made this article openly available. Please share how this access benefits
The 3V Approach. Transforming the Urban Space through Transit Oriented Development. Gerald Ollivier Transport Cluster Leader World Bank Hub Singapore
 Transforming the Urban Space through Transit Oriented Development The 3V Approach Gerald Ollivier Transport Cluster Leader World Bank Hub Singapore MDTF on Sustainable Urbanization The China-World Bank
Shared Subway Shuttle Bus Route Planning Based on Transport Data Analytics
 IEEE TRANSACTIONS ON AUTOMATION SCIENCE AND ENGINEERING, VOL. 15, NO. 4, OCTOBER 2018 1507 Shared Subway Shuttle Bus Route Planning Based on Transport Data Analytics Xiangjie Kong, Senior Member, IEEE,
BROOKINGS May
 Appendix 1. Technical Methodology This study combines detailed data on transit systems, demographics, and employment to determine the accessibility of jobs via transit within and across the country s 100
Visualizing Big Data on Maps: Emerging Tools and Techniques. Ilir Bejleri, Sanjay Ranka
 Visualizing Big Data on Maps: Emerging Tools and Techniques Ilir Bejleri, Sanjay Ranka Topics Web GIS Visualization Big Data GIS Performance Maps in Data Visualization Platforms Next: Web GIS Visualization
The prediction of passenger flow under transport disturbance using accumulated passenger data
 Computers in Railways XIV 623 The prediction of passenger flow under transport disturbance using accumulated passenger data T. Kunimatsu & C. Hirai Signalling and Transport Information Technology Division,
Collection and Analyses of Crowd Travel Behaviour Data by using Smartphones
 Collection and Analyses of Crowd Travel Behaviour Data by using Smartphones Rik Bellens 1 Sven Vlassenroot 2 Sidharta Guatama 3 Abstract: In 2010 the MOVE project started in the collection and analysis
Inferring Passenger Boarding and Alighting Preference for the Marguerite Shuttle Bus System
 Inferring Passenger Boarding and Alighting Preference for the Marguerite Shuttle Bus System Adrian Albert Abstract We analyze passenger count data from the Marguerite Shuttle system operating on the Stanford
Combining smart card data and household travel survey to analyze jobs-housing relationships in Beijing
 Combining smart card data and household travel survey to analyze jobs-housing relationships in Beijing Ying LONG a,*, Jean-Claude THILL b a. Beijing Institute of City Planning, Beijing 100045, China b
Status Report: Ongoing review of O-D cellular data for the TPB modeled area
 Item #4 Status Report: Ongoing review of O-D cellular data for the TPB modeled area Presentation to the Travel Forecasting Subcommittee September 19, 2014 Ronald Milone, COG/TPB staff National Capital
A route map to calibrate spatial interaction models from GPS movement data
 A route map to calibrate spatial interaction models from GPS movement data K. Sila-Nowicka 1, A.S. Fotheringham 2 1 Urban Big Data Centre School of Political and Social Sciences University of Glasgow Lilybank
Understanding Individual Daily Activity Space Based on Large Scale Mobile Phone Location Data
 Understanding Individual Daily Activity Space Based on Large Scale Mobile Phone Location Data Yang Xu 1, Shih-Lung Shaw 1 2 *, Ling Yin 3, Ziliang Zhao 1 1 Department of Geography, University of Tennessee,
Research Article Urban Mobility Dynamics Based on Flexible Discrete Region Partition
 International Journal of Distributed Sensor Networks, Article ID 782649, 1 pages http://dx.doi.org/1.1155/214/782649 Research Article Urban Mobility Dynamics Based on Flexible Discrete Region Partition
Validating general human mobility patterns on massive GPS data
 Validating general human mobility patterns on massive GPS data Luca Pappalardo, Salvatore Rinzivillo, Dino Pedreschi, and Fosca Giannotti KDDLab, Institute of Information Science and Technologies (ISTI),
GIS Based Transit Information System for Metropolitan Cities in India
 PAPER REFERENCE NO.: PN-250 GIS Based Transit Information System for Metropolitan Cities in India Pal, Sarvjeet. a and Singh, Varun. b a M. Tech. (GIS & Remote Sensing); GIS Cell; Motilal Nehru National
Spatial Data Science. Soumya K Ghosh
 Workshop on Data Science and Machine Learning (DSML 17) ISI Kolkata, March 28-31, 2017 Spatial Data Science Soumya K Ghosh Professor Department of Computer Science and Engineering Indian Institute of Technology,
Policy Note 6. Measuring Unemployment by Location and Transport: StepSA s Access Envelope Technologies
 6 Measuring Unemployment by Location and Transport: StepSA s Access Envelope Technologies Introduction Increasing emphasis is coming onto spatial planning as government in South Africa moves to address
Where to Find My Next Passenger?
 Where to Find My Next Passenger? Jing Yuan 1 Yu Zheng 2 Liuhang Zhang 1 Guangzhong Sun 1 1 University of Science and Technology of China 2 Microsoft Research Asia September 19, 2011 Jing Yuan et al. (USTC,MSRA)
City monitoring with travel demand momentum vector fields: theoretical and empirical findings
 City monitoring with travel demand momentum vector fields: theoretical and empirical findings Xintao Liu 1, Joseph Y.J. Chow 2 1 Department of Civil Engineering, Ryerson University, Canada 2 Tandon School
Location Determination Technologies for Sensor Networks
 Location Determination Technologies for Sensor Networks Moustafa Youssef University of Maryland at College Park UMBC Talk March, 2007 Motivation Location is important: Determining the location of an event
Measuring connectivity in London
 Measuring connectivity in London OECD, Paris 30 th October 2017 Simon Cooper TfL City Planning 1 Overview TfL Connectivity measures in TfL PTALs Travel time mapping Catchment analysis WebCAT Current and
Measurement of human activity using velocity GPS data obtained from mobile phones
 Measurement of human activity using velocity GPS data obtained from mobile phones Yasuko Kawahata 1 Takayuki Mizuno 2 and Akira Ishii 3 1 Graduate School of Information Science and Technology, The University
Mobility Analytics through Social and Personal Data. Pierre Senellart
 Mobility Analytics through Social and Personal Data Pierre Senellart Session: Big Data & Transport Business Convention on Big Data Université Paris-Saclay, 25 novembre 2015 Analyzing Transportation and
Orbital Insight Energy: Oil Storage v5.1 Methodologies & Data Documentation
 Orbital Insight Energy: Oil Storage v5.1 Methodologies & Data Documentation Overview and Summary Orbital Insight Global Oil Storage leverages commercial satellite imagery, proprietary computer vision algorithms,
Modelling exploration and preferential attachment properties in individual human trajectories
 1.204 Final Project 11 December 2012 J. Cressica Brazier Modelling exploration and preferential attachment properties in individual human trajectories using the methods presented in Song, Chaoming, Tal
Perspectives on Stability and Mobility of Passenger s Travel Behavior through Smart Card Data
 Perspectives on Stability and Mobility of Passenger s Travel Behavior through Smart Card Data Zhiyong Cui Peking University Beijing, China 111546@pku.edu.cn Ying Long Beijing Institute of City Planning
True Smart and Green City? 8th Conference of the International Forum on Urbanism
 ,, doi:10.3390/ifou-. True Smart and Green City? 8th Conference of the International Forum on Urbanism Conference Proceedings Paper Comparable Measures of Accessibility to Public Transport by the General
Integrating Origin and Destination (OD) Study into GIS in Support of LIRR Services and Network Improvements
 Study into GIS in Support of LIRR Services and Network Improvements") Integrating Origin and Destination (OD) Study into GIS in Support of LIRR Services and Network Improvements GIS In Transit Conference, Washington, DC Long Island Rail Road Pyung ho Kim Date: September
Integrating Origin and Destination (OD) Study into GIS in Support of LIRR Services and Network Improvements GIS In Transit Conference, Washington, DC Long Island Rail Road Pyung ho Kim Date: September
Travel behavior of low-income residents: Studying two contrasting locations in the city of Chennai, India
 Travel behavior of low-income residents: Studying two contrasting locations in the city of Chennai, India Sumeeta Srinivasan Peter Rogers TRB Annual Meet, Washington D.C. January 2003 Environmental Systems,
Continental Divide National Scenic Trail GIS Program
 CDNST Vision Statement: Provide the most accurate geospatial locational information of the Continental Divide Trail and nearby resources to the public as well as help provide internal management information
ArcGIS Enterprise: What s New. Philip Heede Shannon Kalisky Melanie Summers Shreyas Shinde
 ArcGIS Enterprise: What s New Philip Heede Shannon Kalisky Melanie Summers Shreyas Shinde ArcGIS Enterprise is the new name for ArcGIS for Server ArcGIS Enterprise Software Components ArcGIS Server Portal
Data Analysis of NYC Cab Services
 Data Analysis of NYC Cab Services Abhinandan Dubey Stony Brook University New York, USA Raju Khanal Stony Brook University New York, USA [adubey, rkhanal, lmadiraju]@cs.stonybrook.edu Teja Madiraju Stony
Unit 1, Lesson 2. What is geographic inquiry?
 What is geographic inquiry? Unit 1, Lesson 2 Understanding the way in which social scientists investigate problems will help you conduct your own investigations about problems or issues facing your community
A Cloud Computing Workflow for Scalable Integration of Remote Sensing and Social Media Data in Urban Studies
 A Cloud Computing Workflow for Scalable Integration of Remote Sensing and Social Media Data in Urban Studies Aiman Soliman1, Kiumars Soltani1, Junjun Yin1, Balaji Subramaniam2, Pierre Riteau2, Kate Keahey2,
DATA SOURCES AND INPUT IN GIS. By Prof. A. Balasubramanian Centre for Advanced Studies in Earth Science, University of Mysore, Mysore
 DATA SOURCES AND INPUT IN GIS By Prof. A. Balasubramanian Centre for Advanced Studies in Earth Science, University of Mysore, Mysore 1 1. GIS stands for 'Geographic Information System'. It is a computer-based
Profiling underprivileged residents with mid-term public transit smartcard data of Beijing
 Beijing City Lab Long Y, Liu X, Zhou J, Gu Y, 2014, Profiling underprivileged residents with midterm public transit smartcard data of Beijing. Beijing City Lab. Working paper #44 Profiling underprivileged
Web Visualization of Geo-Spatial Data using SVG and VRML/X3D
 Web Visualization of Geo-Spatial Data using SVG and VRML/X3D Jianghui Ying Falls Church, VA 22043, USA jying@vt.edu Denis Gračanin Blacksburg, VA 24061, USA gracanin@vt.edu Chang-Tien Lu Falls Church,
Central Coast Tracking Trash. Trash Webinar #3 September 19, 2017
 Central Coast Tracking Trash Trash Webinar #3 September 19, 2017 Webinar #3: Agenda Trash App v0.2 release Intro to tracking annual progress towards compliance Intro to prioritizing actions Next webinar
ESRI Survey Summit August Clint Brown Director of ESRI Software Products
 ESRI Survey Summit August 2006 Clint Brown Director of ESRI Software Products Cadastral Fabric How does Cadastral fit with Survey? Surveyors process raw field observations Survey measurements define high-order
ArcGIS Enterprise: What s New. Philip Heede Shannon Kalisky Melanie Summers Sam Williamson
 ArcGIS Enterprise: What s New Philip Heede Shannon Kalisky Melanie Summers Sam Williamson ArcGIS Enterprise is the new name for ArcGIS for Server What is ArcGIS Enterprise ArcGIS Enterprise is powerful
Geographical Bias on Social Media and Geo-Local Contents System with Mobile Devices
 212 45th Hawaii International Conference on System Sciences Geographical Bias on Social Media and Geo-Local Contents System with Mobile Devices Kazunari Ishida Hiroshima Institute of Technology k.ishida.p7@it-hiroshima.ac.jp
Smart Data Collection and Real-time Digital Cartography
 Smart Data Collection and Real-time Digital Cartography Yuji Murayama and Ko Ko Lwin Division of Spatial Information Science Faculty of Life and Environmental Sciences University of Tsukuba IGU 2013 1
GIS = Geographic Information Systems;
 What is GIS GIS = Geographic Information Systems; What Information are we talking about? Information about anything that has a place (e.g. locations of features, address of people) on Earth s surface,
Regularity and Conformity: Location Prediction Using Heterogeneous Mobility Data
 Regularity and Conformity: Location Prediction Using Heterogeneous Mobility Data Yingzi Wang 12, Nicholas Jing Yuan 2, Defu Lian 3, Linli Xu 1 Xing Xie 2, Enhong Chen 1, Yong Rui 2 1 University of Science
ArcGIS Enterprise: Out-of-the-Box Spatial Analysis. Vicki Cove Hilary Curtis
 ArcGIS Enterprise: Out-of-the-Box Spatial Analysis Vicki Cove Hilary Curtis Agenda What is spatial analysis? Spatial analysis with ArcGIS Enterprise Analysis demos: - Sunflower proximity to bees - Tourists
Data for transport planning and management Why integration and management? Issues in transport data integration
 Zhengdong HUANG Wuhan University 1 Data for transport planning and management Why integration and management? Issues in transport data integration Technical aspect Institutional aspect Action examples
Introduction to ArcGIS GeoAnalytics Server. Sarah Ambrose & Noah Slocum
 Introduction to ArcGIS GeoAnalytics Server Sarah Ambrose & Noah Slocum Agenda Overview Analysis Capabilities + Demo Deployment and Configuration Questions ArcGIS GeoAnalytics Server uses the power of distributed
Developing harmonised indicators on urban public transport in Europe
 Developing harmonised indicators on urban public transport in Europe Hugo Poelman European Commission DG Regional and Urban GIS team Regional May 2015 context EU Cohesion European Regional Development
Understand Urban Human Mobility through Crowdsensed Data
 Understand Urban Human Mobility through Crowdsensed Data Yuren Zhou, Billy Pik Lik Lau, Chau Yuen, Bige Tunçer, Erik Wilhelm arxiv:1805.00628v1 [cs.si] 2 May 2018 Abstract Understanding how people move
Simplified Trips-on-Project Software (STOPS): Strategies for Successful Application
: Strategies for Successful Application") Simplified Trips-on-Project Software (STOPS): Strategies for Successful Application presented to Transit Committee Florida Model Task Force presented by Cambridge Systematics, Inc. John (Jay) Evans, AICP
Simplified Trips-on-Project Software (STOPS): Strategies for Successful Application presented to Transit Committee Florida Model Task Force presented by Cambridge Systematics, Inc. John (Jay) Evans, AICP
Space-adjusting Technologies and the Social Ecologies of Place
 Space-adjusting Technologies and the Social Ecologies of Place Donald G. Janelle University of California, Santa Barbara Reflections on Geographic Information Science Session in Honor of Michael Goodchild
Caesar s Taxi Prediction Services
 1 Caesar s Taxi Prediction Services Predicting NYC Taxi Fares, Trip Distance, and Activity Paul Jolly, Boxiao Pan, Varun Nambiar Abstract In this paper, we propose three models each predicting either taxi
Estimating Large Scale Population Movement ML Dublin Meetup
 Deutsche Bank COO Chief Data Office Estimating Large Scale Population Movement ML Dublin Meetup John Doyle PhD Assistant Vice President CDO Research & Development Science & Innovation john.doyle@db.com
Metropolitan Wi-Fi Research Network at the Los Angeles State Historic Park
 Metropolitan Wi-Fi Research Network at the Los Angeles State Historic Park Vidyut Samanta vids@remap.ucla.edu Chase Laurelle Alexandria Knowles chase@remap.ucla.edu Jeff Burke jburke@remap.ucla.edu Fabian
Geospatial SDI Portal for effective Governance of Pune METROPOLIS region
 Geospatial SDI Portal for effective Governance of Pune METROPOLIS region Mr. Praveen Gautam Senior Manager 19 th January 2018 PMRDA Overview Provide a Spatial Framework for the entire region with various
California Urban Infill Trip Generation Study. Jim Daisa, P.E.
 California Urban Infill Trip Generation Study Jim Daisa, P.E. What We Did in the Study Develop trip generation rates for land uses in urban areas of California Establish a California urban land use trip
Evaluation of urban mobility using surveillance cameras
 Procedia Computer Science Volume 66, 2015, Pages 364 371 YSC 2015. 4th International Young Scientists Conference on Computational Science Evaluation of urban mobility using surveillance cameras Alexey
Understanding Travel Time to Airports in New York City Sierra Gentry Dominik Schunack
 Understanding Travel Time to Airports in New York City Sierra Gentry Dominik Schunack 1 Introduction Even with the rising competition of rideshare services, many in New York City still utilize taxis for
The Model Research of Urban Land Planning and Traffic Integration. Lang Wang
 International Conference on Materials, Environmental and Biological Engineering (MEBE 2015) The Model Research of Urban Land Planning and Traffic Integration Lang Wang Zhejiang Gongshang University, Hangzhou
COMBINATION OF MACROSCOPIC AND MICROSCOPIC TRANSPORT SIMULATION MODELS: USE CASE IN CYPRUS
 International Journal for Traffic and Transport Engineering, 2014, 4(2): 220-233 DOI: http://dx.doi.org/10.7708/ijtte.2014.4(2).08 UDC: 656:519.87(564.3) COMBINATION OF MACROSCOPIC AND MICROSCOPIC TRANSPORT
Geographic Data Science - Lecture II
 Geographic Data Science - Lecture II (New) Spatial Data Dani Arribas-Bel "Yesterday" Introduced the (geo-)data revolution What is it? Why now? The need of (geo-)data science to make sense of it all Today
Supplementary Figures
 Supplementary Figures 10 1 Roma Milano Napoli Torino Palermo Genova 0.3 0.25 (a) P(t) 10 1 (b) t (h) 0.2 0 0.2 0.4 0.6 0.8 1 t (h) 0.15 10 4 10 5 10 6 10 7 Population Supplementary Figure 1: Variation
Estimating the vehicle accumulation: Data-fusion of loop-detector flow and floating car speed data
 Estimating the vehicle accumulation: Data-fusion of loop-detector flow and floating car speed data Paul B.C. van Erp (corresponding author) Victor L. Knoop Serge P. Hoogendoorn Department of Transport
Classification in Mobility Data Mining
 Classification in Mobility Data Mining Activity Recognition Semantic Enrichment Recognition through Points-of-Interest Given a dataset of GPS tracks of private vehicles, we annotate trajectories with the
Knowledge claims in planning documents on land use and transport infrastructure impacts
 Knowledge claims in planning documents on land use and transport infrastructure impacts Presentation at the Final Workshop of the research project "Innovations for sustainable public transport in Nordic
A Machine Learning Approach to Trip Purpose Imputation in GPS-Based Travel Surveys
 A Machine Learning Approach to Trip Purpose Imputation in GPS-Based Travel Surveys Yijing Lu 1, Shanjiang Zhu 2, and Lei Zhang 3,* 1. Graduate Research Assistant 2. Research Scientist 2. Assistant Professor
Visitor Flows Model for Queensland a new approach
 Visitor Flows Model for Queensland a new approach Jason. van Paassen 1, Mark. Olsen 2 1 Parsons Brinckerhoff Australia Pty Ltd, Brisbane, QLD, Australia 2 Tourism Queensland, Brisbane, QLD, Australia 1
SPATIAL INEQUALITIES IN PUBLIC TRANSPORT AVAILABILITY: INVESTIGATION WITH SMALL-AREA METRICS
 SPATIAL INEQUALITIES IN PUBLIC TRANSPORT AVAILABILITY: INVESTIGATION WITH SMALL-AREA METRICS Research conducted by Yeran Sun and Piyushimita (Vonu) Thakuriah Presented by Obinna C.D. Anejionu INTRODUCTION