Urban Computing Using Big Data to Solve Urban Challenges
|
|
|
- Marilynn Bradford
- 6 years ago
- Views:
Transcription

1 Urban Computing Using Big Data to Solve Urban Challenges Dr. Yu Zheng Lead Researcher, Microsoft Research Asia Chair Professor at Shanghai Jiaotong University


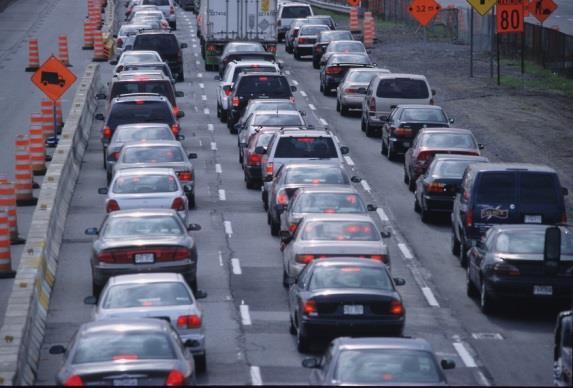


2 Big Challenges in Big Cities


3 Big Data in Cities

4 Service Providing Improve urban planning, Ease Traffic Congestion, Save Energy, Reduce Air Pollution,... The Environment Urban Data Analytics Win Data Mining, Machine Learning, Visualization Urban Data Management Spatio-temporal index, streaming, trajectory, and graph data management,... People Win Urban Computing Win Cities OS Human mobility Traffic Air Quality Meteorolo gy Social Media Energy Road Networks POIs Urban Sensing & Data Acquisition Participatory Sensing, Crowd Sensing, Mobile Sensing Tackle the Big challenges in Big cities using Big data! Zheng, Y., et al. Urban Computing: concepts, methodologies, and applications. ACM transactions on Intelligent Systems and Technology.
 Loose control and unreliable data missing and skewed distribution Unstructured, implicit, and noisy data Trade off among energy, privacy and the utility of the data")
5 Key Focuses and Challenges Sensing city dynamics Unobtrusively, automatically, and constantly A variety of sensors: Mobile phones, vehicles, cameras, loops, Human as a sensor: User generated content (check in, photos, tweets) Loose control and unreliable data missing and skewed distribution Unstructured, implicit, and noisy data Trade off among energy, privacy and the utility of the data Computing with heterogeneous data sources Geospatial, temporal, social, text, images, economic, environmental, Learn mutually reinforced knowledge across a diversity of data Efficiency + Effectiveness: Data Management + Mining + Machine Learning Blending the physical and virtual worlds Serving both people and cities (virtually and physically) Hybrid systems: Mobile + Cloud, crowd sourcing, participatory sensing

6 Beijing road networks km 40 km 2011: 121,771 nodes and 162,246 segments, 19,524km

7 POI Data ( )


8

9 Air Quality Data

10 Meteorological data


11 Check-in data Check-in: Entertainment Check-ins: Nightlife Spot

12 GPS trajectories of 33,000 taxis from 2009 to 2013

13

14 Heat Maps of Beijing (2011)


 (d) (e)")


15 (b) KDD 12 and ICDE 2012 Route Construction from Uncertain Trajectories (c) (d) (e) ACM SIGSPAITAL GIS 10 best paper runner-up, KDD 11 Finding Smart Driving Directions Discovery of Functional Regions KDD 12 Ubicomp 11 Passengers-Cabbie Recommender system Anomalous Events Detection KDD 11 and ICDM 2012 Ubicomp 11 Best paper nominee Urban Computing for Urban Planning


16 Best paper Runner-up Award in ICDE 2013 Real-time and large-scale dynamic ridesharing Real-time and find-grained air quality inference using big data KDD 2013 Real-time city-scale gas consumption sensing UbiComp 2013
17 KDD


18 Background Air quality monitor station S1 50kmx40km S4 S2 S6 S16 S3 S7 S8 S13 S21 S15 S20 S9 S10 S11 S6 S12 S14 S22 S19 S5 S16 S17 S18
19 2PM, June 17, 2013


20 Challenges Air quality varies by locations non-linearly Affected by many factors Weathers, traffic, land use Subtle to model with a clear formula Portition Proportion >35% 0.05 A) Beijing (8/24/2012-3/8/2013) Deviation of PM2.5 between S12 and S13

21

22 We do not really know the air quality of a location without a monitoring station!


23 Inferring Real-Time and Fine-Grained air quality throughout a city using Big Data Meteorology Traffic Human Mobility POIs Road networks Historical air quality data Real-time air quality reports

24

25 Cloud MS Azure Cloud + Client Clients
26 Difficulties Incorporate multiple heterogeneous data sources into a learning model Spatially-related data: POIs, road networks Temporally-related data: traffic, meteorology, human mobility Data sparseness (little training data) Limited number of stations Many places to infer Efficiency request Massive data Answer instant queries

27 Methodology Overview Partition a city into disjoint grids Extract features for each grid from its impacting region Meteorological features Traffic features Human mobility features POI features Road network features Co-training-based semi-supervised learning model for each pollutant Predict the AQI labels Data sparsity Two classifiers
28 Semi-Supervised Learning Model Philosophy of the model States of air quality Temporal dependency in a location Geo-correlation between locations Generation of air pollutants Emission from a location Propagation among locations Two sets of features Spatially-related Temporally-related Time Co-Training t i t 2 t 1 s 4 s 1 l s 3 s 2 s 4 s l 1 s 2 s 3 s 4 s l 1 s 2 s 3 A location with AQI labels A location to be inferred Temporal dependency Spatial correlation Geospace Spatial Classifier Road Networks: F r POIs: F p Spatial Temporal Classifier Traffic: F t Human mobility: Meteorologic: F h F m Temporal
29 Semi-Supervised Learning Model Temporal classifier (TC) Model the temporal dependency of the air quality in a location Using temporally related features Based on a Linear-Chain Conditional Random Field (CRF) Y t-1 Y t Y t-1 F m (t-1) F t (t-1) F h (t-1) t-1 F m (t) F t (t) F h (t) t F m (t+1) F t (t+1) F h (t+1) t+1

30 Semi-Supervised Learning Model Spatial classifier (SC) Model the spatial correlation between AQI of different locations Using spatially-related features Based on a BP neural network Input generation Select n stations to pair with Perform m rounds 11 F pp 11 F rr D 11 D 11 l 1 l 1 D 22 xx F pp xx F rr l x l x P 1x 1x R 1x 1x d 1x 1x 1 c 1 w b1 b1 w' w' b' b' 1 1 w 1 1 b'' b'' c x x kk F pp D 11 P kx kx kk F rr D 11 R kx kx b' b' r r w r r l k l k D 22 Input generation d kx kx c k k w pq pq bb q q w' w' qr qr ANN
31 Learning Process of Our Model Labeled data Temporally-related features Yt-1 Yt Yt-1 Unlabeled data Fm(t-1) Ft(t-1) Fh(t-1) t-1 Fm(t) Ft(t) Fh(t) t Fm(t+1) Ft(t+1) Fh(t+1) t+1 Training 1 F p D1 P 1x w11 b1 w'11 Inference 1 F r D1 R 1x b'1 w1 l 1 D2 d 1x F p x F r x l x c 1 b'' c x k F p D1 P kx k F r D1 R kx b'r wr l k D2 d kx Input generation c k wpq bq w'qr ANN Spatially-related features
32 Inference Process Temporally-related features Y t-1 Y t Y t-1 < p c1, p c2,, p cn > F m(t-1) F t(t-1) F h(t-1) t-1 F m(t) F t(t) F h(t) t F m(t+1) F t(t+1) F h(t+1) t+1 1 F p D 1 P 1x w11 b1 w'11 c = arg ci CMax(p ci p ci ) 1 F r D 1 R 1x b'1 l 1 D 2 x x F p F r l x d 1x c 1 w1 b'' c x < p c1, p c2,, p cn > k F p D 1 P kx k F r D 1 R kx b'r wr l k D 2 d kx Input generation c k wpq bq w'qr ANN Spatially-related features

33 Evaluation Datasets POI Road AQI Data sources Beijing Shanghai Shenzhen Wuhan 2012 Q1 271, , , , Q3 272, , , ,634 #.Segments 162, ,191 45,231 38,477 Highways 1,497km 1,963km 256km 1,193km Roads 18,525km 25,530km KM 6,100km 9,691km #. Intersec. 49,981 70,293 32,112 25,359 #. Station Hours 23,300 8,588 6,489 6,741 Time spans 8/24/2012-3/8/2013 1/19/2013-3/8/2013 2/4/2013-3/8/2013 Data Released 2/4/2013-3/8/2013 Urban Size (grids) 50 50km (2500) 50 50km (2500) 57 45km(2565) 45 25km (1165) S1 S1 S9 S5 S6 S5 S4 S2 S6 S16 S3 S7 S6 S8 S12 S13 S14 S21 S15 S22 S20 S9 S10 S11 S16 S18 S17 S19 S6 S7 S2 S8 S1 S10 S4 S3 S5 S1 S3 S4 S2 S8 S9 S7 S10 S2 S1 S5 S3 S9 S6 S7 S8 S4 A) Beijing B) Shanghai C) Shenzhen D) Wuhan
34 Evaluation Overall performance of the co-training Accuracy Accuracy U-Air Linear Guassian Classical DT CRF-ALL ANN-ALL Precision SC TC Co-Training PM10 NO Num. of Iterations Zheng, Y., et al. U-Air: when urban air quality inference meets big data. KDD 2013


35 Discover Regions of Different Functions using Human Mobility and POIs In KDD 2012

36 Goals Discover regions of different functions in urban areas Identify the kernel density of a functionality Functional Regions Functionality Density


37 Motivation and Challenges POIs indicate the function But not enough Compound Quality Human mobility Differentiate between POIs of the same category Indicate the function of a region Leaving Arrival
38 Methodology Overview Mapping from regions to documents Regions Documents (R) Functions Topics (K) Mobility patterns Words (N) POIs meta data like Key words and authors Observed words (mobility patterns) σ 2 λ k α k θ k z r,n m r,n φ k β K x r N R K Observed feature vector (POI vector) Infer the topic distribution using a LDA(Latent Dirichlet allocation)-variant topic model


39 Results B A B A Land use planning ( ) Results of 2011
40 Sensing the Pulse of Urban Refueling Behavior d d B A C B A UbiComp 2013 C (b) taxis time spent A (c) taxis visits A B C B C (a) stations distribution (d) urban s time spent (e) urban s visits

41 Questions How many liters of gas have been consumed in the past 1 hour in NYC? Which gas station in 3 miles has the shortest queue?
42 C Goal Use GPS-equipped taxicabs as a sensor to capture both Waiting time at a gas station City-wide petrol consumption Fifth Ring Road Fourth Ring Road A C B B Waiting time of taxis in a gas station A A City-scale (b) taxis Gas consumption time spent (c) taxis A B C B C B C B (a) stations distribution (b) taxis time spent (c) taxis visits A A (d) urban s time spent (e) urban

 18 16 14 12 10 8 6 4 Weekday Weekend 0 5 10 15 20 Time of")
 18 16 14 12 10 8 6 4 Weekday Weekend 0 5 10 15 20 Time of Day (Hour) Visit 80000")
43 Motivation Gas stations are owned by competing organizations Do not want to make data available to competitors There is a cost but no benefit for them No time information Benefits Gas station recommendation Support the planning and operation of gas stations Monitoring real-time city-scale energy consumption Time Spent (minute) Weekday Weekend Time of Day (Hour) Visit Weekday Weekend Time of Day (Hour) Time Spent (minute) Weekday Weekend Time of Day (Hour) Visit
44 Methodology Overview Spatio-temporal clustering and classification Tensor Decomposition Queue theory d m Knowledge Cube Q 4 Knowledge Cell Q 3 Detected RE Q 2 h k d 1 g n g 1 h 1 Other RE shops Q 1 1. Refueling event detection in a gas station 2. Waiting time inference across different stations 3. Estimation number of vehicles in a station
45 Expected Duration Learning Tensor decomposition Approximate a tensor with the multiplication of three (low-rank) matrices and a core tensor High order singular value decomposition (HOSVD) F ijk = S H H G G D D S H H i G G j D D k G H H i D F D G j S D k G H

46 Expected Duration Learning The context of a station Stations with similar contextual features tend to have a similar duration POI feature F P Traffic feature F T Area feature F A g 0 g 1.. g n F P F T F A z 0p z 0T z 0A.. z np z nt z na H D F G Bank


47 Evaluation In the field study Sent students to two stations to observe the queues Oct.17 to Nov.15 in 2012, 5-6pm Recorded the number of vehicles and the waiting time of some Evaluate waiting time and number of vehicles

 taxis visits A B C")
 urban s time spent (e)")
48 Visualization Geographic View A A Fifth Ring Road Fourth Ring Road B C B C (b) taxis time spent A (c) taxis visits A B C B C (a) stations distribution (d) urban s time spent (e) urban s visits

49 Computing with Multiple Heterogeneous Data Sources Spatial Classifier Road Networks: F r POIs: F p Spatial Temporal Classifier Traffic: F t Human mobility: Meteorologic: Co-Training-based Semi-supervised learning F h Human Mobility F m Temporal σ 2 λ k α k θ k z r,n m r,n φ k β K x r N R K POIs Topic Models H D F G g 0 g 1.. g n F P F T F A z 0p z 0T z 0A.. z np z nt z na Context-aware Tensor Decomposition
50 T-Share: A Large-Scale Dynamic Taxi Ridesharing Service Best Paper Runner up Award at ICDE 2013
51 Difficult to take a taxi! A problem among passengers, taxi drivers and government Possible Solutions Increasing taxis? Taxi dispatching?? There are quite a few seats left in a taxi Taxi Ridesharing


52 Next Pickup Point : in 1.2km Next Delivery Point : in 6.3km, $13.2 Original route Newly scheduled route Pickup Point Scheduled route Delivery Point T -Share From Pick your role Ride Request Driver Current Position Ride Joining Request Number of riders added: 2 Fare saving: $1.5 Travel time delay: 2 min Accept Reject To Huaxing Cinema Number of riders 2 Confirmation ZX3G Rider Taxi Earliest ID: departure Now 京 B Estimated Latest arrival pickup time: 09:30 08:32 Estimated taxi fare: $ 5.3 Send OK Cancel
53 Problem Definition Query Q=< Q. o, Q. d, Q. wp, Q. wd, n > Origin and destination: Q. o and Q. d Pickup time: Q. wp Delivery time: Q. wd Given a fixed number of taxis traveling on a road network and a stream of queries, we aim to serve each query Q in the stream by dispatching the taxi which satisfies schedule constraint, capacity constraint of a taxi, and monetary constraint with the minimum increase in travel distance.
54 Value Government Save 120 million liter gasoline per year Supporting 1M cars for 1.5 months Worth about 150 million USD 246 million KG CO2 emission Passengers Serving rate increased 300% Save 7% expense on average Taxi drivers increase profit 10% on average


55 Architecture Scheduling R v Index Updating {Taxis} R R u Taxi Searching Q Spatio-Temporal index of taxis {V} Communication Interface Q R v V R v V Service providing data flow Q=<t, o, wp, d, wd>; R=R u R v ; Taxi status updating flow V=real time pos
56
57 (b) KDD 12 and ICDE 2012 Route Construction from Uncertain Trajectories (c) (d) (e) ACM SIGSPAITAL GIS 10 best paper runner-up, KDD 11 Finding Smart Driving Directions Discovery of Functional Regions KDD 12 Ubicomp 11 Passengers-Cabbie Recommender system Anomalous Events Detection KDD 11 and ICDM 2012 Ubicomp 11 Best paper nominee Urban Computing for Urban Planning

58
59 Take Away Messages 3B: Big city, Big challenges, Big data 3M: Data Management, Mining and Machine learning 3W: Win-Win-Win: people, city, and the environment 3 BMW
60 Search for Urban Computing Thanks! Download Urban Air App Yu Zheng Homepage
Urban Computing Using Big Data to Solve Urban Challenges
 Urban Computing Using Big Data to Solve Urban Challenges Dr. Yu Zheng Lead Researcher, Microsoft Research Chair Professor at Shanghai Jiao Tong University http://research.microsoft.com/en-us/projects/urbancomputing/default.aspx
Diagnosing New York City s Noises with Ubiquitous Data
 Diagnosing New York City s Noises with Ubiquitous Data Dr. Yu Zheng yuzheng@microsoft.com Lead Researcher, Microsoft Research Chair Professor at Shanghai Jiao Tong University Background Many cities suffer
Where to Find My Next Passenger?
 Where to Find My Next Passenger? Jing Yuan 1 Yu Zheng 2 Liuhang Zhang 1 Guangzhong Sun 1 1 University of Science and Technology of China 2 Microsoft Research Asia September 19, 2011 Jing Yuan et al. (USTC,MSRA)
VISUAL EXPLORATION OF SPATIAL-TEMPORAL TRAFFIC CONGESTION PATTERNS USING FLOATING CAR DATA. Candra Kartika 2015
 VISUAL EXPLORATION OF SPATIAL-TEMPORAL TRAFFIC CONGESTION PATTERNS USING FLOATING CAR DATA Candra Kartika 2015 OVERVIEW Motivation Background and State of The Art Test data Visualization methods Result
Exploring the Patterns of Human Mobility Using Heterogeneous Traffic Trajectory Data
 Exploring the Patterns of Human Mobility Using Heterogeneous Traffic Trajectory Data Jinzhong Wang April 13, 2016 The UBD Group Mobile and Social Computing Laboratory School of Software, Dalian University
Urban Computing: Concepts, Methodologies, and Applications
 Urban Computing: Concepts, Methodologies, and Applications YU ZHENG, Microsoft Research LICIA CAPRA, University College London OURI WOLFSON, University of Illinois at Chicago HAI YANG, Hong Kong University
U-Air: When Urban Air Quality Inference Meets Big Data
 U-Air: When Urban Air Quality Inference Meets Big Data Yu Zheng, Furui Liu, Hsun-Ping Hsieh Microsoft Research Asia, Beijing China {yuzheng, v-ful, v-hshsie}@microsoft.com ABSTRACT Information about urban
Exploring Human Mobility with Multi-Source Data at Extremely Large Metropolitan Scales. ACM MobiCom 2014, Maui, HI
 Exploring Human Mobility with Multi-Source Data at Extremely Large Metropolitan Scales Desheng Zhang & Tian He University of Minnesota, USA Jun Huang, Ye Li, Fan Zhang, Chengzhong Xu Shenzhen Institute
Exploiting Geographic Dependencies for Real Estate Appraisal
 Exploiting Geographic Dependencies for Real Estate Appraisal Yanjie Fu Joint work with Hui Xiong, Yu Zheng, Yong Ge, Zhihua Zhou, Zijun Yao Rutgers, the State University of New Jersey Microsoft Research
Spatial Data Science. Soumya K Ghosh
 Workshop on Data Science and Machine Learning (DSML 17) ISI Kolkata, March 28-31, 2017 Spatial Data Science Soumya K Ghosh Professor Department of Computer Science and Engineering Indian Institute of Technology,
Extracting mobility behavior from cell phone data DATA SIM Summer School 2013
 Extracting mobility behavior from cell phone data DATA SIM Summer School 2013 PETER WIDHALM Mobility Department Dynamic Transportation Systems T +43(0) 50550-6655 F +43(0) 50550-6439 peter.widhalm@ait.ac.at
DM-Group Meeting. Subhodip Biswas 10/16/2014
 DM-Group Meeting Subhodip Biswas 10/16/2014 Papers to be discussed 1. Crowdsourcing Land Use Maps via Twitter Vanessa Frias-Martinez and Enrique Frias-Martinez in KDD 2014 2. Tracking Climate Change Opinions
* Abstract. Keywords: Smart Card Data, Public Transportation, Land Use, Non-negative Matrix Factorization.
 Analysis of Activity Trends Based on Smart Card Data of Public Transportation T. N. Maeda* 1, J. Mori 1, F. Toriumi 1, H. Ohashi 1 1 The University of Tokyo, 7-3-1 Hongo Bunkyo-ku, Tokyo, Japan *Email:
Improving the travel time prediction by using the real-time floating car data
 Improving the travel time prediction by using the real-time floating car data Krzysztof Dembczyński Przemys law Gawe l Andrzej Jaszkiewicz Wojciech Kot lowski Adam Szarecki Institute of Computing Science,
Classification in Mobility Data Mining
 Classification in Mobility Data Mining Activity Recognition Semantic Enrichment Recognition through Points-of-Interest Given a dataset of GPS tracks of private vehicles, we annotate trajectories with the
Caesar s Taxi Prediction Services
 1 Caesar s Taxi Prediction Services Predicting NYC Taxi Fares, Trip Distance, and Activity Paul Jolly, Boxiao Pan, Varun Nambiar Abstract In this paper, we propose three models each predicting either taxi
SPACE-TIME ACCESSIBILITY MEASURES FOR EVALUATING MOBILITY-RELATED SOCIAL EXCLUSION OF THE ELDERLY
 SPACE-TIME ACCESSIBILITY MEASURES FOR EVALUATING MOBILITY-RELATED SOCIAL EXCLUSION OF THE ELDERLY Izumiyama, Hiroshi Institute of Environmental Studies, The University of Tokyo, Tokyo, Japan Email: izumiyama@ut.t.u-tokyo.ac.jp
An Online Ride-Sharing Path Planning Strategy for Public Vehicle Systems
 1 An Online Ride-Sharing Path Planning Strategy for Public Vehicle Systems Ming Zhu, Xiao-Yang Liu, and Xiaodong Wang, Fellow, IEEE arxiv:1712.09356v1 [cs.ai] 27 Dec 2017 Abstract As efficient traffic-management
Activity Identification from GPS Trajectories Using Spatial Temporal POIs Attractiveness
 Activity Identification from GPS Trajectories Using Spatial Temporal POIs Attractiveness Lian Huang, Qingquan Li, Yang Yue State Key Laboratory of Information Engineering in Survey, Mapping and Remote
1. INTRODUCTION 2. BIG DATA IN URBAN STUDIES 3. LESSONS FROM BIG DATA
 Main Content URBAN SENSING & COMPUTING Sensing and Computing Introduction and Application 王江浩 State Key Laboratory of Resources and Environmental Information System, Institute of Geographic Sciences and
Data Mining II Mobility Data Mining
 Data Mining II Mobility Data Mining F. Giannotti& M. Nanni KDD Lab ISTI CNR Pisa, Italy Outline Mobility Data Mining Introduction MDM methods MDM methods at work. Understanding Human Mobility Clustering
Crowd Sensing of Traffic Anomalies based on Human Mobility and Social Media
 Crowd Sensing of Traffic Anomalies based on Human Mobility and Social Media Bei Pan 1 Yu Zheng 2 David Wilkie 3 Cyrus Shahabi 1 1 University of Southern California, Los Angeles, USA 2 Microsoft Research,
T-Finder: A Recommender System for Finding Passengers and Vacant Taxis
 1 T-Finder: A Recommender System for Finding Passengers and Vacant Taxis Nicholas Jing Yuan, Yu Zheng, Liuhang Zhang, Xing Xie Abstract This paper presents a recommender system for both taxi drivers and
Not All Apps Are Created Equal:
 Not All Apps Are Created Equal: Analysis of Spatiotemporal Heterogeneity in Nationwide Mobile Service Usage Cristina Marquez and Marco Gramaglia (Universidad Carlos III de Madrid); Marco Fiore (CNR-IEIIT);
Smart Route Recommendations based on Historical GPS Trajectories and Weather Information
 Smart Route Recommendations based on Historical GPS Trajectories and Weather Information Xingzhe Xie1, Kevin Wong2, Hamid Aghajan2 and Wilfried Philips1 1 TELIN IPI iminds, Ghent University, Belgium 2
A route map to calibrate spatial interaction models from GPS movement data
 A route map to calibrate spatial interaction models from GPS movement data K. Sila-Nowicka 1, A.S. Fotheringham 2 1 Urban Big Data Centre School of Political and Social Sciences University of Glasgow Lilybank
Vehicle Routing and Scheduling. Martin Savelsbergh The Logistics Institute Georgia Institute of Technology
 Vehicle Routing and Scheduling Martin Savelsbergh The Logistics Institute Georgia Institute of Technology Vehicle Routing and Scheduling Part II: Algorithmic Enhancements Handling Practical Complexities
Encapsulating Urban Traffic Rhythms into Road Networks
 Encapsulating Urban Traffic Rhythms into Road Networks Junjie Wang +, Dong Wei +, Kun He, Hang Gong, Pu Wang * School of Traffic and Transportation Engineering, Central South University, Changsha, Hunan,
DANIEL WILSON AND BEN CONKLIN. Integrating AI with Foundation Intelligence for Actionable Intelligence
 DANIEL WILSON AND BEN CONKLIN Integrating AI with Foundation Intelligence for Actionable Intelligence INTEGRATING AI WITH FOUNDATION INTELLIGENCE FOR ACTIONABLE INTELLIGENCE in an arms race for artificial
Travel Time Calculation With GIS in Rail Station Location Optimization
 Travel Time Calculation With GIS in Rail Station Location Optimization Topic Scope: Transit II: Bus and Rail Stop Information and Analysis Paper: # UC8 by Sutapa Samanta Doctoral Student Department of
GISLab (UK) School of Computing and Mathematical Sciences Liverpool John Moores University, UK. Dr. Michael Francis. Keynote Presentation
 School of Computing and Mathematical Sciences Liverpool John Moores University, UK. Dr. Michael Francis. Keynote Presentation") GISLab (UK) School of Computing and Mathematical Sciences Liverpool John Moores University, UK Dr. Michael Francis Keynote Presentation Dr. Michael Francis North-West GIS Research Laboratory, LJMU, Liverpool,
GISLab (UK) School of Computing and Mathematical Sciences Liverpool John Moores University, UK Dr. Michael Francis Keynote Presentation Dr. Michael Francis North-West GIS Research Laboratory, LJMU, Liverpool,
A Heterogeneous Model Integration for Multi-source Urban Infrastructure Data
 A Heterogeneous Model Integration for Multi-source Urban Infrastructure Data DESHENG ZHANG, Rutgers University, USA JUANJUAN ZHAO, Shenzhen Institutes of Advanced Technology, China FAN ZHANG, Shenzhen
GIS-BASED VISUALIZATION FOR ESTIMATING LEVEL OF SERVICE Gozde BAKIOGLU 1 and Asli DOGRU 2
 Presented at the FIG Congress 2018, May 6-11, 2018 in Istanbul, Turkey GIS-BASED VISUALIZATION FOR ESTIMATING LEVEL OF SERVICE Gozde BAKIOGLU 1 and Asli DOGRU 2 1 Department of Transportation Engineering,
Urban Link Travel Time Estimation Using Large-scale Taxi Data with Partial Information
 Urban Link Travel Time Estimation Using Large-scale Taxi Data with Partial Information * Satish V. Ukkusuri * * Civil Engineering, Purdue University 24/04/2014 Outline Introduction Study Region Link Travel
PATREC PERSPECTIVES Sensing Technology Innovations for Tracking Congestion
 PATREC PERSPECTIVES Sensing Technology Innovations for Tracking Congestion Drivers have increasingly been using inexpensive mapping applications imbedded into mobile devices (like Google Maps, MapFactor,
Traffic and Road Monitoring and Management System for Smart City Environment
 Traffic and Road Monitoring and Management System for Smart City Environment Cyrel Ontimare Manlises Mapua Institute of Technology Manila, Philippines IoT on Traffic Law Enforcement to Vehicles with the
Spatial Data, Spatial Analysis and Spatial Data Science
 Spatial Data, Spatial Analysis and Spatial Data Science Luc Anselin http://spatial.uchicago.edu 1 spatial thinking in the social sciences spatial analysis spatial data science spatial data types and research
GIS Based Transit Information System for Metropolitan Cities in India
 PAPER REFERENCE NO.: PN-250 GIS Based Transit Information System for Metropolitan Cities in India Pal, Sarvjeet. a and Singh, Varun. b a M. Tech. (GIS & Remote Sensing); GIS Cell; Motilal Nehru National
Modelling Spatial Behaviour in Music Festivals Using Mobile Generated Data and Machine Learning
 Modelling Spatial Behaviour in Music Festivals Using Mobile Generated Data and Machine Learning Luis Francisco Mejia Garcia *1, Guy Lansley 2 and Ben Calnan 3 1 Department of Civil, Environmental & Geomatic
The Changing Landscape of Land Administration
 The Changing Landscape of Land Administration B r e n t J o n e s P E, PLS E s r i World s Largest Media Company No Journalists No Content Producers No Photographers World s Largest Hospitality Company
Analysis Based on SVM for Untrusted Mobile Crowd Sensing
 Analysis Based on SVM for Untrusted Mobile Crowd Sensing * Ms. Yuga. R. Belkhode, Dr. S. W. Mohod *Student, Professor Computer Science and Engineering, Bapurao Deshmukh College of Engineering, India. *Email
Weather and Travel Time Decision Support
 Weather and Travel Time Decision Support Gerry Wiener, Amanda Anderson, Seth Linden, Bill Petzke, Padhrig McCarthy, James Cowie, Thomas Brummet, Gabriel Guevara, Brenda Boyce, John Williams, Weiyan Chen
Modeling evacuation plan problems
 Chapter 7 Modeling evacuation plan problems In Section 3.1 we reviewed the recommendations that the UNESCO presented in [30] to develop volcanic emergency plans. In [18] is presented the state of art of
Oak Ridge Urban Dynamics Institute
 Oak Ridge Urban Dynamics Institute Presented to ORNL NEED Workshop Budhendra Bhaduri, Director Corporate Research Fellow July 30, 2014 Oak Ridge, TN Our societal challenges and solutions are often local
Understanding Travel Time to Airports in New York City Sierra Gentry Dominik Schunack
 Understanding Travel Time to Airports in New York City Sierra Gentry Dominik Schunack 1 Introduction Even with the rising competition of rideshare services, many in New York City still utilize taxis for
Detecting Origin-Destination Mobility Flows From Geotagged Tweets in Greater Los Angeles Area
 Detecting Origin-Destination Mobility Flows From Geotagged Tweets in Greater Los Angeles Area Song Gao 1, Jiue-An Yang 1,2, Bo Yan 1, Yingjie Hu 1, Krzysztof Janowicz 1, Grant McKenzie 1 1 STKO Lab, Department
Predicting flight on-time performance
 1 Predicting flight on-time performance Arjun Mathur, Aaron Nagao, Kenny Ng I. INTRODUCTION Time is money, and delayed flights are a frequent cause of frustration for both travellers and airline companies.
Clustering Analysis of London Police Foot Patrol Behaviour from Raw Trajectories
 Clustering Analysis of London Police Foot Patrol Behaviour from Raw Trajectories Jianan Shen 1, Tao Cheng 2 1 SpaceTimeLab for Big Data Analytics, Department of Civil, Environmental and Geomatic Engineering,
Regularity and Conformity: Location Prediction Using Heterogeneous Mobility Data
 Regularity and Conformity: Location Prediction Using Heterogeneous Mobility Data Yingzi Wang 12, Nicholas Jing Yuan 2, Defu Lian 3, Linli Xu 1 Xing Xie 2, Enhong Chen 1, Yong Rui 2 1 University of Science
Social and Technological Network Analysis: Spatial Networks, Mobility and Applications
 Social and Technological Network Analysis: Spatial Networks, Mobility and Applications Anastasios Noulas Computer Laboratory, University of Cambridge February 2015 Today s Outline 1. Introduction to spatial
TRAITS to put you on the map
 TRAITS to put you on the map Know what s where See the big picture Connect the dots Get it right Use where to say WOW Look around Spread the word Make it yours Finding your way Location is associated with
Discovering Urban Spatial-Temporal Structure from Human Activity Patterns
 ACM SIGKDD International Workshop on Urban Computing (UrbComp 2012) Discovering Urban Spatial-Temporal Structure from Human Activity Patterns Shan Jiang, shanjang@mit.edu Joseph Ferreira, Jr., jf@mit.edu
GIS = Geographic Information Systems;
 What is GIS GIS = Geographic Information Systems; What Information are we talking about? Information about anything that has a place (e.g. locations of features, address of people) on Earth s surface,
Outline. 15. Descriptive Summary, Design, and Inference. Descriptive summaries. Data mining. The centroid
 Outline 15. Descriptive Summary, Design, and Inference Geographic Information Systems and Science SECOND EDITION Paul A. Longley, Michael F. Goodchild, David J. Maguire, David W. Rhind 2005 John Wiley
Lesson 6: Graphs of Linear Functions and Rate of Change
 Lesson 6 Lesson 6: Graphs of Linear Functions and Rate of Change Classwork Opening Exercise Functions 1, 2, and 3 have the tables shown below. Examine each of them, make a conjecture about which will be
Changes in the Spatial Distribution of Mobile Source Emissions due to the Interactions between Land-use and Regional Transportation Systems
 Changes in the Spatial Distribution of Mobile Source Emissions due to the Interactions between Land-use and Regional Transportation Systems A Framework for Analysis Urban Transportation Center University
Designing smart & Resilient cities:
 Designing smart & Resilient cities: How can Egyptian cities learn from an emerging global practice On the Cuspof Change Professor Samer Bagaeen FRICS MRTPI FRSA AoU 1. GLOBAL CHALLENGES POPULATION GROWTH,
What is 511? Need for 511 Services. Development & Deployment of Regional Road and Weather Information Supporting 511 Traveler Services
 Development & Deployment of Regional Road and Weather Information Supporting 511 Traveler Services Leon F. Osborne University of North Dakota Regional Weather Information Center Grand Forks, ND David L.
UAPD: Predicting Urban Anomalies from Spatial-Temporal Data
 UAPD: Predicting Urban Anomalies from Spatial-Temporal Data Xian Wu, Yuxiao Dong, Chao Huang, Jian Xu, Dong Wang and Nitesh V. Chawla* Department of Computer Science and Engineering University of Notre
Inferring Friendship from Check-in Data of Location-Based Social Networks
 Inferring Friendship from Check-in Data of Location-Based Social Networks Ran Cheng, Jun Pang, Yang Zhang Interdisciplinary Centre for Security, Reliability and Trust, University of Luxembourg, Luxembourg
Modelling, Simulation & Computing Laboratory (msclab) Faculty of Engineering, Universiti Malaysia Sabah, Malaysia
 Faculty of Engineering, Universiti Malaysia Sabah, Malaysia") 1.0 Introduction Intelligent Transportation Systems (ITS) Long term congestion solutions Advanced technologies Facilitate complex transportation systems Dynamic Modelling of transportation (on-road traffic):
1.0 Introduction Intelligent Transportation Systems (ITS) Long term congestion solutions Advanced technologies Facilitate complex transportation systems Dynamic Modelling of transportation (on-road traffic):
Application of GIS in Public Transportation Case-study: Almada, Portugal
 Case-study: Almada, Portugal Doutor Jorge Ferreira 1 FSCH/UNL Av Berna 26 C 1069-061 Lisboa, Portugal +351 21 7908300 jr.ferreira@fcsh.unl.pt 2 FSCH/UNL Dra. FCSH/UNL +351 914693843, leite.ines@gmail.com
Travel and Transportation
 A) Locations: B) Time 1) in the front 4) by the window 7) earliest 2) in the middle 5) on the isle 8) first 3) in the back 6) by the door 9) next 10) last 11) latest B) Actions: 1) Get on 2) Get off 3)
CEE 320 Midterm Examination (50 minutes)
") CEE 320 Midterm Examination (50 minutes) Fall 2009 Please write your name on this cover. Please write your last name on all other exam pages This exam is NOT open book, but you are allowed to use one 8.5x11
CEE 320 Midterm Examination (50 minutes) Fall 2009 Please write your name on this cover. Please write your last name on all other exam pages This exam is NOT open book, but you are allowed to use one 8.5x11
City of Hermosa Beach Beach Access and Parking Study. Submitted by. 600 Wilshire Blvd., Suite 1050 Los Angeles, CA
 City of Hermosa Beach Beach Access and Parking Study Submitted by 600 Wilshire Blvd., Suite 1050 Los Angeles, CA 90017 213.261.3050 January 2015 TABLE OF CONTENTS Introduction to the Beach Access and Parking
Mobility Analytics through Social and Personal Data. Pierre Senellart
 Mobility Analytics through Social and Personal Data Pierre Senellart Session: Big Data & Transport Business Convention on Big Data Université Paris-Saclay, 25 novembre 2015 Analyzing Transportation and
IMPROVING INFRASTRUCTURE FOR TRANSPORTATION SYSTEMS USING CLUSTERING
 IMPROVING INFRASTRUCTURE FOR TRANSPORTATION SYSTEMS USING CLUSTERING Presented By: Apeksha Aggarwal Research Scholar, C.S.E. Department, IIT Roorkee Supervisor: Dr. Durga Toshniwal Associate Professor,
Texas A&M University
 Texas A&M University CVEN 658 Civil Engineering Applications of GIS Hotspot Analysis of Highway Accident Spatial Pattern Based on Network Spatial Weights Instructor: Dr. Francisco Olivera Author: Zachry
New Directions in Computer Science
 New Directions in Computer Science John Hopcroft Cornell University Time of change The information age is a revolution that is changing all aspects of our lives. Those individuals, institutions, and nations
About Nnergix +2, More than 2,5 GW forecasted. Forecasting in 5 countries. 4 predictive technologies. More than power facilities
 About Nnergix +2,5 5 4 +20.000 More than 2,5 GW forecasted Forecasting in 5 countries 4 predictive technologies More than 20.000 power facilities Nnergix s Timeline 2012 First Solar Photovoltaic energy
ArcGIS GeoAnalytics Server: An Introduction. Sarah Ambrose and Ravi Narayanan
 ArcGIS GeoAnalytics Server: An Introduction Sarah Ambrose and Ravi Narayanan Overview Introduction Demos Analysis Concepts using GeoAnalytics Server GeoAnalytics Data Sources GeoAnalytics Server Administration
SGA-2: WP6- Early estimates. SURS: Boro Nikić, Tomaž Špeh ESSnet Big Data Project Brussels 26.,
 SGA-2: WP6- Early estimates SURS: Boro Nikić, Tomaž Špeh ESSnet Big Data Project Brussels 26.,27.10. 2017 Outline WP6 state of affairs WP6 pilot: Early estimates of economic indicators Methods Data sources
LAND USE CLASSIFICATION FROM COMBINED USE OF REMOTE SENSING AND SOCIAL SENSING DATA
 LAND USE CLASSIFICATION FROM COMBINED USE OF REMOTE SENSING AND SOCIAL SENSING DATA Adindha Surya Anugraha 1, Hone-Jay Chu 1 * 1 Dept. of Geomatics, National Cheng Kung University, Taiwan adindha.surya@gmail.com,
Visualisation of Spatial Data
 Visualisation of Spatial Data VU Visual Data Science Johanna Schmidt WS 2018/19 2 Visual Data Science Introduction to Visualisation Basics of Information Visualisation Charts and Techniques Introduction
Spatial Extension of the Reality Mining Dataset
 R&D Centre for Mobile Applications Czech Technical University in Prague Spatial Extension of the Reality Mining Dataset Michal Ficek, Lukas Kencl sponsored by Mobility-Related Applications Wanted! Urban
Assessing spatial distribution and variability of destinations in inner-city Sydney from travel diary and smartphone location data
 Assessing spatial distribution and variability of destinations in inner-city Sydney from travel diary and smartphone location data Richard B. Ellison 1, Adrian B. Ellison 1 and Stephen P. Greaves 1 1 Institute
INTRODUCTION TO GEOGRAPHIC INFORMATION SYSTEM By Reshma H. Patil
 INTRODUCTION TO GEOGRAPHIC INFORMATION SYSTEM By Reshma H. Patil ABSTRACT:- The geographical information system (GIS) is Computer system for capturing, storing, querying analyzing, and displaying geospatial
UnSAID: Uncertainty and Structure in the Access to Intensional Data
 UnSAID: Uncertainty and Structure in the Access to Intensional Data Pierre Senellart 3 July 214, Univ. Rennes 1 Uncertain data is everywhere Numerous sources of uncertain data: Measurement errors Data
Yahoo! Labs Nov. 1 st, Liangjie Hong, Ph.D. Candidate Dept. of Computer Science and Engineering Lehigh University
 Yahoo! Labs Nov. 1 st, 2012 Liangjie Hong, Ph.D. Candidate Dept. of Computer Science and Engineering Lehigh University Motivation Modeling Social Streams Future work Motivation Modeling Social Streams
Mapping Accessibility Over Time
 Journal of Maps, 2006, 76-87 Mapping Accessibility Over Time AHMED EL-GENEIDY and DAVID LEVINSON University of Minnesota, 500 Pillsbury Drive S.E., Minneapolis, MN 55455, USA; geneidy@umn.edu (Received
An Implementation of Mobile Sensing for Large-Scale Urban Monitoring
 An Implementation of Mobile Sensing for Large-Scale Urban Monitoring Teerayut Horanont 1, Ryosuke Shibasaki 1,2 1 Department of Civil Engineering, University of Tokyo, Meguro, Tokyo 153-8505, JAPAN Email:
IV Course Spring 14. Graduate Course. May 4th, Big Spatiotemporal Data Analytics & Visualization
 Spatiotemporal Data Visualization IV Course Spring 14 Graduate Course of UCAS May 4th, 2014 Outline What is spatiotemporal data? How to analyze spatiotemporal data? How to visualize spatiotemporal data?
Automatic Classification of Location Contexts with Decision Trees
 Automatic Classification of Location Contexts with Decision Trees Maribel Yasmina Santos and Adriano Moreira Department of Information Systems, University of Minho, Campus de Azurém, 4800-058 Guimarães,
2.1 Traffic Stream Characteristics. Time Space Diagram and Measurement Procedures Variables of Interest
 2.1 Traffic Stream Characteristics Time Space Diagram and Measurement Procedures Variables of Interest Traffic Stream Models 2.1 Traffic Stream Characteristics Time Space Diagram Speed =100km/h = 27.78
Twitter s Effectiveness on Blackout Detection during Hurricane Sandy
 Twitter s Effectiveness on Blackout Detection during Hurricane Sandy KJ Lee, Ju-young Shin & Reza Zadeh December, 03. Introduction Hurricane Sandy developed from the Caribbean stroke near Atlantic City,
Reproducible AGILE
 Reproducible Research @ AGILE The term Reproducible Research refers to the idea that the ultimate product of academic research is a scientific paper published along with the data, methods and full computational
Geographical Bias on Social Media and Geo-Local Contents System with Mobile Devices
 212 45th Hawaii International Conference on System Sciences Geographical Bias on Social Media and Geo-Local Contents System with Mobile Devices Kazunari Ishida Hiroshima Institute of Technology k.ishida.p7@it-hiroshima.ac.jp
Modeling Crowd Flows Network to Infer Origins and Destinations of Crowds from Cellular Data
 Modeling Crowd Flows Network to Infer Origins and Destinations of Crowds from Cellular Data Ai-Jou Chou ajchou@cs.nctu.edu.tw Gunarto Sindoro Njoo gunarto.cs01g@g2.nctu.edu.tw Wen-Chih Peng wcpeng@cs.nctu.edu.tw
Surge Pricing and Labor Supply in the Ride- Sourcing Market
 Surge Pricing and Labor Supply in the Ride- Sourcing Market Yafeng Yin Professor Department of Civil and Environmental Engineering University of Michigan, Ann Arbor *Joint work with Liteng Zha (@Amazon)
Discovering Geographical Topics in Twitter
 Discovering Geographical Topics in Twitter Liangjie Hong, Lehigh University Amr Ahmed, Yahoo! Research Alexander J. Smola, Yahoo! Research Siva Gurumurthy, Twitter Kostas Tsioutsiouliklis, Twitter Overview
Estimating Large Scale Population Movement ML Dublin Meetup
 Deutsche Bank COO Chief Data Office Estimating Large Scale Population Movement ML Dublin Meetup John Doyle PhD Assistant Vice President CDO Research & Development Science & Innovation john.doyle@db.com
Techniques for Science Teachers: Using GIS in Science Classrooms.
 Techniques for Science Teachers: Using GIS in Science Classrooms. After ESRI, 2008 GIS A Geographic Information System A collection of computer hardware, software, and geographic data used together for
ArcGIS is Advancing. Both Contributing and Integrating many new Innovations. IoT. Smart Mapping. Smart Devices Advanced Analytics
 ArcGIS is Advancing IoT Smart Devices Advanced Analytics Smart Mapping Real-Time Faster Computing Web Services Crowdsourcing Sensor Networks Both Contributing and Integrating many new Innovations ArcGIS
You are Building Your Organization s Geographic Knowledge
 You are Building Your Organization s Geographic Knowledge And Increasingly Making it Available Sharing Data Publishing Maps and Geo-Apps Developing Collaborative Approaches Citizens Knowledge Workers Analysts
Measuring Social Functions of City Regions from Large-scale Taxi Behaviors
 Work in Progress workshop at PerCom 2 Measuring Social Functions of City Regions from Large-scale Taxi Behaviors Guande Qi, Xiaolong Li, Shijian Li, Gang Pan and Zonghui Wang Department of Computer Science
CIV3703 Transport Engineering. Module 2 Transport Modelling
 CIV3703 Transport Engineering Module Transport Modelling Objectives Upon successful completion of this module you should be able to: carry out trip generation calculations using linear regression and category
The Challenge of Geospatial Big Data Analysis
 288 POSTERS The Challenge of Geospatial Big Data Analysis Authors - Teerayut Horanont, University of Tokyo, Japan - Apichon Witayangkurn, University of Tokyo, Japan - Shibasaki Ryosuke, University of Tokyo,
Traffic flows analysis and visualization based on data from an advanced Vilnius traveller s information system
 The 9 th International Conference ENVIRONMENTAL ENGINEERING 22 23 May 2014, Vilnius, Lithuania SELECTED PAPERS eissn 2029-7092 / eisbn 978-609-457-640-9 Available online at http://enviro.vgtu.lt Section:
1.225 Transportation Flow Systems Quiz (December 17, 2001; Duration: 3 hours)
") 1.225 Transportation Flow Systems Quiz (December 17, 2001; Duration: 3 hours) Student Name: Alias: Instructions: 1. This exam is open-book 2. No cooperation is permitted 3. Please write down your name
1.225 Transportation Flow Systems Quiz (December 17, 2001; Duration: 3 hours) Student Name: Alias: Instructions: 1. This exam is open-book 2. No cooperation is permitted 3. Please write down your name
Real-Time Travel Time Prediction Using Multi-level k-nearest Neighbor Algorithm and Data Fusion Method
 1861 Real-Time Travel Time Prediction Using Multi-level k-nearest Neighbor Algorithm and Data Fusion Method Sehyun Tak 1, Sunghoon Kim 2, Kiate Jang 3 and Hwasoo Yeo 4 1 Smart Transportation System Laboratory,