Urban Computing Using Big Data to Solve Urban Challenges
|
|
|
- Osborn Reeves
- 6 years ago
- Views:
Transcription


1 Urban Computing Using Big Data to Solve Urban Challenges Dr. Yu Zheng Lead Researcher, Microsoft Research Chair Professor at Shanghai Jiao Tong University


2 Big Challenges in Big Cities


3 Big Data in Cities

4 Service Providing Improve urban planning, Ease Traffic Congestion, Save Energy, Reduce Air Pollution,... The Environment Urban Data Analytics Win Data Mining, Machine Learning, Visualization Urban Data Management Spatio-temporal index, streaming, trajectory, and graph data management,... People Win Urban Computing Win Cities OS Human mobility Traffic Air Quality Meteorolo gy Social Media Energy Road Networks POIs Urban Sensing & Data Acquisition Participatory Sensing, Crowd Sensing, Mobile Sensing Tackle the Big challenges in Big cities using Big data! Zheng, Y., et al. Urban Computing: concepts, methodologies, and applications. ACM transactions on Intelligent Systems and Technology.
 Loose control and unreliable data missing and skewed distribution Unstructured, implicit, and noisy data Trade off among energy, privacy and the utility of the data")
5 Key Focuses and Challenges Sensing city dynamics Unobtrusively, automatically, and constantly A variety of sensors: Mobile phones, vehicles, cameras, loops, Human as a sensor: User generated content (check in, photos, tweets) Loose control and unreliable data missing and skewed distribution Unstructured, implicit, and noisy data Trade off among energy, privacy and the utility of the data Computing with heterogeneous data sources Geospatial, temporal, social, text, images, economic, environmental, Learn mutually reinforced knowledge across a diversity of data Efficiency + Effectiveness: Data Management + Mining + Machine Learning Blending the physical and virtual worlds Serving both people and cities (virtually and physically) Hybrid systems: Mobile + Cloud, crowd sourcing, participatory sensing Yu Zheng, et al. Urban Computing: concepts, methodologies, and applications. ACM Trans. on Intelligent Systems and Technology. 2014

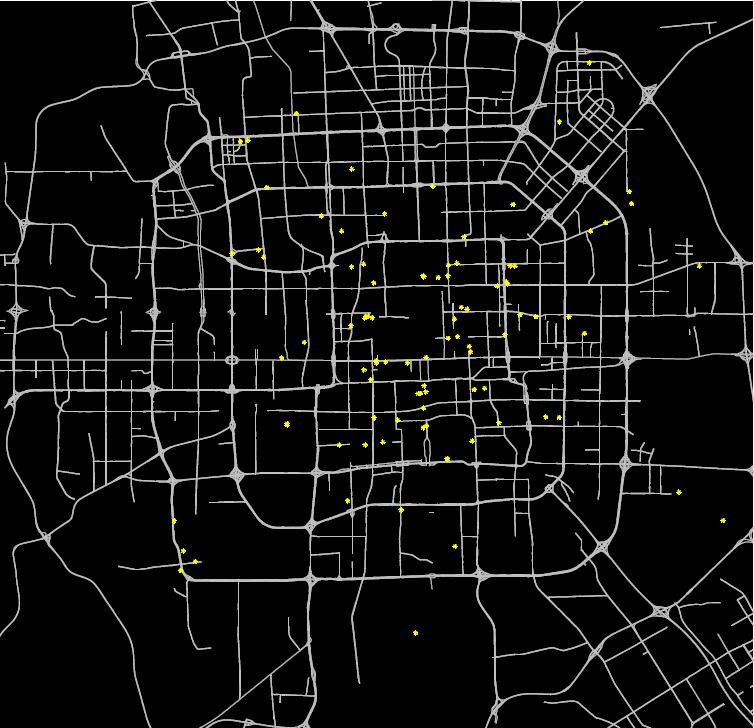
6 Beijing road networks km 40 km 2011: 121,771 nodes and 162,246 segments, 19,524km

7 POI Data ( )


8

9 Air Quality Data

10 Meteorological data
11 Check-in data Check-in: Entertainment Check-ins: Nightlife Spot

12 Urban Noises

13 GPS trajectories of 33,000 taxis from 2009 to 2013

14

15 Heat Maps of Beijing (2011)


 (d) (e)")


16 (b) KDD 12 and ICDE 2012 Route Construction from Uncertain Trajectories (c) (d) (e) ACM SIGSPAITAL GIS 10 best paper runner-up, KDD 11 Finding Smart Driving Directions Discovery of Functional Regions KDD 12 Ubicomp 11 Passengers-Cabbie Recommender system Anomalous Events Detection KDD 11 and ICDM 2012 Ubicomp 11 Best paper nominee Urban Computing for Urban Planning


17 UbiComp 2014 Diagnose urban noises using big data Infer air quality using big data KDD 2013 KDD 2014 Real-time gas consumption and pollution emission Best paper Award in ICDE 2013 Real-time and large-scale dynamic ridesharing KDD 2014 Residential Real estate ranking and clustering UbiComp 2013 Real-time city-scale gas consumption sensing
18 When Urban Air Meets Big Data KDD


19 Background Air quality monitor station S1 50kmx40km S4 S2 S6 S16 S3 S7 S8 S13 S21 S15 S20 S9 S10 S11 S6 S12 S14 S22 S19 S5 S16 S17 S18

20 We do not really know the air quality of a location without a monitoring station!


21 Inferring Real-Time and Fine-Grained air quality throughout a city using Big Data Meteorology Traffic Human Mobility POIs Road networks S1 S4 S2 S6 S16 S3 S7 S8 S13 S21 S15 S20 S9 S10 S11 S6 S12 S14 S22 S19 Historical air quality data Real-time air quality reports S5 S16 S17 S18 Zheng, Y., et al. U-Air: when urban air quality inference meets big data. KDD 2013
22 Difficulties Incorporate multiple heterogeneous data sources into a learning model Spatially-related data: POIs, road networks Temporally-related data: traffic, meteorology, human mobility Data sparseness (little training data) Limited number of stations Many places to infer Efficiency request Massive data Answer instant queries Zheng, Y., et al. U-Air: When Urban Air Quality Inference Meets Big Data. KDD 2013

23 Methodology Overview Partition a city into disjoint grids Extract features for each grid from its impacting region Meteorological features Traffic features Human mobility features POI features Road network features Co-training-based semi-supervised learning model for each pollutant Predict the AQI labels Data sparsity Two classifiers Zheng, Y., et al. U-Air: When Urban Air Quality Inference Meets Big Data. KDD 2013
24 Semi-Supervised Learning Model Philosophy of the model States of air quality Temporal dependency in a location Geo-correlation between locations Generation of air pollutants Emission from a location Propagation among locations Two sets of features Spatially-related Temporally-related Time Co-Training t i t 2 t 1 s 4 s 1 l s 3 s 2 s 4 s l 1 s 2 s 3 s 4 s l 1 s 2 s 3 A location with AQI labels A location to be inferred Temporal dependency Spatial correlation Geospace Spatial Classifier Road Networks: F r POIs: F p Spatial Temporal Classifier Traffic: F t Human mobility: Meteorologic: F h F m Temporal Zheng, Y., et al. U-Air: When Urban Air Quality Inference Meets Big Data. KDD 2013
25 Semi-Supervised Learning Model Temporal classifier (TC) Model the temporal dependency of the air quality in a location Using temporally related features Based on a Linear-Chain Conditional Random Field (CRF) Y t-1 Y t Y t-1 F m (t-1) F t (t-1) F h (t-1) t-1 F m (t) F t (t) F h (t) t F m (t+1) F t (t+1) F h (t+1) t+1 Zheng, Y., et al. U-Air: When Urban Air Quality Inference Meets Big Data. KDD 2013

26 Semi-Supervised Learning Model Spatial classifier (SC) Model the spatial correlation between AQI of different locations Using spatially-related features Based on a BP neural network Input generation Select n stations to pair with Perform m rounds 11 F pp 11 F rr D 11 D 11 l 1 l 1 D 22 xx F pp xx F rr l x l x P 1x 1x R 1x 1x d 1x 1x 1 c 1 w b1 b1 w' w' b' b' 1 1 w 1 1 b'' b'' c x x kk F pp D 11 P kx kx kk F rr D 11 R kx kx b' b' r r w r r l k l k D 22 Input generation d kx kx c k k w pq pq bb q q w' w' qr qr ANN Zheng, Y., et al. U-Air: When Urban Air Quality Inference Meets Big Data. KDD 2013
27 Learning Process of Our Model Labeled data Temporally-related features Yt-1 Yt Yt-1 Unlabeled data Fm(t-1) Ft(t-1) Fh(t-1) t-1 Fm(t) Ft(t) Fh(t) t Fm(t+1) Ft(t+1) Fh(t+1) t+1 Training 1 F p D1 P 1x w11 b1 w'11 Inference 1 F r D1 R 1x b'1 w1 l 1 D2 d 1x F p x F r x l x c 1 b'' c x k F p D1 P kx k F r D1 R kx b'r wr l k D2 d kx Input generation c k wpq bq w'qr ANN Spatially-related features Zheng, Y., et al. U-Air: When Urban Air Quality Inference Meets Big Data. KDD 2013
28 Inference Process Temporally-related features Y t-1 Y t Y t-1 < p c1, p c2,, p cn > F m(t-1) F t(t-1) F h(t-1) t-1 F m(t) F t(t) F h(t) t F m(t+1) F t(t+1) F h(t+1) t+1 1 F p D 1 P 1x w11 b1 w'11 c = arg ci CMax(p ci p ci ) 1 F r D 1 R 1x b'1 l 1 D 2 x x F p F r l x d 1x c 1 w1 b'' c x < p c1, p c2,, p cn > k F p D 1 P kx k F r D 1 R kx b'r wr l k D 2 d kx Input generation c k wpq bq w'qr ANN Spatially-related features Zheng, Y., et al. U-Air: When Urban Air Quality Inference Meets Big Data. KDD 2013

29 Overall performance Evaluation Accuracy U-Air Linear Guassian Classical DT CRF-ALL ANN-ALL Yu Zheng, et al. U-Air: when urban air quality inference meets big data. KDD PM10 NO2 S1 S1 S9 S5 S6 S5 S4 S2 S6 S16 S3 S7 S6 S8 S12 S13 S14 S21 S15 S22 S20 S9 S10 S11 S16 S18 S17 S19 S6 S7 S2 S8 S1 S10 S4 S3 S5 S1 S3 S4 S2 S8 S9 S7 S10 S2 S1 S5 S3 S9 S6 S7 S8 S4 A) Beijing B) Shanghai C) Shenzhen D) Wuhan


30 MS Azure Cloud + Client Urban Air Bing Map Transferred to CityNext and Bing Map China Working with Chinese Ministry of Environmental Protection Forecasting air quality in the near future To identify the root cause of the air pollution
31 Diagnosing Urban Noises using Big Data UbiComp 2014


32 Background Many cities suffer from noise pollutions Traffic, loud music, construction, AC Compromise working efficiency Reduce sleep quality Impair both physical and mental health Urban noise is difficult to model Change over time very quickly Vary by location significantly Depends on sound levels and people s tolerance The composition of noises is hard to analyze Yu Zheng, et al. Diagnosing New York City s Noises with Ubiquitous Data. UbiComp 2014.

33 311 in NYC 311 Data A platform for citizen s non-emergent complaints Associated with a location, timestamp, and a category Human as a sensor crowd sensing Implies people s reaction and tolerance to noises
 Locations B) Correlation in 6am-6pm C) Correlation in 7pm-11pm 24 locations 12")
34 311 in NYC Correlation between 311 complaints and real noise levels Measured the real noise levels of 36 locations in Manhattan People s tolerances vary in time of day Location with few complaints Locations with sufficient complaints A) Locations B) Correlation in 6am-6pm C) Correlation in 7pm-11pm 24 locations 12 locations

 Overall")
35 Goal Weekday:0-5am Weekend: 7pm-11pm Weekday: 6am-6pm Reveal the noise situation of each region in each hour A noise indicator denoting the noisy level Composition of noises in each location POIs Road Networks A) Overall noises B) Construction Check-ins 311 Data about noises C) Noise of different categories in Time Square Weekday:0-5am Weekend: 7pm-11pm Weekday: 6am-6pm Check-in all A) Overall noises B) Construction

![collaborative filtering [r1, r2,, ri,, rn] Noise Categories..................... A an entry.](/docs-images/76/73114479/images/36-1.jpg ".. [c 1, c 2,, c j,, c M ] N d R R Yu Zheng, et al. Diagnosing New York City s Noises with Ubiquitous Data.")
36 Regions Methodology Partition NYC into regions by major roads Build a 3D tensor to model the noises Region Time slot Noise categories Supplement the missing entries through A context-aware tensor decomposition In collaborative filtering [r1, r2,, ri,, rn] Noise Categories A an entry... [c 1, c 2,, c j,, c M ] N d R R Yu Zheng, et al. Diagnosing New York City s Noises with Ubiquitous Data. UbiComp 2014.

![.. [c 1, c 2,, c j,, c M ] N d R M C d C S T R A rec = S R R C C T T L d T L S, R, C, T = 1 2 A S R R](/docs-images/76/73114479/images/37-1.jpg "C C T T 2 + λ 2 S 2 + R 2 + C 2 + T 2 Yu Zheng, et al.")
37 Regions Methodology Simple idea: Tensor Decomposition Not very accurate Need more inputs from other sources Sparsity [r1, r2,, ri,, rn] Noise Categories A an entry... [c 1, c 2,, c j,, c M ] N d R M C d C S T R A rec = S R R C C T T L d T L S, R, C, T = 1 2 A S R R C C T T 2 + λ 2 S 2 + R 2 + C 2 + T 2 Yu Zheng, et al. Diagnosing New York City s Noises with Ubiquitous Data. UbiComp 2014.

38 Methodology Geographical Features Road networks Number of intersections f s r 1 r 2 f s f r f n f d f c Length of road segments in different levels f r POIs X= ri F r F p Total number of POIs f n and density of POIs f d r N Distribution over different categories f c User check-in Road intersection 311 complaint POIs Small streets Major roads Yu Zheng, et al. Diagnosing New York City s Noises with Ubiquitous Data. UbiComp 2014.

39 Methodology Check in data in NYC Gowalla: 127,558 check-ins (4/24/2009 to 10/13/2013) Foursquare: 173,275 check-ins (5/5/2008 to 7/23/2011) Correlation with noises Y implies correlation between different time slots correlation between different regions Proportion Noise - Vehicles Check-in - Art & Entertaiment Time of Day Proportion Noise - Loud music/party Check-in - Nightlife spot Time of Day Y= t 1 t 2 t k r 1 r i r N d 11 r 2 d ki t L d LN Check-in: Entertainment Check-ins: Nightlife Spot Noise: Loud Music/Party Yu Zheng, et al. Diagnosing New York City s Noises with Ubiquitous Data. UbiComp 2014.


40 Methodology Correlation between different noise categories User check-in Categories % Categories % c 1. Loud Music/Party 42.2 c 8. Alarms 1.7 c 2. Construction 17.2 c 9. Private carting noise 0.8 c 3. Loud Talking 14.6 c 10. Manufacturing 0.3 c 4. Vehicle POIs 13.7 c 11. Lawn care equipment 0.3 c 5. AC/Ventilation 3.9 c 12. Horn Honking 0.2 equipment c 6.Banging/Pounding 2.1 c 13. Loud Television 0.1 c 7. Jack Hammering 2.1 c 14. Others 0.8 Road intersection 311 complaint Small streets Major roads Z= c 1 c 2 c j c M c 1 c j c M c 11 c 2 c jj c MM A) weekday B) weekend
41 Time slots Regions Regions Categories Methodology 311 complaints about noises POIs and Road Networks User check-in Features Road intersection Categories X X = R U 311 complaint POIs Small streets Major roads A Categories Z Check-ins Regions Y Y = T R T Check-in all L S, R, C, T, U = 1 2 A S R R C C T T 2 + λ 1 2 X RU 2 + λ 2 2 tr CT L Z C + λ 3 2 S 2 + R 2 + C 2 + T 2 + U 2 + λ 4 2 Y = T R T Y TRT 2
42 Regions Regions Time slots Regions Regions Categories Regions L S, R, C, T, U = 1 2 A S R R C C T T 2 + λ 1 2 X RU 2 + λ 2 tr 2 CT L Z C + λ 3 2 Y TR T 2 + λ 4 2 S 2 + R 2 + C 2 + T 2 + U 2 ]... [r1, r2,, ri,, rn] N [r1, r2,, ri,, rn] d R R Features Noise Categories S R X X = R U d C M... M dc R AN λ 1... [c 1, c 2,, c j,, c M ] Noise Categories A an entry an entry... [c 1, c 2,, c j,, c M ] C d C L ST U [r1, r2,, ri,, rn d T T L A Categories MRegions... d T Y Y = T R T 2 X RU Y = T R N A N d R R d R R an entry C S M d C C S d C T T L T L Noise Categories d TR d T [c1, c2,, cj,, cm] Categories Z 1 c 2 i c j 2 Z ij = i,j = tr C T D Z C = tr(c T L Z C) M 1 2 A S R R C C T T C d C Regions [r 1, r 2,, r i,, r N ] A an entry N S T R T LN T T d R R λ 3 N R S L dr M C 2 Y TRT 2

43
44 Experiments Accuracy of the inferences Remove 30% non-zero entries Metrics: RMSE & MAE Compared with six Baseline methods Methods Weekdays Weekends RMSE MAE RMSE MAE AWR AWH MF Kriging TD TD+ X TD+ X + Y TD+ X + Y+ Z Yu Zheng, et al. Diagnosing New York City s Noises with Ubiquitous Data. UbiComp 2014.
45 Experiments Relative ranking performance Ranked by the inferred noise indicators Ground truth: measured by a mobile phone running a client program Metric: NDCG Data Inferred Data 311 Data Inferred Data 311 Data Inferred Data NDCG@2 NDCG@4 NDCG@6 Daytime Nighttime


46 311 vs. Inferences Experiments 2.75% of entries on weekdays are from 311 data (97.25% by inference) 1.83% of entries on weekends are from 311 data (98.17% by inference) 311 data Inference 311 data Inference 0-6am A) Vehicles (6am-6pm) B) Loud Talking (0-5am)

47 Inferring Gas Consumption and Pollution Emission of Vehicles throughout a City KDD 2014
48 Questions How many liters of gas have been consumed by the vehicles, in the entire city, in the past one hour? What is the volume of PM2.5 that has been generated accordingly?


49 CO 3 4 PM 3 4 PM Gas Consumption Goals Estimate the gas consumption and vehicle emissions on arbitrary road segment at any time intervals using GPS trajectories of a sample of vehicles 2013/09/17 Tuesday 2013/09/21 Saturday 2013/10/02 National Holiday kg/km kg/km Jingbo Shang, Yu Zheng, et al. Inferring Gas Consumption and Pollution Emission of Vehicles throughout a City. KDD 2014.
50 Our Approach Using the GPS trajectories of a sample of vehicles Estimate travel speed on each road segment Infer the traffic volume of each road segment Calculate the gas consumption and emission of vehicles Jingbo Shang, Yu Zheng, et al. Inferring Gas Consumption and Pollution Emission of Vehicles throughout a City. KDD 2014.
51 Difficulties Data sparsity From speed to volume Depends on multiple factors, such as the current travel speeds and density of vehicles the length, shape, and capacity of a road weather conditions Insufficient training data Biased distribution of the samples Real-time and citywide Over 100,000 road segments to infer Need to finish it in a few minutes r 6 r 5 r 3 r 1 d 1 r 2 r 4 Jingbo Shang, Yu Zheng, et al. Inferring Gas Consumption and Pollution Emission of Vehicles throughout a City. KDD 2014.
52 g 1 g 2 g 3 g 4 g 5 g 6 g 7 g 8 g 9 R 10 g 11 g 12 g 13 g 14 g 15 g 16 M G= M G = t i 21 t i+1 gp 1 g 2 g 1 p 3 g p r4 r 1 t j 0 g 1 g 2 g 3 g r 0 2 t 1 22 t t i t j t n v 1 v 2 r 1 v 4 r v 4 4 v 6 v 5 r 2 v r Tr 1 Tr 2 Tr 3 r 1 : (v 1, v 2, v 4 ) r 2 : (v 4, v 5, v 6 ) r 3 : (v 5, v 7 ) r 4 : (v 2, v 3 ) v 7 v 3 r 3 r 6 r 5 r 3 r 1 d 1 r 2 r 4 t i t i+1 g 1 g 2 g 16 g 1 g 2 g 16 t j M G M G t i t i+1 r 1 r 2 r n r 1 r 2 t j M r M r r n r 1 r 2 r n f 1 f 2 f k f r f p f g Y X Z Y T (G; G) T ; X T R; R T ; Z R F T X: denotes fine-grained traffic conditions Y: denotes coarse-grained traffic conditions Z: geographical contexts of road segments L T, R, G, F = 1 Y T G; G T 2 + λ 1 X T R; R T 2 + λ 2 Z RFT 2 + λ 3 ( T R 2 + G 2 + F 2 ), Z
53 Traffic Volume Inference (TVI) Objective: From travel speed to traffic volume Traffic volume depends on the current travel speeds and density of vehicles the length, shape, capacity of a road, and weather conditions Biased distribution between taxis and other vehicles Unsupervised learning approach 30 µ = 5.44 Jingbo Shang, Yu Zheng, et al. Inferring Gas Consumption σ= 3.13 and Pollution Emission of Vehicles throughout a City. KDD observations 5 m #veh/min/lane # observations µ = σ= 6.38 True Traffic Volumes Normal Distribution m 1 m 2 m 3 m 4 m 5 A) Level 0-1 (highways) True Traffic Volumes f r f g f p N p t ɵ α N t N a v w d v
54 Energy and Emission Calculation EF = (a + cv + ev 2 )/(1 + bv + dv 2 ). a b c d e CO Hydrocarbon Nox Fuel Consumption E = EF r. N a r. n r. len Jingbo Shang, Yu Zheng, et al. Inferring Gas Consumption and Pollution Emission of Vehicles throughout a City. KDD 2014.
55 Experiments Evaluation on TSE Methods RMSE of v RMSE of dv Time (sec) MF(M r ) MF(M r + Z) MF(M r + M g + Z) TSE Kriging ,000 KNN RMSE level 0-1 level 2 level 3 level >=4 Speed Variance Jingbo Shang, Yu Zheng, et al. Inferring Gas Consumption and Pollution Emission of Vehicles throughout a City. KDD 2014.
56 Experiments Evaluation on TVI Methods MAE MRE Inference time (us/road) TVI % 7.27 TVI w/o dv % 7.18 TVI w/o w % 7.10 LR % 0.15 FD % 0.13 FD-SC % 0.13 FD-DC % 0.13 level 0-1 level 2 Weekday Weekend MAE MRE 22% 41% 29% 30% Jingbo Shang, Yu Zheng, et al. Inferring Gas Consumption and Pollution Emission of Vehicles throughout a City. KDD 2014.


 0.")
57 Time 7:00 ~ 10:00 10:00~16:00 16:00~20:00 after 20:00 total Level 0, , , ,1 2 3 Holiday Workday Total Efficiency Online components Time Offline components Time Map-matching 4.94min Geo-feature extraction 149s TSE 22.2s Historical pattern extraction 240s TVI (inference) 0.84s TVI learning 89s Total 5.32min Total 478s


58 3 4 PM Gas Consumption CO 3 4 PM Volume 8 9 PM 2013/09/17 Tuesday 2013/09/21 Saturday 2013/10/02 National Holiday veh/min /09/17 Tuesday 2013/09/21 Saturday 2013/10/02 National Holiday kg/km kg/km
 4100K 4000K 3900K 3800K Weekday")

59 Gas consumption NOx emission kg/km/ hour g/km/ hour K 1660 Volume of Gas (L/hour) 4100K 4000K 3900K 3800K Weekday Weekend Holiday KG/hour Weekday Weekend Holiday 3700K Time of Day Time of Day


60 Computing with Multiple Heterogeneous Data Sources 3 4 PM Gas Consumption CO 3 4 PM Regions Categories Regions Time slots Spatial Classifier Road Networks: F r POIs: F p Spatial Temporal Classifier Traffic: F t Human mobility: Meteorologic: Co-Training-based Semi-supervised learning F h F m Temporal Features X A Regions Y X = R U Categories Y = T R T Categories Z 2013/09/17 Tuesday 2013/09/21 Saturday 2013/10/02 National Holiday kg/km Context-aware Tensor Decomposition t i t i+1 t j g 1 g 2 g g 1 g 2 g 16 r 1 r 2 r n r 1 r 2 r n r 1 f 1 f 2 f k 150 t i M t i+1 r 0 M 2 G G M r M r f r f p t j kg/km r n f g f r f g f p t ɵ N t N a w d v Y X Z Matrix Factorization + Graphical Models N p α v
61 Take Away Messages 3B: Big city, Big challenges, Big data 3M: Data Management, Mining and Machine learning 3W: Win-Win-Win: people, city, and the environment 3 BMW


62 Search for Urban Computing Thanks! Download Urban Air App Yu Zheng Homepage
Diagnosing New York City s Noises with Ubiquitous Data
 Diagnosing New York City s Noises with Ubiquitous Data Dr. Yu Zheng yuzheng@microsoft.com Lead Researcher, Microsoft Research Chair Professor at Shanghai Jiao Tong University Background Many cities suffer
Urban Computing Using Big Data to Solve Urban Challenges
 Urban Computing Using Big Data to Solve Urban Challenges Dr. Yu Zheng Lead Researcher, Microsoft Research Asia Chair Professor at Shanghai Jiaotong University http://research.microsoft.com/en-us/projects/urbancomputing/default.aspx
U-Air: When Urban Air Quality Inference Meets Big Data
 U-Air: When Urban Air Quality Inference Meets Big Data Yu Zheng, Furui Liu, Hsun-Ping Hsieh Microsoft Research Asia, Beijing China {yuzheng, v-ful, v-hshsie}@microsoft.com ABSTRACT Information about urban
Where to Find My Next Passenger?
 Where to Find My Next Passenger? Jing Yuan 1 Yu Zheng 2 Liuhang Zhang 1 Guangzhong Sun 1 1 University of Science and Technology of China 2 Microsoft Research Asia September 19, 2011 Jing Yuan et al. (USTC,MSRA)
Urban Computing: Concepts, Methodologies, and Applications
 Urban Computing: Concepts, Methodologies, and Applications YU ZHENG, Microsoft Research LICIA CAPRA, University College London OURI WOLFSON, University of Illinois at Chicago HAI YANG, Hong Kong University
UAPD: Predicting Urban Anomalies from Spatial-Temporal Data
 UAPD: Predicting Urban Anomalies from Spatial-Temporal Data Xian Wu, Yuxiao Dong, Chao Huang, Jian Xu, Dong Wang and Nitesh V. Chawla* Department of Computer Science and Engineering University of Notre
Exploring the Patterns of Human Mobility Using Heterogeneous Traffic Trajectory Data
 Exploring the Patterns of Human Mobility Using Heterogeneous Traffic Trajectory Data Jinzhong Wang April 13, 2016 The UBD Group Mobile and Social Computing Laboratory School of Software, Dalian University
Exploring Human Mobility with Multi-Source Data at Extremely Large Metropolitan Scales. ACM MobiCom 2014, Maui, HI
 Exploring Human Mobility with Multi-Source Data at Extremely Large Metropolitan Scales Desheng Zhang & Tian He University of Minnesota, USA Jun Huang, Ye Li, Fan Zhang, Chengzhong Xu Shenzhen Institute
VISUAL EXPLORATION OF SPATIAL-TEMPORAL TRAFFIC CONGESTION PATTERNS USING FLOATING CAR DATA. Candra Kartika 2015
 VISUAL EXPLORATION OF SPATIAL-TEMPORAL TRAFFIC CONGESTION PATTERNS USING FLOATING CAR DATA Candra Kartika 2015 OVERVIEW Motivation Background and State of The Art Test data Visualization methods Result
Exploiting Geographic Dependencies for Real Estate Appraisal
 Exploiting Geographic Dependencies for Real Estate Appraisal Yanjie Fu Joint work with Hui Xiong, Yu Zheng, Yong Ge, Zhihua Zhou, Zijun Yao Rutgers, the State University of New Jersey Microsoft Research
DM-Group Meeting. Subhodip Biswas 10/16/2014
 DM-Group Meeting Subhodip Biswas 10/16/2014 Papers to be discussed 1. Crowdsourcing Land Use Maps via Twitter Vanessa Frias-Martinez and Enrique Frias-Martinez in KDD 2014 2. Tracking Climate Change Opinions
Spatial Data Science. Soumya K Ghosh
 Workshop on Data Science and Machine Learning (DSML 17) ISI Kolkata, March 28-31, 2017 Spatial Data Science Soumya K Ghosh Professor Department of Computer Science and Engineering Indian Institute of Technology,
Regularity and Conformity: Location Prediction Using Heterogeneous Mobility Data
 Regularity and Conformity: Location Prediction Using Heterogeneous Mobility Data Yingzi Wang 12, Nicholas Jing Yuan 2, Defu Lian 3, Linli Xu 1 Xing Xie 2, Enhong Chen 1, Yong Rui 2 1 University of Science
Urban Link Travel Time Estimation Using Large-scale Taxi Data with Partial Information
 Urban Link Travel Time Estimation Using Large-scale Taxi Data with Partial Information * Satish V. Ukkusuri * * Civil Engineering, Purdue University 24/04/2014 Outline Introduction Study Region Link Travel
PATREC PERSPECTIVES Sensing Technology Innovations for Tracking Congestion
 PATREC PERSPECTIVES Sensing Technology Innovations for Tracking Congestion Drivers have increasingly been using inexpensive mapping applications imbedded into mobile devices (like Google Maps, MapFactor,
Improving the travel time prediction by using the real-time floating car data
 Improving the travel time prediction by using the real-time floating car data Krzysztof Dembczyński Przemys law Gawe l Andrzej Jaszkiewicz Wojciech Kot lowski Adam Szarecki Institute of Computing Science,
1. INTRODUCTION 2. BIG DATA IN URBAN STUDIES 3. LESSONS FROM BIG DATA
 Main Content URBAN SENSING & COMPUTING Sensing and Computing Introduction and Application 王江浩 State Key Laboratory of Resources and Environmental Information System, Institute of Geographic Sciences and
* Abstract. Keywords: Smart Card Data, Public Transportation, Land Use, Non-negative Matrix Factorization.
 Analysis of Activity Trends Based on Smart Card Data of Public Transportation T. N. Maeda* 1, J. Mori 1, F. Toriumi 1, H. Ohashi 1 1 The University of Tokyo, 7-3-1 Hongo Bunkyo-ku, Tokyo, Japan *Email:
Incorporating Spatio-Temporal Smoothness for Air Quality Inference
 2017 IEEE International Conference on Data Mining Incorporating Spatio-Temporal Smoothness for Air Quality Inference Xiangyu Zhao 2, Tong Xu 1, Yanjie Fu 3, Enhong Chen 1, Hao Guo 1 1 Anhui Province Key
Encapsulating Urban Traffic Rhythms into Road Networks
 Encapsulating Urban Traffic Rhythms into Road Networks Junjie Wang +, Dong Wei +, Kun He, Hang Gong, Pu Wang * School of Traffic and Transportation Engineering, Central South University, Changsha, Hunan,
A Heterogeneous Model Integration for Multi-source Urban Infrastructure Data
 A Heterogeneous Model Integration for Multi-source Urban Infrastructure Data DESHENG ZHANG, Rutgers University, USA JUANJUAN ZHAO, Shenzhen Institutes of Advanced Technology, China FAN ZHANG, Shenzhen
Modeling Temporal-Spatial Correlations for Crime Prediction
 Modeling Temporal-Spatial Correlations for Crime Prediction Xiangyu Zhao and Jiliang Tang Michigan State University Background Urban Security and Safety Eg. New York City Weekly Crime Report (NYPD) 1888
Real-Time Travel Time Prediction Using Multi-level k-nearest Neighbor Algorithm and Data Fusion Method
 1861 Real-Time Travel Time Prediction Using Multi-level k-nearest Neighbor Algorithm and Data Fusion Method Sehyun Tak 1, Sunghoon Kim 2, Kiate Jang 3 and Hwasoo Yeo 4 1 Smart Transportation System Laboratory,
Spatial Data, Spatial Analysis and Spatial Data Science
 Spatial Data, Spatial Analysis and Spatial Data Science Luc Anselin http://spatial.uchicago.edu 1 spatial thinking in the social sciences spatial analysis spatial data science spatial data types and research
Inferring Friendship from Check-in Data of Location-Based Social Networks
 Inferring Friendship from Check-in Data of Location-Based Social Networks Ran Cheng, Jun Pang, Yang Zhang Interdisciplinary Centre for Security, Reliability and Trust, University of Luxembourg, Luxembourg
Sensor Deployment Recommendation for 3D Fine-Grained Air Quality Monitoring using Semi-Supervised Learning
 Sensor Deployment Recommendation for 3D Fine-Grained Air Quality Monitoring using Semi-Supervised Learning Yuzhe Yang, Zijie Zheng, Kaigui Bian, Lingyang Song,andZhuHan School of Electrical Engineering
WMO Guide on Integrated Urban Weather, Environment and Climate Services for Cities (IUWECS) Hong Kong- an experience from a high-density city
 Hong Kong- an experience from a high-density city") WMO Guide on Integrated Urban Weather, Environment and Climate Services for Cities (IUWECS) Hong Kong- an experience from a high-density city Dr. Chao REN Associate Professor School of Architecture The
WMO Guide on Integrated Urban Weather, Environment and Climate Services for Cities (IUWECS) Hong Kong- an experience from a high-density city Dr. Chao REN Associate Professor School of Architecture The
Oman NSDI Supporting Economic Development. Saud Al-Nofli Director of Spatial Data Directorate General of NSDI, NCSI
 Oman NSDI Supporting Economic Development 2017 Saud Al-Nofli Director of Spatial Data Directorate General of NSDI, NCSI "It s critical to make correct decisions the first time to optimize the Investments
Mobility Analytics through Social and Personal Data. Pierre Senellart
 Mobility Analytics through Social and Personal Data Pierre Senellart Session: Big Data & Transport Business Convention on Big Data Université Paris-Saclay, 25 novembre 2015 Analyzing Transportation and
Predicting freeway traffic in the Bay Area
 Predicting freeway traffic in the Bay Area Jacob Baldwin Email: jtb5np@stanford.edu Chen-Hsuan Sun Email: chsun@stanford.edu Ya-Ting Wang Email: yatingw@stanford.edu Abstract The hourly occupancy rate
Point-of-Interest Recommendations: Learning Potential Check-ins from Friends
 Point-of-Interest Recommendations: Learning Potential Check-ins from Friends Huayu Li, Yong Ge +, Richang Hong, Hengshu Zhu University of North Carolina at Charlotte + University of Arizona Hefei University
Discovering Urban Spatial-Temporal Structure from Human Activity Patterns
 ACM SIGKDD International Workshop on Urban Computing (UrbComp 2012) Discovering Urban Spatial-Temporal Structure from Human Activity Patterns Shan Jiang, shanjang@mit.edu Joseph Ferreira, Jr., jf@mit.edu
You are Building Your Organization s Geographic Knowledge
 You are Building Your Organization s Geographic Knowledge And Increasingly Making it Available Sharing Data Publishing Maps and Geo-Apps Developing Collaborative Approaches Citizens Knowledge Workers Analysts
Crowd Sensing of Traffic Anomalies based on Human Mobility and Social Media
 Crowd Sensing of Traffic Anomalies based on Human Mobility and Social Media Bei Pan 1 Yu Zheng 2 David Wilkie 3 Cyrus Shahabi 1 1 University of Southern California, Los Angeles, USA 2 Microsoft Research,
Measuring Social Functions of City Regions from Large-scale Taxi Behaviors
 Work in Progress workshop at PerCom 2 Measuring Social Functions of City Regions from Large-scale Taxi Behaviors Guande Qi, Xiaolong Li, Shijian Li, Gang Pan and Zonghui Wang Department of Computer Science
Smart Route Recommendations based on Historical GPS Trajectories and Weather Information
 Smart Route Recommendations based on Historical GPS Trajectories and Weather Information Xingzhe Xie1, Kevin Wong2, Hamid Aghajan2 and Wilfried Philips1 1 TELIN IPI iminds, Ghent University, Belgium 2
Social and Technological Network Analysis: Spatial Networks, Mobility and Applications
 Social and Technological Network Analysis: Spatial Networks, Mobility and Applications Anastasios Noulas Computer Laboratory, University of Cambridge February 2015 Today s Outline 1. Introduction to spatial
A Broad View of Geospatial Technology & Systems
 A Broad View of Geospatial Technology & Systems Pete Large Vice President, Trimble On the shoulders of giants 1 Since their time, our ability to generate geospatial information has grown exponentially
Data Mining II Mobility Data Mining
 Data Mining II Mobility Data Mining F. Giannotti& M. Nanni KDD Lab ISTI CNR Pisa, Italy Outline Mobility Data Mining Introduction MDM methods MDM methods at work. Understanding Human Mobility Clustering
Designing smart & Resilient cities:
 Designing smart & Resilient cities: How can Egyptian cities learn from an emerging global practice On the Cuspof Change Professor Samer Bagaeen FRICS MRTPI FRSA AoU 1. GLOBAL CHALLENGES POPULATION GROWTH,
Oak Ridge Urban Dynamics Institute
 Oak Ridge Urban Dynamics Institute Presented to ORNL NEED Workshop Budhendra Bhaduri, Director Corporate Research Fellow July 30, 2014 Oak Ridge, TN Our societal challenges and solutions are often local
Integrated Electricity Demand and Price Forecasting
 Integrated Electricity Demand and Price Forecasting Create and Evaluate Forecasting Models The many interrelated factors which influence demand for electricity cannot be directly modeled by closed-form
Not All Apps Are Created Equal:
 Not All Apps Are Created Equal: Analysis of Spatiotemporal Heterogeneity in Nationwide Mobile Service Usage Cristina Marquez and Marco Gramaglia (Universidad Carlos III de Madrid); Marco Fiore (CNR-IEIIT);
Differentially Private Real-time Data Release over Infinite Trajectory Streams
 Differentially Private Real-time Data Release over Infinite Trajectory Streams Kyoto University, Japan Department of Social Informatics Yang Cao, Masatoshi Yoshikawa 1 Outline Motivation: opportunity &
Exploring the Impact of Ambient Population Measures on Crime Hotspots
 Exploring the Impact of Ambient Population Measures on Crime Hotspots Nick Malleson School of Geography, University of Leeds http://nickmalleson.co.uk/ N.S.Malleson@leeds.ac.uk Martin Andresen Institute
Belief Propagation for Traffic forecasting
 Belief Propagation for Traffic forecasting Cyril Furtlehner (INRIA Saclay - Tao team) context : Travesti project http ://travesti.gforge.inria.fr/) Anne Auger (INRIA Saclay) Dimo Brockhoff (INRIA Lille)
Metropolitan Wi-Fi Research Network at the Los Angeles State Historic Park
 Metropolitan Wi-Fi Research Network at the Los Angeles State Historic Park Vidyut Samanta vids@remap.ucla.edu Chase Laurelle Alexandria Knowles chase@remap.ucla.edu Jeff Burke jburke@remap.ucla.edu Fabian
DANIEL WILSON AND BEN CONKLIN. Integrating AI with Foundation Intelligence for Actionable Intelligence
 DANIEL WILSON AND BEN CONKLIN Integrating AI with Foundation Intelligence for Actionable Intelligence INTEGRATING AI WITH FOUNDATION INTELLIGENCE FOR ACTIONABLE INTELLIGENCE in an arms race for artificial
Assessing pervasive user-generated content to describe tourist dynamics
 Assessing pervasive user-generated content to describe tourist dynamics Fabien Girardin, Josep Blat Universitat Pompeu Fabra, Barcelona, Spain {Fabien.Girardin, Josep.Blat}@upf.edu Abstract. In recent
Improving forecasting under missing data on sparse spatial networks
 Improving forecasting under missing data on sparse spatial networks J. Haworth 1, T. Cheng 1, E. J. Manley 1 1 SpaceTimeLab, Department of Civil, Environmental and Geomatic Engineering, University College
Research Group Cartography
 Research Group Cartography Research Group Cartography Towards supporting wayfinding LBS components 1. Mobile devices 2. Communication Network 3. Positioning Component 4. Service and Application Provider
The Research of Urban Rail Transit Sectional Passenger Flow Prediction Method
 Journal of Intelligent Learning Systems and Applications, 2013, 5, 227-231 Published Online November 2013 (http://www.scirp.org/journal/jilsa) http://dx.doi.org/10.4236/jilsa.2013.54026 227 The Research
Friendship and Mobility: User Movement In Location-Based Social Networks. Eunjoon Cho* Seth A. Myers* Jure Leskovec
 Friendship and Mobility: User Movement In Location-Based Social Networks Eunjoon Cho* Seth A. Myers* Jure Leskovec Outline Introduction Related Work Data Observations from Data Model of Human Mobility
Detecting Anomaly in Traffic Flow from Road Similarity Analysis
 Detecting Anomaly in Traffic Flow from Road Similarity Analysis Xinran Liu 1, Xingwu Liu 2, Yuanhong Wang 1, Juhua Pu 1,3(B), and Xiangliang Zhang 4 1 The State Key Laboratory of Software Development Environment,
Path and travel time inference from GPS probe vehicle data
 Path and travel time inference from GPS probe vehicle data Timothy Hunter Department of Electrical Engineering and Computer Science University of California, Berkeley tjhunter@eecs.berkeley.edu Pieter
Geographical Bias on Social Media and Geo-Local Contents System with Mobile Devices
 212 45th Hawaii International Conference on System Sciences Geographical Bias on Social Media and Geo-Local Contents System with Mobile Devices Kazunari Ishida Hiroshima Institute of Technology k.ishida.p7@it-hiroshima.ac.jp
Lesson 16: Technology Trends and Research
 http://www.esri.com/library/whitepapers/pdfs/integrated-geoenabled-soa.pdf GEOG DL582 : GIS Data Management Lesson 16: Technology Trends and Research Overview Learning Objective Questions: 1. Why is integration
TRAITS to put you on the map
 TRAITS to put you on the map Know what s where See the big picture Connect the dots Get it right Use where to say WOW Look around Spread the word Make it yours Finding your way Location is associated with
Human resource data location privacy protection method based on prefix characteristics
 Acta Technica 62 No. 1B/2017, 437 446 c 2017 Institute of Thermomechanics CAS, v.v.i. Human resource data location privacy protection method based on prefix characteristics Yulong Qi 1, 2, Enyi Zhou 1
Modeling evacuation plan problems
 Chapter 7 Modeling evacuation plan problems In Section 3.1 we reviewed the recommendations that the UNESCO presented in [30] to develop volcanic emergency plans. In [18] is presented the state of art of
Detecting Origin-Destination Mobility Flows From Geotagged Tweets in Greater Los Angeles Area
 Detecting Origin-Destination Mobility Flows From Geotagged Tweets in Greater Los Angeles Area Song Gao 1, Jiue-An Yang 1,2, Bo Yan 1, Yingjie Hu 1, Krzysztof Janowicz 1, Grant McKenzie 1 1 STKO Lab, Department
Traffic and Road Monitoring and Management System for Smart City Environment
 Traffic and Road Monitoring and Management System for Smart City Environment Cyrel Ontimare Manlises Mapua Institute of Technology Manila, Philippines IoT on Traffic Law Enforcement to Vehicles with the
AREP GAW. AQ Forecasting
 AQ Forecasting What Are We Forecasting Averaging Time (3 of 3) PM10 Daily Maximum Values, 2001 Santiago, Chile (MACAM stations) 300 Level 2 Pre-Emergency Level 1 Alert 200 Air Quality Standard 150 100
Modeling Crowd Flows Network to Infer Origins and Destinations of Crowds from Cellular Data
 Modeling Crowd Flows Network to Infer Origins and Destinations of Crowds from Cellular Data Ai-Jou Chou ajchou@cs.nctu.edu.tw Gunarto Sindoro Njoo gunarto.cs01g@g2.nctu.edu.tw Wen-Chih Peng wcpeng@cs.nctu.edu.tw
Typical information required from the data collection can be grouped into four categories, enumerated as below.
 Chapter 6 Data Collection 6.1 Overview The four-stage modeling, an important tool for forecasting future demand and performance of a transportation system, was developed for evaluating large-scale infrastructure
Area Classification of Surrounding Parking Facility Based on Land Use Functionality
 Open Journal of Applied Sciences, 0,, 80-85 Published Online July 0 in SciRes. http://www.scirp.org/journal/ojapps http://dx.doi.org/0.4/ojapps.0.709 Area Classification of Surrounding Parking Facility
GISLab (UK) School of Computing and Mathematical Sciences Liverpool John Moores University, UK. Dr. Michael Francis. Keynote Presentation
 School of Computing and Mathematical Sciences Liverpool John Moores University, UK. Dr. Michael Francis. Keynote Presentation") GISLab (UK) School of Computing and Mathematical Sciences Liverpool John Moores University, UK Dr. Michael Francis Keynote Presentation Dr. Michael Francis North-West GIS Research Laboratory, LJMU, Liverpool,
GISLab (UK) School of Computing and Mathematical Sciences Liverpool John Moores University, UK Dr. Michael Francis Keynote Presentation Dr. Michael Francis North-West GIS Research Laboratory, LJMU, Liverpool,
QUANTIFICATION OF THE NATURAL VARIATION IN TRAFFIC FLOW ON SELECTED NATIONAL ROADS IN SOUTH AFRICA
 QUANTIFICATION OF THE NATURAL VARIATION IN TRAFFIC FLOW ON SELECTED NATIONAL ROADS IN SOUTH AFRICA F DE JONGH and M BRUWER* AECOM, Waterside Place, Tygerwaterfront, Carl Cronje Drive, Cape Town, South
DO TAXI DRIVERS CHOOSE THE SHORTEST ROUTES?
 DO TAXI DRIVERS CHOOSE THE SHORTEST ROUTES? A Large-Scale Analysis of Route Choice Behavior of Taxi Drivers Using Floating Car Data in Shanghai Junyan Li Superviors: Juliane Cron M.Sc. (Technische Universität
IV Course Spring 14. Graduate Course. May 4th, Big Spatiotemporal Data Analytics & Visualization
 Spatiotemporal Data Visualization IV Course Spring 14 Graduate Course of UCAS May 4th, 2014 Outline What is spatiotemporal data? How to analyze spatiotemporal data? How to visualize spatiotemporal data?
City of Hermosa Beach Beach Access and Parking Study. Submitted by. 600 Wilshire Blvd., Suite 1050 Los Angeles, CA
 City of Hermosa Beach Beach Access and Parking Study Submitted by 600 Wilshire Blvd., Suite 1050 Los Angeles, CA 90017 213.261.3050 January 2015 TABLE OF CONTENTS Introduction to the Beach Access and Parking
Multi-Plant Photovoltaic Energy Forecasting Challenge with Regression Tree Ensembles and Hourly Average Forecasts
 Multi-Plant Photovoltaic Energy Forecasting Challenge with Regression Tree Ensembles and Hourly Average Forecasts Kathrin Bujna 1 and Martin Wistuba 2 1 Paderborn University 2 IBM Research Ireland Abstract.
Measurement of human activity using velocity GPS data obtained from mobile phones
 Measurement of human activity using velocity GPS data obtained from mobile phones Yasuko Kawahata 1 Takayuki Mizuno 2 and Akira Ishii 3 1 Graduate School of Information Science and Technology, The University
City-wide examining transport network accessibility using taxi GPS data
 City-wide examining transport network accessibility using taxi GPS data Jianxun Cui 1, Feng Liu 2,3, Davy Janssens 2, An Shi 1 and Geert Wets 2 1 School of Transportation Science and Engineering, Harbin
Automatic Classification of Location Contexts with Decision Trees
 Automatic Classification of Location Contexts with Decision Trees Maribel Yasmina Santos and Adriano Moreira Department of Information Systems, University of Minho, Campus de Azurém, 4800-058 Guimarães,
Visualisation of Spatial Data
 Visualisation of Spatial Data VU Visual Data Science Johanna Schmidt WS 2018/19 2 Visual Data Science Introduction to Visualisation Basics of Information Visualisation Charts and Techniques Introduction
Future Proofing the Provision of Geoinformation: Emerging Technologies
 Future Proofing the Provision of Geoinformation: Emerging Technologies An Exchange Forum with the Geospatial Industry William Cartwright Chair JBGIS Second High Level Forum on Global Geospatial Information
Discovering Geographical Topics in Twitter
 Discovering Geographical Topics in Twitter Liangjie Hong, Lehigh University Amr Ahmed, Yahoo! Research Alexander J. Smola, Yahoo! Research Siva Gurumurthy, Twitter Kostas Tsioutsiouliklis, Twitter Overview
An Interactive Visualization System to Analyze and Predict Urban Construction Dynamics
 An Interactive Visualization System to Analyze and Predict Urban Construction Dynamics Tzu-Chi Yen Sensoro Technology Co., Ltd., Beijing, China junipertcy@gmail.com Hsun-Ping Hsieh National Taiwan University
ArcGIS is Advancing. Both Contributing and Integrating many new Innovations. IoT. Smart Mapping. Smart Devices Advanced Analytics
 ArcGIS is Advancing IoT Smart Devices Advanced Analytics Smart Mapping Real-Time Faster Computing Web Services Crowdsourcing Sensor Networks Both Contributing and Integrating many new Innovations ArcGIS
Transportation and Road Weather
 Portland State University PDXScholar TREC Friday Seminar Series Transportation Research and Education Center (TREC) 4-18-2014 Transportation and Road Weather Rhonda Young University of Wyoming Let us know
Believe it Today or Tomorrow? Detecting Untrustworthy Information from Dynamic Multi-Source Data
 SDM 15 Vancouver, CAN Believe it Today or Tomorrow? Detecting Untrustworthy Information from Dynamic Multi-Source Data Houping Xiao 1, Yaliang Li 1, Jing Gao 1, Fei Wang 2, Liang Ge 3, Wei Fan 4, Long
California Urban Infill Trip Generation Study. Jim Daisa, P.E.
 California Urban Infill Trip Generation Study Jim Daisa, P.E. What We Did in the Study Develop trip generation rates for land uses in urban areas of California Establish a California urban land use trip
Data Collection. Lecture Notes in Transportation Systems Engineering. Prof. Tom V. Mathew. 1 Overview 1
 Data Collection Lecture Notes in Transportation Systems Engineering Prof. Tom V. Mathew Contents 1 Overview 1 2 Survey design 2 2.1 Information needed................................. 2 2.2 Study area.....................................
Innovation in mapping and photogrammetry at the Survey of Israel
 16, October, 2017 Innovation in mapping and photogrammetry at the Survey of Israel Yaron Felus and Ronen Regev Contents Why HD mapping? Government requirements Mapping regulations o Quality requirements
Analysis Based on SVM for Untrusted Mobile Crowd Sensing
 Analysis Based on SVM for Untrusted Mobile Crowd Sensing * Ms. Yuga. R. Belkhode, Dr. S. W. Mohod *Student, Professor Computer Science and Engineering, Bapurao Deshmukh College of Engineering, India. *Email
UnSAID: Uncertainty and Structure in the Access to Intensional Data
 UnSAID: Uncertainty and Structure in the Access to Intensional Data Pierre Senellart 3 July 214, Univ. Rennes 1 Uncertain data is everywhere Numerous sources of uncertain data: Measurement errors Data
VGIscience Summer School Interpretation, Visualisation and Social Computing of Volunteered Geographic Information (VGI)
") VGIscience Summer School Interpretation, Visualisation and Social Computing of Volunteered Geographic Information (VGI) TU Dresden, 11.-15. September 2017 Welcome PhD students working on research topics
VGIscience Summer School Interpretation, Visualisation and Social Computing of Volunteered Geographic Information (VGI) TU Dresden, 11.-15. September 2017 Welcome PhD students working on research topics
Urban Population Migration Pattern Mining Based on Taxi Trajectories
 Urban Population Migration Pattern Mining Based on Taxi Trajectories ABSTRACT Bing Zhu Tsinghua University Beijing, China zhub.daisy@gmail.com Leonidas Guibas Stanford University Stanford, CA, U.S.A. guibas@cs.stanford.edu
XXIII CONGRESS OF ISPRS RESOLUTIONS
 XXIII CONGRESS OF ISPRS RESOLUTIONS General Resolutions Resolution 0: Thanks to the Czech Society commends: To congratulate The Czech Society, its president and the Congress Director Lena Halounová, the
Spatial Big Data. Amol G. Deshmukh Geomatics Specialist
 6% Spatial Big Data Amol G. Deshmukh Geomatics Specialist % Everyone talks about it, nobody really knows how to use it, everyone thinks everyone else is using it, so everyone claims they are using it...
The spatial network Streets and public spaces are the where people move, interact and transact
 The spatial network Streets and public spaces are the where people move, interact and transact The spatial network Cities are big spatial networks that create more of these opportunities Five key discoveries
2016 APWA Snow Conference. Web-based GIS for Municipal Snow Operations
 2016 APWA Snow Conference Web-based GIS for Municipal Snow Operations Christopher M. Cignoli, P.E. - Director of Public Works, Springfield, MA Bob Houldson - Director IT Services for the Department of
The Changing Landscape of Land Administration
 The Changing Landscape of Land Administration B r e n t J o n e s P E, PLS E s r i World s Largest Media Company No Journalists No Content Producers No Photographers World s Largest Hospitality Company
GIS-BASED VISUALIZATION FOR ESTIMATING LEVEL OF SERVICE Gozde BAKIOGLU 1 and Asli DOGRU 2
 Presented at the FIG Congress 2018, May 6-11, 2018 in Istanbul, Turkey GIS-BASED VISUALIZATION FOR ESTIMATING LEVEL OF SERVICE Gozde BAKIOGLU 1 and Asli DOGRU 2 1 Department of Transportation Engineering,
MDSS and Advanced Forecasting STSMO Weather Workshop Dave Huft, SDDOT Research Program Manager September 12, 2017
 Connecting South Dakota and the Nation MDSS and Advanced Forecasting STSMO Weather Workshop Dave Huft, SDDOT Research Program Manager September 12, 2017 1 Weather Impacts & Strategies Winter perceived
Time Series Data Cleaning
 Time Series Data Cleaning Shaoxu Song http://ise.thss.tsinghua.edu.cn/sxsong/ Dirty Time Series Data Unreliable Readings Sensor monitoring GPS trajectory J. Freire, A. Bessa, F. Chirigati, H. T. Vo, K.
City monitoring with travel demand momentum vector fields: theoretical and empirical findings
 City monitoring with travel demand momentum vector fields: theoretical and empirical findings Xintao Liu 1, Joseph Y.J. Chow 2 1 Department of Civil Engineering, Ryerson University, Canada 2 Tandon School
Exploit your geodata to enable smart cities and countries
 Exploit your geodata to enable smart cities and countries Carsten Rönsdorf, Head of Advisory Services Middle East Practice Manager Future Cities, standards and 3D 24 November 2014 Importance of Standards
Space-adjusting Technologies and the Social Ecologies of Place
 Space-adjusting Technologies and the Social Ecologies of Place Donald G. Janelle University of California, Santa Barbara Reflections on Geographic Information Science Session in Honor of Michael Goodchild