Believe it Today or Tomorrow? Detecting Untrustworthy Information from Dynamic Multi-Source Data
|
|
|
- Paulina Hood
- 5 years ago
- Views:
Transcription


1 SDM 15 Vancouver, CAN Believe it Today or Tomorrow? Detecting Untrustworthy Information from Dynamic Multi-Source Data Houping Xiao 1, Yaliang Li 1, Jing Gao 1, Fei Wang 2, Liang Ge 3, Wei Fan 4, Long Vu 5, and Deepak Turaga 5 1 SUNY at Buffalo; 2 University of Connecticut; 3 Google; 4 Baidu Big Data lab; 5 IBM T.J. Watson 1
2 Outline Motivation Challenges Proposed Two-Step Framework Step-1: Joint Nonnegative Tensor Factorization Step-2: Inconsistency Score calculation Experiments Conclusions 2
3 Motivation Multiple Information Sources Example: Hotel ratings can be obtained from multiple websites, such as Priceline, Orbitz, and Tripadvisor Question? Which piece of information is trustworthy? Which object does receive reliable information? Our solution Calculate the degree of receiving inconsistent information across sources Lower degree of inconsistency more reliable 3


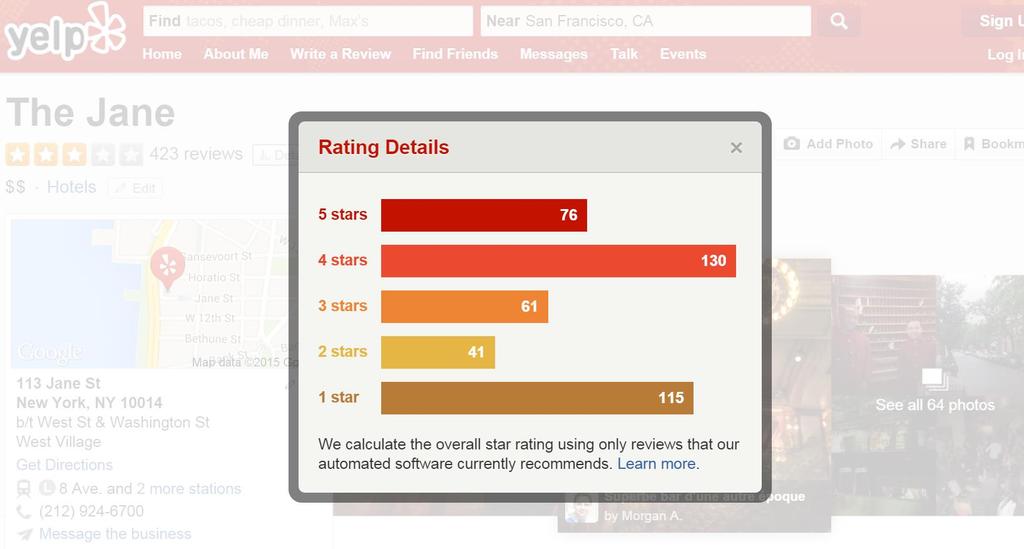
4 Motivating Example 4
5 How to Find Inconsistent Ratings Easy comparisons Aggregate the ratings of all the users into average ratings will lose information Users are not matched across different platforms, so we are unable to compare ratings of each user Our solution: Identify user groups and compare at the group level In each source, users can be partitioned into groups so that users in the same group share similar rating patterns over objects The underlying user groups and the ratings given by each group should be consistent across sources 5


6 Importance of Time Observations Multi-source data can continuously arrive with constantly changing distributions Motivating Example Sep-Nov Dec-Feb Mar-May Jun-Aug 6
7 Solutions Baselines Conduct separate modeling on each snapshot (Simple, but the temporal connection between timestamps is missing) Our Solution Consider the behavior at timestamp-cluster level (e.g. hotel ratings could change seasonally) In each source, timestamps can be clustered. Users behavior at the same timestamp cluster should be similar 7


8 Proposed Framework Core tensor User group assignment matrix Timestamps cluster Identity matrix assignment matrix hotel Tripadvisor user Orbitz user hotel Inconsistency vector Priceline Data Collection user hotel Step-1: Joint Nonnegative Tensor Factorization Step-2: Inconsistency score computation 8
9 Joint Nonnegative Tensor Factorization N s N 1 T T X 1 K X M K N 1 N U s,1 s U 1,2 C U 1,3 U 1,1 C G 1 K U 1 s,2 C C G s K U s,3 min G s, U s,i M 0 s=1 (L X s + αω(g s, G )) L X s = X s G s i U s,i 2 F, measures the factorization error of each tensor Ω(G s, G ) = G s G F 2, where G = 1 M s=1 M G s, is a regularization term proposed to learn the consensus information α, is regularization parameter 9
10 Inconsistency Score Computation Inconsistency Score I k = S k S median 2, where S k (s) = similarity (G s :, k, :, G (:, k, : )) S median = median {S k, k = 1,, K} k G 1 G s k k G M k G C D C D C D C D S k = (S k 1,, S k s,, S k (M)) 10
11 Streaming Data Observation: Multi-source data continuously arrives Solution: Step 1: obtain {U o s,t,i } at time T based on {G s,t 1 } M min {U (s,i,t) } s=1 X s,t G s,t 1 i U s,i,t F Step 2: use {U o s,t,i } to obtain {G s,t } at time T min G s,t M T s=1 t=1 X s,t G s,t i U o s,t,i F α G s,t G T 1 2 F 11
12 Observation: Many users may only give ratings for a few hotels at some specific timestamps Solution: K s = { i, j, k : X ijk set Objective function min G s, U s,i M 0 s=1 i,j,k K s Missing Data s s X ijk is available} is a triple-element G s i U s,i ijk 2 + α s Gijk 2 G ijk 12
13 Experiment Set-up Datasets: Synthetic datasets Real-world datasets Hotel Rating Network Traffic Flow Weather Forecast 13
14 Effectiveness Comparison F-Measure Comparison w.r.t. Outlier Percentage 2% 3% 5% 6% 8% 10% NHC JMF MSDBN JNNTF NHC [1] : Normalized Histogram Comparison JMF [1] : Joint Matrix Factorization MSDBN [2] : Multi-Source Deep Belief Network JNNTF: Joint Non-Negative Tensor Factorization 14
15 Hotel Rating Dataset The distribution of hotels inconsistency scores in Las Vages and New York City Inconsistency Score Inconsistency Score ID of Hotel in Las Vages ID of Hotel in New York City 15
16 Case Study Rating pattern of the top inconsistent and a consistent hotels in New York City Hotel with highest inconsistency score Rating Orbitz Priceline TripAdvisor Hotel with low inconsistency score 0.8 Rating Timestamp Cluster Orbitz Priceline TripAdvisor 16
17 Network Traffic Flow Dataset Inconsistency Score (a) : The distribution of hosts inconsistency scores (b) : Case Study: traffic flow pattern of hosts Host ID (a) Network Traffic Network Traffic Host with high inconsistency score Source 1 Source 2 Source Host with low inconsistency score Timestamp Cluster (b) 17 Source 1 Source 2 Source 3
18 Inconsistency Score Weather Forecast Dataset (a): The distribution of cities inconsistency scores (b): Case study: Highest temperature pattern of cities City ID (a) High Temperature High Temperature City with highest inconsistency score HAM Wund WWO HAM Wund WWO City with low inconsistency score Timestamp Cluster (b) 18
19 Incremental V.S. Offline (a): Efficiency Comparison (b): Average difference of inconsistency score Running Time (s) 12 x Offline Incremental Timestamp (a) Average difference of inconsistency score Timestamp (b) = 2 = 3 = 4 = 5 19
20 The Effect of Considering Missing Data Running time w.r.t. Percentage of Missing Value Percentage JNNTF-MD/s JNNTF/s ratio 10% % 30% % 50% % 70% % 90% % Percentage: the percentage of entries that are missing JNNTF: basic algorithm without considering missing values JNNTF-MD: the method considering missing values Ratio: RunningTime(JNNTF-MD) / RunningTime(JNNTF) 20
21 Conclusions Developed a multi-source joint tensor factorization framework to conduct untrustworthy information detection, which takes the importance of time dimension into consideration Proposed an incremental factorization to dynamically conduct joint tensor factorization for streaming data Proposed an approach to handle missing values by focusing only on available entries Results on synthetic and real-world datasets show the advantage of the proposed framework 21
22 Thank You! Questions? 22
23 Back-up
24 Tensor Factorization X s G s 1 U s,1 2 U s,2 3 U s,3 G s R C K D is the core tensor, which represents the latent behavior of each user group on each time cluster for each object U s,1 R Ns C denotes the partition of N s users into C groups, where U s,1 C ij 0 and U s,1 ij = 1 j=1 U s,2 R K K is an identity matrix, denoting the objects we are interested in U s,3 R Ts D denotes the partition of T s timestamps into D clusters, where U s,3 ij 0 and D U s,3 ij = 1 j=1
25 Reference for Baselines [1] Ge, Liang, et al. "Estimating local information trustworthiness via multi-source joint matrix factorization." Data Mining (ICDM), 2012 IEEE 12th International Conference on. IEEE, [2] Ge, Liang, et al. "Multi-source deep learning for information trustworthiness estimation." Proceedings of the 19th ACM SIGKDD international conference on Knowledge discovery and data mining. ACM, 2013.
26 Hotel Rating Dataset Data Collection: Ratings for 111 common hotels in Las Vegas and 210 common hotels for New York City from January to December 2013 from three popular travel websites: Orbitz, Priceline, and Tripadvisor. Goal: Detect hotels which receive inconsistent ratings from Orbitz, Priceline and Tripadvisor Input: First dimension: Users ID Second dimension: Hotel ID. For example, in Las Vegas, its dimensionality is 110 Third dimension: month ID. Totally, we have 12 months. We have three sources. Output: Inconsistency vector of 110 hotels in Las Vegas and 210 hotels in New York City.
27 Network Traffic Flow Dataset Data Collection: Network traffic flow dataset is collected from an enterprise network containing 500 hosts. Goal: Detect inconsistent hosts whose network traffic flow is inconsistent across months Input: First dimension: each weekday Second dimension: Host ID Third dimension: every hour in a day We treat each month s each as a source Output: Inconsistency score vector for 500 hosts
28 Weather Forecast Dataset Data Collection: Highest temperature of 88 cities in US are collected from three platforms: HAM weather (HAM), Wunderground (Wund), and World Weather Online (WWO), from Oct. 7, 2013 to Dec. 17, Goal: Detect cities which receive inconsistent predicted highest temperature from HAM, Wund, and WWO. Input: First dimension: Prediction timestamps ID Second dimension: city ID Third dimension: day ID from Oct. 7, 2013 to Dec. 17, 2013 Three sources: HAM, Wund, and WWO Output: Inconsistency score vector for 88 cities
Temporal Multi-View Inconsistency Detection for Network Traffic Analysis
 WWW 15 Florence, Italy Temporal Multi-View Inconsistency Detection for Network Traffic Analysis Houping Xiao 1, Jing Gao 1, Deepak Turaga 2, Long Vu 2, and Alain Biem 2 1 Department of Computer Science
UAPD: Predicting Urban Anomalies from Spatial-Temporal Data
 UAPD: Predicting Urban Anomalies from Spatial-Temporal Data Xian Wu, Yuxiao Dong, Chao Huang, Jian Xu, Dong Wang and Nitesh V. Chawla* Department of Computer Science and Engineering University of Notre
GAMINGRE 8/1/ of 7
 FYE 09/30/92 JULY 92 0.00 254,550.00 0.00 0 0 0 0 0 0 0 0 0 254,550.00 0.00 0.00 0.00 0.00 254,550.00 AUG 10,616,710.31 5,299.95 845,656.83 84,565.68 61,084.86 23,480.82 339,734.73 135,893.89 67,946.95
Estimating Local Information Trustworthiness via Multi-Source Joint Matrix Factorization
 Estimating Local Information Trustworthiness via Multi-Source Joint Matrix Factorization Liang Ge, Jing Gao, Xiao Yu, Wei Fan and Aidong Zhang The State University of New York at Buffalo University of
BUSI 460 Suggested Answers to Selected Review and Discussion Questions Lesson 7
 BUSI 460 Suggested Answers to Selected Review and Discussion Questions Lesson 7 1. The definitions follow: (a) Time series: Time series data, also known as a data series, consists of observations on a
How are adding integers and subtracting integers related? Work with a partner. Use integer counters to find 4 2. Remove 2 positive counters.
 . How are adding integers and subtracting integers related? ACTIVITY: Work with a partner. Use integer counters to find 4. Start with 4 positive counters. Remove positive counters. What is the total number
Multi-Plant Photovoltaic Energy Forecasting Challenge with Regression Tree Ensembles and Hourly Average Forecasts
 Multi-Plant Photovoltaic Energy Forecasting Challenge with Regression Tree Ensembles and Hourly Average Forecasts Kathrin Bujna 1 and Martin Wistuba 2 1 Paderborn University 2 IBM Research Ireland Abstract.
Discovering Truths from Distributed Data
 217 IEEE International Conference on Data Mining Discovering Truths from Distributed Data Yaqing Wang, Fenglong Ma, Lu Su, and Jing Gao SUNY Buffalo, Buffalo, USA {yaqingwa, fenglong, lusu, jing}@buffalo.edu
Climatography of the United States No
 Climate Division: AK 5 NWS Call Sign: ANC Month (1) Min (2) Month(1) Extremes Lowest (2) Temperature ( F) Lowest Month(1) Degree s (1) Base Temp 65 Heating Cooling 90 Number of s (3) Jan 22.2 9.3 15.8
Forecasting the electricity consumption by aggregating specialized experts
 Forecasting the electricity consumption by aggregating specialized experts Pierre Gaillard (EDF R&D, ENS Paris) with Yannig Goude (EDF R&D) Gilles Stoltz (CNRS, ENS Paris, HEC Paris) June 2013 WIPFOR Goal
Real-time Sentiment-Based Anomaly Detection in Twitter Data Streams
 Real-time Sentiment-Based Anomaly Detection in Twitter Data Streams Khantil Patel, Orland Hoeber, and Howard J. Hamilton Department of Computer Science University of Regina, Canada patel26k@uregina.ca,
Online Truth Discovery on Time Series Data
 Online Truth Discovery on Time Series Data Liuyi Yao Lu Su Qi Li Yaliang Li Fenglong Ma Jing Gao Aidong Zhang Abstract Truth discovery, with the goal of inferring true information from massive data through
FEB DASHBOARD FEB JAN FEB MAR APR MAY JUN JUL AUG SEP OCT NOV DEC
 Positive Response Compliance 215 Compliant 215 Non-Compliant 216 Compliant 216 Non-Compliant 1% 87% 96% 86% 96% 88% 89% 89% 88% 86% 92% 93% 94% 96% 94% 8% 6% 4% 2% 13% 4% 14% 4% 12% 11% 11% 12% JAN MAR
Detecting Origin-Destination Mobility Flows From Geotagged Tweets in Greater Los Angeles Area
 Detecting Origin-Destination Mobility Flows From Geotagged Tweets in Greater Los Angeles Area Song Gao 1, Jiue-An Yang 1,2, Bo Yan 1, Yingjie Hu 1, Krzysztof Janowicz 1, Grant McKenzie 1 1 STKO Lab, Department
Mountain View Community Shuttle Monthly Operations Report
 Mountain View Community Shuttle Monthly Operations Report December 6, 2018 Contents Passengers per Day, Table...- 3 - Passengers per Day, Chart...- 3 - Ridership Year-To-Date...- 4 - Average Daily Ridership
WHEN IS IT EVER GOING TO RAIN? Table of Average Annual Rainfall and Rainfall For Selected Arizona Cities
 WHEN IS IT EVER GOING TO RAIN? Table of Average Annual Rainfall and 2001-2002 Rainfall For Selected Arizona Cities Phoenix Tucson Flagstaff Avg. 2001-2002 Avg. 2001-2002 Avg. 2001-2002 October 0.7 0.0
Lesson Adaptation Activity: Analyzing and Interpreting Data
 Lesson Adaptation Activity: Analyzing and Interpreting Data Related MA STE Framework Standard: 3-ESS2-1. Use graphs and tables of local weather data to describe and predict typical weather during a particular
Chiang Rai Province CC Threat overview AAS1109 Mekong ARCC
 Chiang Rai Province CC Threat overview AAS1109 Mekong ARCC This threat overview relies on projections of future climate change in the Mekong Basin for the period 2045-2069 compared to a baseline of 1980-2005.
Time Series Analysis
 Time Series Analysis A time series is a sequence of observations made: 1) over a continuous time interval, 2) of successive measurements across that interval, 3) using equal spacing between consecutive
Climatography of the United States No
 No. 2 1971-2 Asheville, North Carolina 2881 COOP ID: 46646 Climate Division: CA 4 NWS Call Sign: 8W Month (1) Min (2) Month(1) Extremes Lowest (2) Temperature ( F) Lowest Month(1) Degree s (1) Base Temp
Climatography of the United States No
 No. 2 1971-2 Asheville, North Carolina 2881 COOP ID: 4792 Climate Division: CA 6 NWS Call Sign: Month (1) Min (2) Month(1) Extremes Lowest (2) Temperature ( F) Lowest Month(1) Degree s (1) Base Temp 65
Lecture Prepared By: Mohammad Kamrul Arefin Lecturer, School of Business, North South University
 Lecture 15 20 Prepared By: Mohammad Kamrul Arefin Lecturer, School of Business, North South University Modeling for Time Series Forecasting Forecasting is a necessary input to planning, whether in business,
GTR # VLTs GTR/VLT/Day %Δ:
 MARYLAND CASINOS: MONTHLY REVENUES TOTAL REVENUE, GROSS TERMINAL REVENUE, WIN/UNIT/DAY, TABLE DATA, AND MARKET SHARE CENTER FOR GAMING RESEARCH, DECEMBER 2017 Executive Summary Since its 2010 casino debut,
Climatography of the United States No
 No. 2 1971-2 Asheville, North Carolina 2881 COOP ID: 43417 Climate Division: CA 4 NWS Call Sign: N Lon: 121 Month (1) Min (2) Month(1) Extremes Lowest (2) Temperature ( F) Lowest Month(1) Degree s (1)
Climatography of the United States No
 No. 2 1971-2 Asheville, North Carolina 2881 COOP ID: 4795 Climate Division: CA 6 NWS Call Sign: SBA Month (1) Min (2) Month(1) Extremes Lowest (2) Temperature ( F) Lowest Month(1) Degree s (1) Base Temp
Specialist rainfall scenarios and software package
 Building Knowledge for a Changing Climate Specialist rainfall scenarios and software package Chris Kilsby Ahmad Moaven-Hashemi Hayley Fowler Andrew Smith Aidan Burton Michael Murray University of Newcastle
Appendix BAL Baltimore, Maryland 2003 Annual Report on Freeway Mobility and Reliability
 (http://mobility.tamu.edu/mmp) Office of Operations, Federal Highway Administration Appendix BAL Baltimore, Maryland 2003 Annual Report on Freeway Mobility and Reliability This report is a supplement to:
Chapter 3. Regression-Based Models for Developing Commercial Demand Characteristics Investigation
 Chapter Regression-Based Models for Developing Commercial Demand Characteristics Investigation. Introduction Commercial area is another important area in terms of consume high electric energy in Japan.
Clustering Lecture 1: Basics. Jing Gao SUNY Buffalo
 Clustering Lecture 1: Basics Jing Gao SUNY Buffalo 1 Outline Basics Motivation, definition, evaluation Methods Partitional Hierarchical Density-based Mixture model Spectral methods Advanced topics Clustering
Identification of Bursts in a Document Stream
 Identification of Bursts in a Document Stream Toshiaki FUJIKI 1, Tomoyuki NANNO 1, Yasuhiro SUZUKI 1 and Manabu OKUMURA 2 1 Interdisciplinary Graduate School of Science and Engineering, Tokyo Institute
SYSTEM BRIEF DAILY SUMMARY
 SYSTEM BRIEF DAILY SUMMARY * ANNUAL MaxTemp NEL (MWH) Hr Ending Hr Ending LOAD (PEAK HOURS 7:00 AM TO 10:00 PM MON-SAT) ENERGY (MWH) INCREMENTAL COST DAY DATE Civic TOTAL MAXIMUM @Max MINIMUM @Min FACTOR
Climatography of the United States No
 No. 2 1971-2 Asheville, North Carolina 2881 COOP ID: 46175 Climate Division: CA 6 NWS Call Sign: 3L3 Elevation: 1 Feet Lat: 33 Month (1) Min (2) Month(1) Extremes Lowest (2) Temperature ( F) Lowest Month(1)
Climatography of the United States No
 No. 2 1971-2 Asheville, North Carolina 2881 COOP ID: 42713 Climate Division: CA 7 NWS Call Sign: Elevation: -3 Feet Lat: 32 Month (1) Min (2) Month(1) Extremes Lowest (2) Temperature ( F) Lowest Month(1)
Jayalath Ekanayake Jonas Tappolet Harald Gall Abraham Bernstein. Time variance and defect prediction in software projects: additional figures
 Jayalath Ekanayake Jonas Tappolet Harald Gall Abraham Bernstein TECHNICAL REPORT No. IFI-2.4 Time variance and defect prediction in software projects: additional figures 2 University of Zurich Department
Climatography of the United States No
 Month (1) Min (2) Month(1) Extremes Lowest (2) Temperature ( F) Lowest Month(1) Degree s (1) Base Temp 65 Heating Cooling 100 Number of s (3) 42.6 24.2 33.4 79 1950 25 44.2 1974-16 1994 19 18.8 1977 977
Dates and Prices ICAEW - Manchester In Centre Programme Prices
 Dates and Prices ICAEW - Manchester - 2019 In Centre Programme Prices Certificate Level GBP ( ) Intensive Accounting 690 Assurance 615 Law 615 Business, Technology and Finance 615 Mangement Information
Climatography of the United States No
 Month (1) Min (2) Month(1) Extremes Lowest (2) Temperature ( F) Lowest Month(1) Degree s (1) Base Temp 65 Heating Cooling 100 Number of s (3) Jan 63.9 39.3 51.6 86 1976 16 56.6 1986 20 1976 2 47.5 1973
RaRE: Social Rank Regulated Large-scale Network Embedding
 RaRE: Social Rank Regulated Large-scale Network Embedding Authors: Yupeng Gu 1, Yizhou Sun 1, Yanen Li 2, Yang Yang 3 04/26/2018 The Web Conference, 2018 1 University of California, Los Angeles 2 Snapchat
Climatography of the United States No
 Temperature ( F) Month (1) Min (2) Month(1) Extremes Lowest (2) Lowest Month(1) Degree s (1) Base Temp 65 Heating Cooling 100 Number of s (3) Jan 32.8 21.7 27.3 62 1918 1 35.8 1983-24 1950 29 10.5 1979
LAB 3: THE SUN AND CLIMATE NAME: LAB PARTNER(S):
:") GEOG 101L PHYSICAL GEOGRAPHY LAB SAN DIEGO CITY COLLEGE SELKIN 1 LAB 3: THE SUN AND CLIMATE NAME: LAB PARTNER(S): The main objective of today s lab is for you to be able to visualize the sun s position
GEOG 101L PHYSICAL GEOGRAPHY LAB SAN DIEGO CITY COLLEGE SELKIN 1 LAB 3: THE SUN AND CLIMATE NAME: LAB PARTNER(S): The main objective of today s lab is for you to be able to visualize the sun s position
TILT, DAYLIGHT AND SEASONS WORKSHEET
 TILT, DAYLIGHT AND SEASONS WORKSHEET Activity Description: Students will use a data table to make a graph for the length of day and average high temperature in Utah. They will then answer questions based
YACT (Yet Another Climate Tool)? The SPI Explorer
? The SPI Explorer") YACT (Yet Another Climate Tool)? The SPI Explorer Mike Crimmins Assoc. Professor/Extension Specialist Dept. of Soil, Water, & Environmental Science The University of Arizona Yes, another climate tool for
YACT (Yet Another Climate Tool)? The SPI Explorer Mike Crimmins Assoc. Professor/Extension Specialist Dept. of Soil, Water, & Environmental Science The University of Arizona Yes, another climate tool for
Climatography of the United States No
 Climate Division: CA 7 NWS Call Sign: Month (1) Min (2) Month(1) Extremes Lowest (2) Temperature ( F) Lowest Month(1) Degree s (1) Base Temp 65 Heating Cooling 100 Number of s (3) Jan 54.4 36.9 45.7 77+
Climatography of the United States No
 Climate Division: CA 7 NWS Call Sign: Month (1) Min (2) Month(1) Extremes Lowest (2) Temperature ( F) Lowest Month(1) Degree s (1) Base Temp 65 Heating Cooling 100 Number of s (3) 44.5 29.3 36.9 69 1951
Climatography of the United States No
 Climate Division: CA 2 NWS Call Sign: Month (1) Min (2) Month(1) Extremes Lowest (2) Temperature ( F) Lowest Month(1) Degree s (1) Base Temp 65 Heating Cooling 100 Number of s (3) 53.3 31.8 42.6 74+ 1975
Climatography of the United States No
 Climate Division: CA 7 NWS Call Sign: Month (1) Min (2) Month(1) Extremes Lowest (2) Temperature ( F) Lowest Month(1) Degree s (1) Base Temp 65 Heating Cooling 100 Number of s (3) 56.0 35.7 45.9 83 1975
Climatography of the United States No
 Climate Division: CA 2 NWS Call Sign: Month (1) Min (2) Month(1) Extremes Lowest (2) Temperature ( F) Lowest Month(1) Degree s (1) Base Temp 65 Heating Cooling 100 Number of s (3) 53.7 32.7 43.2 79 1962
Climatography of the United States No
 Climate Division: CA 5 NWS Call Sign: Month (1) Min (2) Month(1) Extremes Lowest (2) Temperature ( F) Lowest Month(1) Degree s (1) Base Temp 65 Heating Cooling 100 Number of s (3) 59.3 31.5 45.4 80 1976
Climatography of the United States No
 Climate Division: CA 2 NWS Call Sign: Month (1) Min (2) Month(1) Extremes Lowest (2) Temperature ( F) Lowest Month(1) Degree s (1) Base Temp 65 Heating Cooling 100 Number of s (3) 53.3 37.1 45.2 77 1962
Exploring the Patterns of Human Mobility Using Heterogeneous Traffic Trajectory Data
 Exploring the Patterns of Human Mobility Using Heterogeneous Traffic Trajectory Data Jinzhong Wang April 13, 2016 The UBD Group Mobile and Social Computing Laboratory School of Software, Dalian University
Climatography of the United States No
 Climate Division: CA 7 NWS Call Sign: Month (1) Min (2) Month(1) Extremes Lowest (2) Temperature ( F) Lowest Month(1) Degree s (1) Base Temp 65 Heating Cooling 100 Number of s (3) 70.4 44.2 57.3 95 1971
Climatography of the United States No
 Climate Division: CA 7 NWS Call Sign: Month (1) Min (2) Month(1) Extremes Lowest (2) Temperature ( F) Lowest Month(1) Degree s (1) Base Temp 65 Heating Cooling 1 Number of s (3) 64.8 45.4 55.1 85 1971
Climatography of the United States No
 Climate Division: CA 6 NWS Call Sign: Month (1) Min (2) Month(1) Extremes Lowest (2) Temperature ( F) Lowest Month(1) Degree s (1) Base Temp 65 Heating Cooling 100 Number of s (3) 68.5 45.7 57.1 90 1971
Climatography of the United States No
 Climate Division: CA 7 NWS Call Sign: Month (1) Min (2) Month(1) Extremes Lowest (2) Temperature ( F) Lowest Month(1) Degree s (1) Base Temp 65 Heating Cooling 100 Number of s (3) 58.8 34.3 46.6 81+ 1948
Climatography of the United States No
 Climate Division: CA 7 NWS Call Sign: Month (1) Min (2) Month(1) Extremes Lowest (2) Temperature ( F) Lowest Month(1) Degree s (1) Base Temp 65 Heating Cooling 1 Number of s (3) 65.5 38.7 52.1 87 1962
Forecasting using R. Rob J Hyndman. 1.3 Seasonality and trends. Forecasting using R 1
 Forecasting using R Rob J Hyndman 1.3 Seasonality and trends Forecasting using R 1 Outline 1 Time series components 2 STL decomposition 3 Forecasting and decomposition 4 Lab session 5 Forecasting using
DROUGHT INDICES BEING USED FOR THE GREATER HORN OF AFRICA (GHA)
") DROUGHT INDICES BEING USED FOR THE GREATER HORN OF AFRICA (GHA) Christopher Oludhe IGAD Climate Prediction and Applications Centre (ICPAC) Inter-Regional Workshop on Indices and Early Warning Systems for
DROUGHT INDICES BEING USED FOR THE GREATER HORN OF AFRICA (GHA) Christopher Oludhe IGAD Climate Prediction and Applications Centre (ICPAC) Inter-Regional Workshop on Indices and Early Warning Systems for
SYSTEM BRIEF DAILY SUMMARY
 SYSTEM BRIEF DAILY SUMMARY * ANNUAL MaxTemp NEL (MWH) Hr Ending Hr Ending LOAD (PEAK HOURS 7:00 AM TO 10:00 PM MON-SAT) ENERGY (MWH) INCREMENTAL COST DAY DATE Civic TOTAL MAXIMUM @Max MINIMUM @Min FACTOR
A Randomized Approach for Crowdsourcing in the Presence of Multiple Views
 A Randomized Approach for Crowdsourcing in the Presence of Multiple Views Presenter: Yao Zhou joint work with: Jingrui He - 1 - Roadmap Motivation Proposed framework: M2VW Experimental results Conclusion
Climatography of the United States No
 Climate Division: CA 4 NWS Call Sign: Month (1) Min (2) Month(1) Extremes Lowest (2) Temperature ( F) Lowest Month(1) Degree s (1) Base Temp 65 Heating Cooling 1 Number of s (3) Jan 58.5 38.8 48.7 79 1962
Climatography of the United States No
 Climate Division: CA 4 NWS Call Sign: Month (1) Min (2) Month(1) Extremes Lowest (2) Temperature ( F) Lowest Month(1) Degree s (1) Base Temp 65 Heating Cooling 100 Number of s (3) Jan 49.4 37.5 43.5 73
Climatography of the United States No
 Climate Division: CA 6 NWS Call Sign: Month (1) Min (2) Month(1) Extremes Lowest (2) Temperature ( F) Lowest Month(1) Degree s (1) Base Temp 65 Heating Cooling 1 Number of s (3) Jan 67.5 42. 54.8 92 1971
Climatography of the United States No
 Climate Division: CA 5 NWS Call Sign: Month (1) Min (2) Month(1) Extremes Lowest (2) Temperature ( F) Lowest Month(1) Degree s (1) Base Temp 65 Heating Cooling 100 Number of s (3) Jan 44.8 25.4 35.1 72
Climatography of the United States No
 Climate Division: CA 1 NWS Call Sign: Month (1) Min (2) Month(1) Extremes Lowest (2) Temperature ( F) Lowest Month(1) Degree s (1) Base Temp 65 Heating Cooling 1 Number of s (3) Jan 57.8 39.5 48.7 85 1962
Climatography of the United States No
 Climate Division: CA 1 NWS Call Sign: Month (1) Min (2) Month(1) Extremes Lowest (2) Temperature ( F) Lowest Month(1) Degree s (1) Base Temp 65 Heating Cooling 100 Number of s (3) Jan 57.9 38.9 48.4 85
Climatography of the United States No
 Climate Division: CA 6 NWS Call Sign: Month (1) Min (2) Month(1) Extremes Lowest (2) Temperature ( F) Lowest Month(1) Degree s (1) Base Temp 65 Heating Cooling 100 Number of s (3) Jan 69.4 46.6 58.0 92
Climatography of the United States No
 Climate Division: CA 5 NWS Call Sign: Month (1) Min (2) Month(1) Extremes Lowest (2) Temperature ( F) Lowest Month(1) Degree s (1) Base Temp 65 Heating Cooling 100 Number of s (3) Jan 56.6 36.5 46.6 81
Climatography of the United States No
 Climate Division: CA 4 NWS Call Sign: Month (1) Min (2) Month(1) Extremes Lowest (2) Temperature ( F) Lowest Month(1) Degree s (1) Base Temp 65 Heating Cooling 100 Number of s (3) Jan 55.6 39.3 47.5 77
Time Series Data Cleaning
 Time Series Data Cleaning Shaoxu Song http://ise.thss.tsinghua.edu.cn/sxsong/ Dirty Time Series Data Unreliable Readings Sensor monitoring GPS trajectory J. Freire, A. Bessa, F. Chirigati, H. T. Vo, K.
NASA Products to Enhance Energy Utility Load Forecasting
 NASA Products to Enhance Energy Utility Load Forecasting Erica Zell, Battelle zelle@battelle.org, Arlington, VA ESIP 2010 Summer Meeting, Knoxville, TN, July 20-23 Project Overview Funded by the NASA Applied
Computing & Telecommunications Services Monthly Report January CaTS Help Desk. Wright State University (937)
") January 215 Monthly Report Computing & Telecommunications Services Monthly Report January 215 CaTS Help Desk (937) 775-4827 1-888-775-4827 25 Library Annex helpdesk@wright.edu www.wright.edu/cats/ Last
January 215 Monthly Report Computing & Telecommunications Services Monthly Report January 215 CaTS Help Desk (937) 775-4827 1-888-775-4827 25 Library Annex helpdesk@wright.edu www.wright.edu/cats/ Last
Climatography of the United States No
 Climate Division: ND 8 NWS Call Sign: BIS Month (1) Min (2) Month(1) Extremes Lowest (2) Temperature ( F) Lowest Month(1) Degree s (1) Base Temp 65 Heating Cooling 100 Number of s (3) Jan 21.1 -.6 10.2
Climatography of the United States No
 Climate Division: TN 1 NWS Call Sign: Month (1) Min (2) Month(1) Extremes Lowest (2) Temperature ( F) Lowest Month(1) Degree s (1) Base Temp 65 Heating Cooling 100 Number of s (3) Jan 47.6 24.9 36.3 81
Climatography of the United States No
 Climate Division: CA 5 NWS Call Sign: FAT Month (1) Min (2) Month(1) Extremes Lowest (2) Temperature ( F) Lowest Month(1) Degree s (1) Base Temp 65 Heating Cooling 1 Number of s (3) Jan 53.6 38.4 46. 78
Recovery Analysis Methods and Data Requirements Study
 Elevation Recovery Analysis Methods and Data Requirements Study Update to NTB Phase II Local Technical Peer Review Group December 3, 2003 Time 1 Schedule for Pumpage Reductions 180 160 140 120 158 121
Anomaly Detection for the CERN Large Hadron Collider injection magnets
 Anomaly Detection for the CERN Large Hadron Collider injection magnets Armin Halilovic KU Leuven - Department of Computer Science In cooperation with CERN 2018-07-27 0 Outline 1 Context 2 Data 3 Preprocessing
Climatography of the United States No
 Climate Division: CA 6 NWS Call Sign: 1L2 N Lon: 118 3W Month (1) Min (2) Month(1) Extremes Lowest (2) Temperature ( F) Lowest Month(1) Degree s (1) Base Temp 65 Heating Cooling 1 Number of s (3) Jan 63.7
Analysis Based on SVM for Untrusted Mobile Crowd Sensing
 Analysis Based on SVM for Untrusted Mobile Crowd Sensing * Ms. Yuga. R. Belkhode, Dr. S. W. Mohod *Student, Professor Computer Science and Engineering, Bapurao Deshmukh College of Engineering, India. *Email
Climatography of the United States No
 Climate Division: CA 5 NWS Call Sign: BFL Month (1) Min (2) Month(1) Extremes Lowest (2) Temperature ( F) Lowest Month(1) Degree s (1) Base Temp 65 Heating Cooling 1 Number of s (3) Jan 56.3 39.3 47.8
Advanced Techniques for Mining Structured Data: Process Mining
 Advanced Techniques for Mining Structured Data: Process Mining Frequent Pattern Discovery /Event Forecasting Dr A. Appice Scuola di Dottorato in Informatica e Matematica XXXII Problem definition 1. Given
Grade 6 Standard 2 Unit Test Astronomy
 Grade 6 Standard 2 Unit Test Astronomy Multiple Choice 1. Why does the air temperature rise in the summer? A. We are closer to the sun. B. The air becomes thicker and more dense. C. The sun s rays are
REGIONAL TRAINING COURSE ON METHODS AND TOOLS TO IDENTIFY SOURCES OF AIR POLLUTION
 REGIONAL TRAINING COURSE ON METHODS AND TOOLS TO IDENTIFY SOURCES OF AIR POLLUTION IAEA RER 1013: Supporting Air Quality Management Source apportionment by Positive Matrix Factorization Marta Almeida Email:
Climatography of the United States No
 Climate Division: TN 3 NWS Call Sign: BNA Month (1) Min (2) Month(1) Extremes Lowest (2) Temperature ( F) Lowest Month(1) Degree s (1) Base Temp 65 Heating Cooling 100 Number of s (3) Jan 45.6 27.9 36.8
Introduction to Course
 .. Introduction to Course Oran Kittithreerapronchai 1 1 Department of Industrial Engineering, Chulalongkorn University Bangkok 10330 THAILAND last updated: September 17, 2016 COMP METH v2.00: intro 1/
Determine the trend for time series data
 Extra Online Questions Determine the trend for time series data Covers AS 90641 (Statistics and Modelling 3.1) Scholarship Statistics and Modelling Chapter 1 Essent ial exam notes Time series 1. The value
Climatography of the United States No
 Climate Division: CA 4 NWS Call Sign: Elevation: 2 Feet Lat: 37 Month (1) Min (2) Month(1) Extremes Lowest (2) Temperature ( F) Lowest Month(1) Degree s (1) Base Temp 65 Heating Cooling 1 Number of s (3)
Climatography of the United States No
 Climate Division: CA 5 NWS Call Sign: Elevation: 6 Feet Lat: 37 Month (1) Min (2) Month(1) Extremes Lowest (2) Temperature ( F) Lowest Month(1) Degree s (1) Base Temp 65 Heating Cooling 1 Number of s (3)
Climatography of the United States No
 Climate Division: CA 5 NWS Call Sign: Elevation: 1,14 Feet Lat: 36 Month (1) Min (2) Month(1) Extremes Lowest (2) Temperature ( F) Lowest Month(1) Degree s (1) Base Temp 65 Heating Cooling 1 Number of
Climatography of the United States No
 Climate Division: CA 4 NWS Call Sign: Elevation: 13 Feet Lat: 36 Month (1) Min (2) Month(1) Extremes Lowest (2) Temperature ( F) Lowest Month(1) Degree s (1) Base Temp 65 Heating Cooling 1 Number of s
Salem Economic Outlook
 Salem Economic Outlook November 2012 Tim Duy, PHD Prepared for the Salem City Council November 7, 2012 Roadmap US Economic Update Slow and steady Positives: Housing/monetary policy Negatives: Rest of world/fiscal
Climatography of the United States No
 Climate Division: CA 6 NWS Call Sign: LAX Elevation: 1 Feet Lat: 33 Month (1) Min (2) Month(1) Extremes Lowest (2) Temperature ( F) Lowest Month(1) Degree s (1) Base Temp 65 Heating Cooling 1 Number of
Climatography of the United States No
 Climate Division: CA 6 NWS Call Sign: TOA Elevation: 11 Feet Lat: 33 2W Temperature ( F) Month (1) Min (2) Month(1) Extremes Lowest (2) Lowest Month(1) Degree s (1) Base Temp 65 Heating Cooling 1 Number
Supplementary appendix
 Supplementary appendix This appendix formed part of the original submission and has been peer reviewed. We post it as supplied by the authors. Supplement to: Lowe R, Stewart-Ibarra AM, Petrova D, et al.
Where to Find My Next Passenger?
 Where to Find My Next Passenger? Jing Yuan 1 Yu Zheng 2 Liuhang Zhang 1 Guangzhong Sun 1 1 University of Science and Technology of China 2 Microsoft Research Asia September 19, 2011 Jing Yuan et al. (USTC,MSRA)
Improve Forecasts: Use Defect Signals
 Improve Forecasts: Use Defect Signals Paul Below paul.below@qsm.com Quantitative Software Management, Inc. Introduction Large development and integration project testing phases can extend over many months
What is the difference between Weather and Climate?
 What is the difference between Weather and Climate? Objective Many people are confused about the difference between weather and climate. This makes understanding the difference between weather forecasts
DAILY QUESTIONS 28 TH JUNE 18 REASONING - CALENDAR
 DAILY QUESTIONS 28 TH JUNE 18 REASONING - CALENDAR LEAP AND NON-LEAP YEAR *A non-leap year has 365 days whereas a leap year has 366 days. (as February has 29 days). *Every year which is divisible by 4
Sparse Gaussian Markov Random Field Mixtures for Anomaly Detection
 Sparse Gaussian Markov Random Field Mixtures for Anomaly Detection Tsuyoshi Idé ( Ide-san ), Ankush Khandelwal*, Jayant Kalagnanam IBM Research, T. J. Watson Research Center (*Currently with University
ALASKA REGION CLIMATE OUTLOOK BRIEFING. December 22, 2017 Rick Thoman National Weather Service Alaska Region
 ALASKA REGION CLIMATE OUTLOOK BRIEFING December 22, 2017 Rick Thoman National Weather Service Alaska Region Today s Outline Feature of the month: Autumn sea ice near Alaska Climate Forecast Basics Climate
Seasonal Hydrometeorological Ensemble Prediction System: Forecast of Irrigation Potentials in Denmark
 Seasonal Hydrometeorological Ensemble Prediction System: Forecast of Irrigation Potentials in Denmark Diana Lucatero 1*, Henrik Madsen 2, Karsten H. Jensen 1, Jens C. Refsgaard 3, Jacob Kidmose 3 1 University