Classification in Mobility Data Mining
|
|
|
- Melvin Adams
- 5 years ago
- Views:
Transcription
1 Classification in Mobility Data Mining
2 Activity Recognition Semantic Enrichment
3 Recognition through Points-of-Interest Given a dataset of GPS tracks of private vehicles, we annotate trajectories with the most probable activities performed by the user. Hospital Services Gym Leisure? Restaurant Food The method associates the list of possible POIs (with corresponding probabilities) visited by a user moving by car when he stops. A mapping between POIs categories and Transportation Engineering activities is necessary.

4 The enrichment process POI collection: Collected in an automatic way, e.g. from Google Places. Association POI Activity: Each POI is associated to a ``activity". For example Restaurant Eating/Food, Library Education, etc. Basic elements/characteristics: C(POI) = {category, opening hour, location} C(Trajectory) = {duration of the stop, stop location, time of the day} C(User) = {max walking distance} Computation of the probability to visit a POI/ to make an activity: For each POI, the probability of ``being visited'' is a function of the POI, the trajectory and the user features. Annotated trajectory: The list of possible activities is then associated to a Stop based on the corresponding probability of visiting POIs
5 Input & Output Wd = 500 m Bank: Mon Fri [8:00 15:30] Lat; Lon TimeStamp: Sun 10:55 12:05 Dentist: Mon Sat [9:00 13:00] [15:30 18:00] Church: Mon Sat [18:00 19:00] Sun [11:00 12:00] Primary School: Mon Sat [8:00 13:00]
6 Input & Output Pastry Food [100%] Church Services [80%] Bar Food [20%] - Stop: Lat; Lon - TimeStamp: Sun 10:55 12:05 Wd = 500 m
7 Inferring Activities from social data


; 24,935 personal")
8 Extraction of personal places from Twitter trajectories in Dublin area The points of each trajectory taken separately were grouped into spatial clusters of maximal radius 150m. For groups with at least 5 points, convex hulls have been built and spatial buffers of small width (5m) around them. 1,461,582 points belong to the clusters (89% of 1,637,346); 24,935 personal places have been extracted. Statistical distribution of the number of places per person Examples of extracted places
.")

9 Recognition of the message topics, generation of topical feature vectors, and summarization by the personal places Topics have been assigned to 208,391 messages (14.3% of the 1,461,582 points belonging to the personal places)... 1) 2) 3) Some places did not get topic summaries (about 20% of the places) In many places the topics are very much mixed The topics are not necessarily representative of the place type (e.g., topics near a supermarket: family, education, work, cafe, shopping, services, health care, friends, game, private event, food, sweets, coffee)

 distance function. Resulting scores: from 0 (no similarity) to 1 (very high similarity). 15,950 places (64% of all) have no similarity to any of the exemplary time patterns.")
10 Obtaining daily time series of place visits and comparison with exemplary temporal profiles The daily time series of place visits have been obtained through aggregation of daily trajectories using only relevant places for each trajectory. The aggregation was done separately for the work days from Monday to Thursday, and for Saturday, Sunday, and Friday. Exemplary temporal profiles of different activities or visits to different types of places The time series of place visits are compared to the exemplary time profiles by means of the Dynamic Time Warping (DTW) distance function. Resulting scores: from 0 (no similarity) to 1 (very high similarity). 15,950 places (64% of all) have no similarity to any of the exemplary time patterns. 4,732 places (19%) have the maximal similarity score of 0.8 or higher; 4,179 of them (16.8% of all) were visited in 6 or more days.
 The time series similarity scores have been combined with the relative frequencies of the topics using")

11 Time series with high similarity to work (>=0.8) The time series similarity scores have been combined with the relative frequencies of the topics using a combination matrix 1,520 places (6.1% of all). These places have also high similarity to education, transport, and lunch. In 233 places out of the initial 1,520 (15%, 0.9% of all places) the similarity to the work profile has been reinforced based on the topic frequencies.
 are not classified; 4,688 (18.8%) are classified, of them 4,048 (16.")
12 Classification of the places according to the highest combined score (minimum 0.8) 20,247 places (81.2%) are not classified; 4,688 (18.8%) are classified, of them 4,048 (16.2%) were visited in at least 6 days
13 Activity Recognition Inductive approach
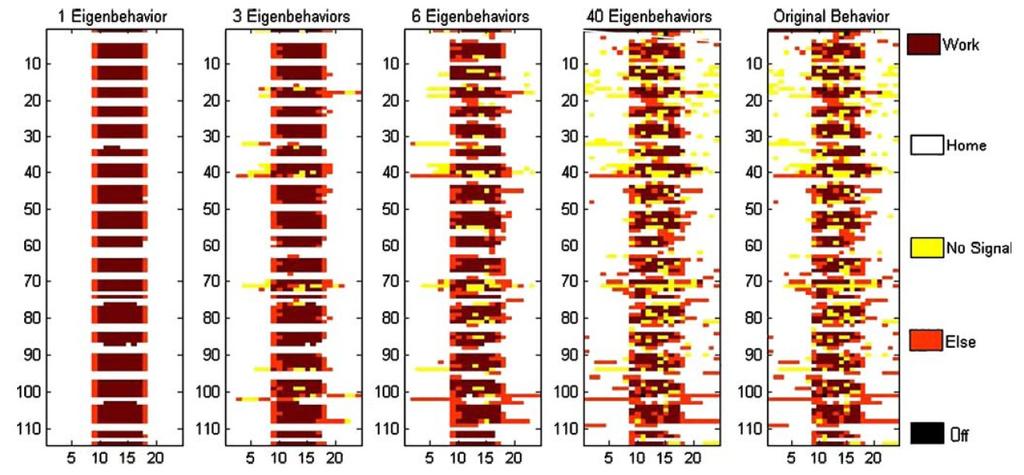
14 Eigen-behaviours Input Left: subject s behavior over the course of 113 days for five situations / activities Right: same data represented as a binary matrix of 113 days (D) by 120 (H, which is 24 multiplied by the five possible situations)

15 Eigen-behaviours Method Are there key activity distributions from which to infer all others through linear combination? Same idea as PCA Key distributions

16 Eigen-behaviours Output Set of 3 representative eigen-behaviours Each user's activity can be rewritten as their linear combination activities
17 Eigen-behaviours Example
18 Individual Mobility Networks
19 How to synthesize Individual Mobility? Mobility Data Mining methods automatically extract relevant episodes: locations and movements.
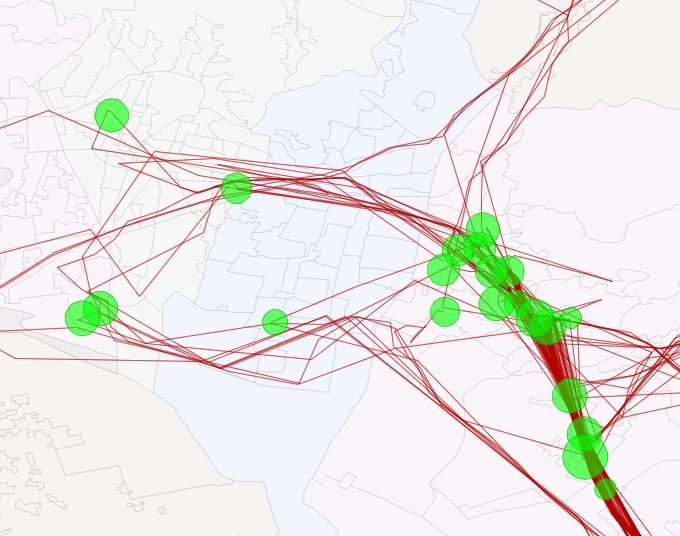
20 Rank individual preferred locations
 and")
21 How to synthesize Individual Mobility? Graph abstraction based on locations (nodes) and movements (edges)
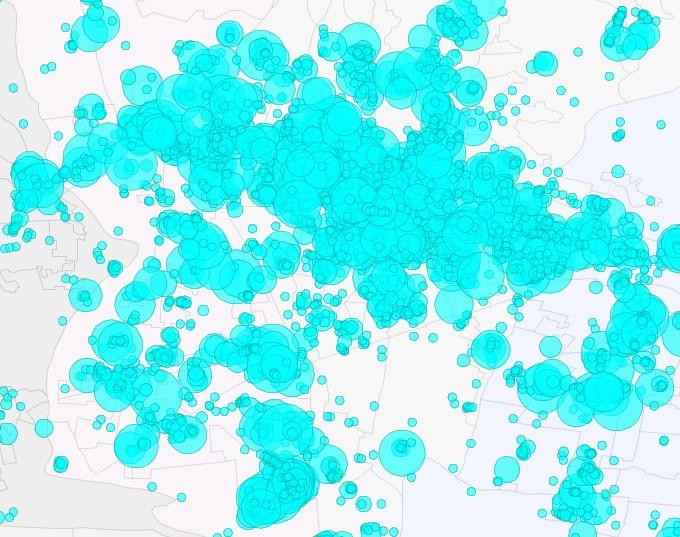
22 How to synthesize Individual Mobility? High level representation Aggregation of sensitive data Abstraction from real geography
23 From raw movement

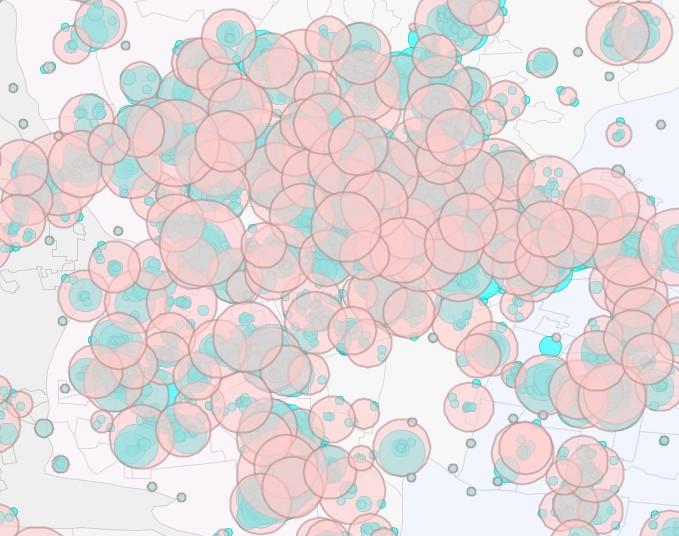
24 to annotated data
25 1) Build from data an Individual Mobility Network (IMN) 2) Extract structural features from the IMN 3) Use a cascading classification with label propagation (ABC classifier)
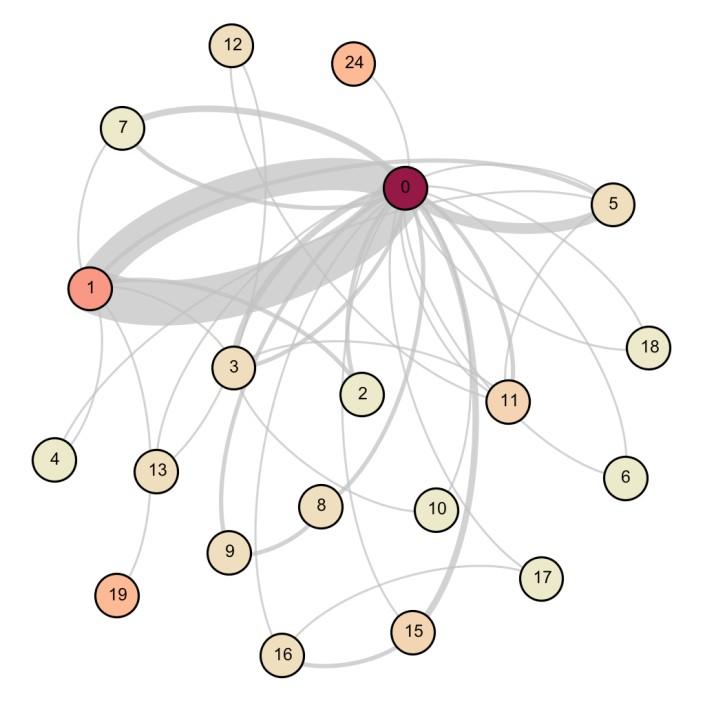
26 ω (0,6 4 )= Extracting the IMN τ(0) = 25 τ(11) = 3 τ(9) = 8 ω(2, 1) = 2 ω(1, 2) = 4
27 Extracting the IMN Trip Features Length Duration Time Interval Average Speed Network Features centrality clustering coefficient average path length predictability entropy hubbiness degree betweenness volume edge weight flow per location
28 Extracting the IMN from to weight ccfrom ccto duration min min min min min ω(2, 1) = 3 ω(1, 2) = 2
29 ABC Classifier Principles: The activities of a user should be predicted as a whole, not separately Some activities are easy to classify Other activities might benefit from contextual information obtained from previous predictions E.g.: a place frequently visited after work might be more likely to be leisure / shopping
30 ABC Classifier Inspired by Nested Cascade Classification

31 ABC Classifier Inspired by Nested Cascade Classification
32 The ABC classifier
33 The ABC classifier
34 The ABC classifier
35 The ABC classifier
36 Experiments GPS traces 6,953 trips 65 vehicles

37 Semantic Mobility Analytics Temporal Analysis Pisa traffic In Out
38 Semantic Mobility Analytics Temporal Analysis Calci traffic In Out

39 Semantic Mobility Analytics Temporal Analysis

40 User Profiling In computer science, is the process of construction and extraction of models representing user behavior generated by computerized data analysis. Are employed to study, analyze and understand human behaviors and interactions. Are exploited by many applications to make predictions, to give suggestions etc.
41 MYWay: Trajectory Prediction


42 Individual and Collective Profile Individual Profile Input: Individual Data Output: Individual Patterns Collective Profile Input: Collectivity Data Output: Collective Patterns
43 Prediction using probability mixture models J. Ghosh, M. J. Beal, H. Q. Ngo, and C. Qiao. On profiling mobility and predicting locations of wireless users J. Ghosh, H. Q. Ngo, and C. Qiao. Mobility profile based routing within intermittently connected mobile ad hoc networks (icman) I. F. Akyildiz and W. Wang. The predictive user mobility prole framework for wireless multimedia networks

44 Prediction based on individual and collective preferences F. Calabrese, G. Di Lorenzo, and C. Ratti. Human mobility prediction based on individual and collective geographical preferences


45 Prediction using complex networks and probability D. Barth, S. Bellahsene, and L. Kloul. Mobility prediction using mobile user profiles D. Barth, S. Bellahsene, and L. Kloul. Combining local and global proles for mobility prediction in lte femtocells
46 Collective prediction using t-patterns F. Giannotti, M. Nanni, F. Pinelli, and D. Pedreschi. Trajectory pattern mining A. Monreale, F. Pinelli, R. Trasarti, and F. Giannotti. Wherenext: a location predictor on trajectory pattern mining
47 Mobility Profiling A concise model ables to describe the user s mobility in terms of representative movements, i.e. routines. This model is called Mobility Profile. Mining mobility user profiles for car pooling. Trasarti, Pinelli, Nanni, Giannotti. KDD 2011

48 Derived patterns and models: mobility profiles User history An ordered sequence of spatiotemporal points. Trips construction Grouping Cutting the user history when a stop is detected Performing a density based clustering equipped with a spatio temporal distance function Stops Spatial Threshold Stops Temporal Threshold Spatial Tollerance Temporal Tollerance Spatio temporal distance Pruning Groups with a small Number of trips are Pruned Profile extraction The medoid of each group becomes user s routines and the all set become the user s mobility profile Support Threshold Trasarti, Pinelli, Nanni, Giannotti. Mining mobility user profiles for car pooling. ACM SIGKDD 2011

49 Idea in a nutshell Use the mobility profile to predict the user s movements. If it is not able to produce a prediction, a collective predictor is used. The collective predictor is built using the mobility profiles of the crowd.
50 Experimental setting Starting from a dataset of 1 month of movements, users and trajectories. We divided the training set, i.e. 3 weeks and as test set the remaining last week. The trajectories in the test set are cut to become the queries for the predictor. The cuts tested are taking the first 33% or 66% of the trajectories.

51 Extracting the Mobility Profiles The first step is to extract the mobility profiles from the training set. In order to assess the quality of them an empirical analysis is performed. Routines per user distribution (left), trajectories and routines time start distribution (right) and the dataset coverage (bottom)


52 Results MyWay obtains good results which are comparable to a global predictor built on top of the whole set of trajectories. Test 33% Test 66%

53 proactive car pooling Project ICON


54 Carpooling cycle Context Several initiatives, especially on the web
55 Carpooling cycle Distinctive features Traditional approach Users manually insert and update their rides Users search and contact candidate pals Users make individual, local choice vs. ICON cycle System autonomously detect systematic trips System automatically suggest pairings System seeks globally optimal allocation

56 Carpooling cycle Assumptions Users provide access to their mobility traces
57 Carpooling cycle Step 1: Inferring Individual Systematic Mobility Extraction of Mobility Profiles Describes an abstraction in space and time of the systematic movements of a user. Exceptional movements are completely ignored. Based on trajectory clustering with noise removal Individual History Trajectory Clusters Routines


58 Carpooling cycle Step 2: Build Network of possible carpool matches Based on routine containment One user can pick up the other along his trip passenger Carpooling network Nodes = users Edges = pairs of users with matching routines driver

59 Application: Car pooling Pro-active suggestions of sharing rides opportunities without the need for the user to explicitly specify the trips of interest. Matching two routines: Mobility profile share-ability:
=0 OR outdegree(n)=0 (a driver cannot be a passenger) indegree(n) capacity(n) N'")
60 Carpooling cycle Step 3: Optimal allocation of drivers-passengers Given a Carpooling Network N, select a subset of edges that minimizes S N S = set of circulating vehicles provided that the edges are coherent, i.e.: indegree(n)=0 OR outdegree(n)=0 (a driver cannot be a passenger) indegree(n) capacity(n) N'
61 Carpooling cycle The simple ICON Loop Users accept/reject suggestions Input mobility data CP: Optimal allocation DM: Extract mobility profiles Build Carpooling network
62 Carpooling cycle Improvement In carpooling (especially if proactive) users might not like the suggested matches Impossible to know who will accept a given match Modeling acceptance might improve results Two new components Learning mechanism to guess success probability of a carpooling match Optimization task exploits it to offer solution with best expected overall success


63 Carpooling cycle Revised ICON Loop accept/reject Training data Users suggestions Input mobility data DM: Extract mobility profiles CP: Allocation with best expected success Weighted Carpooling network ML: Learn/update success model & apply to network

64 Networks as a mining tool S. Rinzivillo, S. Mainardi, F. Pezzoni, M. Coscia, D. Pedreschi, F. Giannotti Discovering the Geographical Borders of Human Mobility KI - Künstliche Intelligenz, 2012.

65 Mobility coverages

66 Step 1: spatial regions

67 Step 2: evaluate flows among regions
68 Step 3: forget geography
69 Step 4: perform community detection

70 Step 4: perform community detection
71 Step 5: map back to geography
72 Step 6: draw borders

73 Final result

74 Final result: compare with municipality borders


75 Borders in different time periods Only weekdays movements Similar to global clustering: strong influence of systematic movements Only weekend movements Strong fragmentation: the influence of systematic movements (home-work) is missing

76 Borders at regional scale

77 Final results

78 Comparison with new provinces
Data Mining II Mobility Data Mining
 Data Mining II Mobility Data Mining F. Giannotti& M. Nanni KDD Lab ISTI CNR Pisa, Italy Outline Mobility Data Mining Introduction MDM methods MDM methods at work. Understanding Human Mobility Clustering
Activity Identification from GPS Trajectories Using Spatial Temporal POIs Attractiveness
 Activity Identification from GPS Trajectories Using Spatial Temporal POIs Attractiveness Lian Huang, Qingquan Li, Yang Yue State Key Laboratory of Information Engineering in Survey, Mapping and Remote
Validating general human mobility patterns on massive GPS data
 Validating general human mobility patterns on massive GPS data Luca Pappalardo, Salvatore Rinzivillo, Dino Pedreschi, and Fosca Giannotti KDDLab, Institute of Information Science and Technologies (ISTI),
Exploring the Patterns of Human Mobility Using Heterogeneous Traffic Trajectory Data
 Exploring the Patterns of Human Mobility Using Heterogeneous Traffic Trajectory Data Jinzhong Wang April 13, 2016 The UBD Group Mobile and Social Computing Laboratory School of Software, Dalian University
Extracting Patterns of Individual Movement Behaviour from a Massive Collection of Tracked Positions
 Extracting Patterns of Individual Movement Behaviour from a Massive Collection of Tracked Positions Gennady Andrienko and Natalia Andrienko Fraunhofer Institute IAIS Schloss Birlinghoven, 53754 Sankt Augustin,
Extracting mobility behavior from cell phone data DATA SIM Summer School 2013
 Extracting mobility behavior from cell phone data DATA SIM Summer School 2013 PETER WIDHALM Mobility Department Dynamic Transportation Systems T +43(0) 50550-6655 F +43(0) 50550-6439 peter.widhalm@ait.ac.at
Mobility, Data Mining and Privacy: The GeoPKDD Paradigm
 Mobility, Data Mining and Privacy: The GeoPKDD Paradigm GeoPKDD White paper, KDD Lab November 23, 2009 Abstract The technologies of mobile communications and ubiquitous computing pervade our society, and
PATREC PERSPECTIVES Sensing Technology Innovations for Tracking Congestion
 PATREC PERSPECTIVES Sensing Technology Innovations for Tracking Congestion Drivers have increasingly been using inexpensive mapping applications imbedded into mobile devices (like Google Maps, MapFactor,
Towards Privacy-Preserving Semantic Mobility Analysis
 EuroVis Workshop on Visual Analytics (2013) M. Pohl and H. Schumann (Editors) Towards Privacy-Preserving Semantic Mobility Analysis N. Andrienko 1, G. Andrienko 1 and G. Fuchs 1 1 Fraunhofer IAIS, Sankt
SPATIO-TEMPORAL PATTERN MINING ON TRAJECTORY DATA USING ARM
 SPATIO-TEMPORAL PATTERN MINING ON TRAJECTORY DATA USING ARM S. Khoshahval a *, M. Farnaghi a, M. Taleai a a Faculty of Geodesy and Geomatics Engineering, K.N. Toosi University of Technology, Tehran, Iran
A Location Predictor based on Dependencies Between Multiple Lifelog Data
 A Location Predictor based on Dependencies Between Multiple Lifelog Data Masaaki Nishino Takashi Yagi Yukihiro Nakamura Shinyo Muto NTT Cyber Solutions Laboratories, NTT Corporation Masanobu Abe Graduate
DM-Group Meeting. Subhodip Biswas 10/16/2014
 DM-Group Meeting Subhodip Biswas 10/16/2014 Papers to be discussed 1. Crowdsourcing Land Use Maps via Twitter Vanessa Frias-Martinez and Enrique Frias-Martinez in KDD 2014 2. Tracking Climate Change Opinions
Spatial and Temporal Evaluation of Network-Based Analysis of Human Mobility
 1 Spatial and Temporal Evaluation of Network-Based Analysis of Human Mobility Michele Coscia 2, Salvatore Rinzivillo 1, Fosca Giannotti 1, Dino Pedreschi 3 1 KDDLab ISTI-CNR, Via G. Moruzzi, 1, Pisa, Italy,
Clustering Analysis of London Police Foot Patrol Behaviour from Raw Trajectories
 Clustering Analysis of London Police Foot Patrol Behaviour from Raw Trajectories Jianan Shen 1, Tao Cheng 2 1 SpaceTimeLab for Big Data Analytics, Department of Civil, Environmental and Geomatic Engineering,
Exploring Human Mobility with Multi-Source Data at Extremely Large Metropolitan Scales. ACM MobiCom 2014, Maui, HI
 Exploring Human Mobility with Multi-Source Data at Extremely Large Metropolitan Scales Desheng Zhang & Tian He University of Minnesota, USA Jun Huang, Ye Li, Fan Zhang, Chengzhong Xu Shenzhen Institute
A route map to calibrate spatial interaction models from GPS movement data
 A route map to calibrate spatial interaction models from GPS movement data K. Sila-Nowicka 1, A.S. Fotheringham 2 1 Urban Big Data Centre School of Political and Social Sciences University of Glasgow Lilybank
Spatial Data Science. Soumya K Ghosh
 Workshop on Data Science and Machine Learning (DSML 17) ISI Kolkata, March 28-31, 2017 Spatial Data Science Soumya K Ghosh Professor Department of Computer Science and Engineering Indian Institute of Technology,
Where to Find My Next Passenger?
 Where to Find My Next Passenger? Jing Yuan 1 Yu Zheng 2 Liuhang Zhang 1 Guangzhong Sun 1 1 University of Science and Technology of China 2 Microsoft Research Asia September 19, 2011 Jing Yuan et al. (USTC,MSRA)
Online Passive-Aggressive Algorithms. Tirgul 11
 Online Passive-Aggressive Algorithms Tirgul 11 Multi-Label Classification 2 Multilabel Problem: Example Mapping Apps to smart folders: Assign an installed app to one or more folders Candy Crush Saga 3
Urban Link Travel Time Estimation Using Large-scale Taxi Data with Partial Information
 Urban Link Travel Time Estimation Using Large-scale Taxi Data with Partial Information * Satish V. Ukkusuri * * Civil Engineering, Purdue University 24/04/2014 Outline Introduction Study Region Link Travel
A framework for spatio-temporal clustering from mobile phone data
 A framework for spatio-temporal clustering from mobile phone data Yihong Yuan a,b a Department of Geography, University of California, Santa Barbara, CA, 93106, USA yuan@geog.ucsb.edu Martin Raubal b b
Project Appraisal Guidelines
 Project Appraisal Guidelines Unit 16.2 Expansion Factors for Short Period Traffic Counts August 2012 Project Appraisal Guidelines Unit 16.2 Expansion Factors for Short Period Traffic Counts Version Date
Implementing Visual Analytics Methods for Massive Collections of Movement Data
 Implementing Visual Analytics Methods for Massive Collections of Movement Data G. Andrienko, N. Andrienko Fraunhofer Institute Intelligent Analysis and Information Systems Schloss Birlinghoven, D-53754
* Abstract. Keywords: Smart Card Data, Public Transportation, Land Use, Non-negative Matrix Factorization.
 Analysis of Activity Trends Based on Smart Card Data of Public Transportation T. N. Maeda* 1, J. Mori 1, F. Toriumi 1, H. Ohashi 1 1 The University of Tokyo, 7-3-1 Hongo Bunkyo-ku, Tokyo, Japan *Email:
Scalable Analysis of Movement Data for Extracting and Exploring Significant Places
 IEEE TRANSACTIONS ON VISUALIZATION AND COMPUTER GRAPHICS, MANUSCRIPT ID 1 Scalable Analysis of Movement Data for Extracting and Exploring Significant Places Gennady Andrienko, Natalia Andrienko, Christophe
Mobility Analytics through Social and Personal Data. Pierre Senellart
 Mobility Analytics through Social and Personal Data Pierre Senellart Session: Big Data & Transport Business Convention on Big Data Université Paris-Saclay, 25 novembre 2015 Analyzing Transportation and
Detecting Origin-Destination Mobility Flows From Geotagged Tweets in Greater Los Angeles Area
 Detecting Origin-Destination Mobility Flows From Geotagged Tweets in Greater Los Angeles Area Song Gao 1, Jiue-An Yang 1,2, Bo Yan 1, Yingjie Hu 1, Krzysztof Janowicz 1, Grant McKenzie 1 1 STKO Lab, Department
Sequential Recommender Systems
 Recommender Stammtisch, Zalando, 26/6/14 Sequential Recommender Systems! Knowledge Mining & Assessment brefeld@kma.informatik.tu-darmstadt.de Collaborative Filtering Prof. Dr. 2 Collaborative Filtering
Automatic Classification of Location Contexts with Decision Trees
 Automatic Classification of Location Contexts with Decision Trees Maribel Yasmina Santos and Adriano Moreira Department of Information Systems, University of Minho, Campus de Azurém, 4800-058 Guimarães,
EXTRACTING SEMANTICS OF Individual PLACES FROM MOVEMENT DATA BY ANALYZING TEMPORAL PATTERNS OF VISITS
 EXTRACTING SEMANTICS OF Individual PLACES FROM MOVEMENT DATA BY ANALYZING TEMPORAL PATTERNS OF VISITS Gennady Andrienko 1,4, Natalia Andrienko 1,4, Georg Fuchs 1, Ana-Maria Olteanu Raimond 2, Juergen Symanzik
Mean, Median, Mode, and Range
 Mean, Median, Mode, and Range Mean, median, and mode are measures of central tendency; they measure the center of data. Range is a measure of dispersion; it measures the spread of data. The mean of a data
Inferring Friendship from Check-in Data of Location-Based Social Networks
 Inferring Friendship from Check-in Data of Location-Based Social Networks Ran Cheng, Jun Pang, Yang Zhang Interdisciplinary Centre for Security, Reliability and Trust, University of Luxembourg, Luxembourg
Will it rain tomorrow?
 Will it rain tomorrow? Bilal Ahmed - 561539 Department of Computing and Information Systems, The University of Melbourne, Victoria, Australia bahmad@student.unimelb.edu.au Abstract With the availability
Towards Fully-automated Driving
 Towards Fully-automated Driving Challenges and Potential Solutions Dr. Gijs Dubbelman Mobile Perception Systems EE-SPS/VCA Mobile Perception Systems 6 PhDs, postdoc, project manager, software engineer,
Optimizing Roadside Advertisement Dissemination in Vehicular CPS
 Optimizing Roadside Advertisement Dissemination in Vehicular CPS Huanyang Zheng and Jie Wu Computer and Information Sciences Temple University 1. Introduction Roadside Advertisement Dissemination Passengers,
Geo-identification and pedestrian navigation with geo-mobile applications: how do users proceed?
 TU Vienna presentation 17 th July 2008 Geo-identification and pedestrian navigation with geo-mobile applications: how do users proceed? Ioannis Delikostidis Corné van Elzakker INTERNATIONAL INSTITUTE FOR
Encapsulating Urban Traffic Rhythms into Road Networks
 Encapsulating Urban Traffic Rhythms into Road Networks Junjie Wang +, Dong Wei +, Kun He, Hang Gong, Pu Wang * School of Traffic and Transportation Engineering, Central South University, Changsha, Hunan,
Lessons From the Trenches: using Mobile Phone Data for Official Statistics
 Lessons From the Trenches: using Mobile Phone Data for Official Statistics Maarten Vanhoof Orange Labs/Newcastle University M.vanhoof1@newcastle.ac.uk @Metti Hoof MaartenVanhoof.com Mobile Phone Data (Call
Using spatial-temporal signatures to infer human activities from personal trajectories on location-enabled mobile devices
 Using spatial-temporal signatures to infer human activities from personal trajectories on location-enabled mobile devices Yingjie Hu 1, Wenwen Li 2, Krzysztof Janowicz 1, Kathleen Deutsch 1, Grant McKenzie
Modelling Spatial Behaviour in Music Festivals Using Mobile Generated Data and Machine Learning
 Modelling Spatial Behaviour in Music Festivals Using Mobile Generated Data and Machine Learning Luis Francisco Mejia Garcia *1, Guy Lansley 2 and Ben Calnan 3 1 Department of Civil, Environmental & Geomatic
The Recognition of Temporal Patterns in Pedestrian Behaviour Using Visual Exploration Tools
 The Recognition of Temporal Patterns in Pedestrian Behaviour Using Visual Exploration Tools I. Kveladze 1, S. C. van der Spek 2, M. J. Kraak 1 1 University of Twente, Faculty of Geo-Information Science
MOBILITY ATLAS BOOKLET: AN URBAN DASHBOARD DESIGN AND IMPLEMENTATION
 MOBILITY ATLAS BOOKLET: AN URBAN DASHBOARD DESIGN AND IMPLEMENTATION KEY WORDS: Data Mining, Big Data, Urban Dashboard L Gabrielli 1, M Rossi 2, F Giannotti 1, D Fadda 1, S Rinzivillo 1 1 Istituto di Scienza
Bus Landscapes: Analyzing Commuting Pattern using Bus Smart Card Data in Beijing
 Bus Landscapes: Analyzing Commuting Pattern using Bus Smart Card Data in Beijing Ying Long, Beijing Institute of City Planning 龙瀛 Jean-Claude Thill, The University of North Carolina at Charlotte 1 INTRODUCTION
Friendship and Mobility: User Movement In Location-Based Social Networks. Eunjoon Cho* Seth A. Myers* Jure Leskovec
 Friendship and Mobility: User Movement In Location-Based Social Networks Eunjoon Cho* Seth A. Myers* Jure Leskovec Outline Introduction Related Work Data Observations from Data Model of Human Mobility
Finding Poverty in Satellite Images
 Finding Poverty in Satellite Images Neal Jean Stanford University Department of Electrical Engineering nealjean@stanford.edu Rachel Luo Stanford University Department of Electrical Engineering rsluo@stanford.edu
Assessing the Influence of Spatio-Temporal Context for Next Place Prediction using Different Machine Learning Approaches
 International Journal of Geo-Information Article Assessing the Influence of Spatio-Temporal Context for Next Place Prediction using Different Machine Learning Approaches Jorim Urner 1 ID, Dominik Bucher
An Implementation of Mobile Sensing for Large-Scale Urban Monitoring
 An Implementation of Mobile Sensing for Large-Scale Urban Monitoring Teerayut Horanont 1, Ryosuke Shibasaki 1,2 1 Department of Civil Engineering, University of Tokyo, Meguro, Tokyo 153-8505, JAPAN Email:
Measuring User Similarity with Trajectory Patterns: Principles and New Metrics
 Measuring User Similarity with Trajectory Patterns: Principles and New Metrics Xihui hen 1, Ruipeng Lu 2, Xiaoxing Ma 3, and Jun Pang 1,2 1 Interdisciplinary entre for Security, Reliability and Trust,
Beating Social Pulse: Understanding Information Propagation via Online Social Tagging Systems 1
 Journal of Universal Computer Science, vol. 18, no. 8 (2012, 1022-1031 submitted: 16/9/11, accepted: 14/12/11, appeared: 28/4/12 J.UCS Beating Social Pulse: Understanding Information Propagation via Online
Exploiting Geographic Dependencies for Real Estate Appraisal
 Exploiting Geographic Dependencies for Real Estate Appraisal Yanjie Fu Joint work with Hui Xiong, Yu Zheng, Yong Ge, Zhihua Zhou, Zijun Yao Rutgers, the State University of New Jersey Microsoft Research
CS6375: Machine Learning Gautam Kunapuli. Decision Trees
 Gautam Kunapuli Example: Restaurant Recommendation Example: Develop a model to recommend restaurants to users depending on their past dining experiences. Here, the features are cost (x ) and the user s
Trip and Parking Generation Study of Orem Fitness Center-Abstract
 Trip and Parking Generation Study of Orem Fitness Center-Abstract The Brigham Young University Institute of Transportation Engineers student chapter (BYU ITE) completed a trip and parking generation study
VISUAL EXPLORATION OF SPATIAL-TEMPORAL TRAFFIC CONGESTION PATTERNS USING FLOATING CAR DATA. Candra Kartika 2015
 VISUAL EXPLORATION OF SPATIAL-TEMPORAL TRAFFIC CONGESTION PATTERNS USING FLOATING CAR DATA Candra Kartika 2015 OVERVIEW Motivation Background and State of The Art Test data Visualization methods Result
Understanding taxi travel demand patterns through Floating Car Data Nuzzolo, A., Comi, A., Papa, E. and Polimeni, A.
 WestminsterResearch http://www.westminster.ac.uk/westminsterresearch Understanding taxi travel demand patterns through Floating Car Data Nuzzolo, A., Comi, A., Papa, E. and Polimeni, A. A paper presented
CS145: INTRODUCTION TO DATA MINING
 CS145: INTRODUCTION TO DATA MINING 5: Vector Data: Support Vector Machine Instructor: Yizhou Sun yzsun@cs.ucla.edu October 18, 2017 Homework 1 Announcements Due end of the day of this Thursday (11:59pm)
Spatial Extension of the Reality Mining Dataset
 R&D Centre for Mobile Applications Czech Technical University in Prague Spatial Extension of the Reality Mining Dataset Michal Ficek, Lukas Kencl sponsored by Mobility-Related Applications Wanted! Urban
Stochastic prediction of train delays with dynamic Bayesian networks. Author(s): Kecman, Pavle; Corman, Francesco; Peterson, Anders; Joborn, Martin
: Kecman, Pavle; Corman, Francesco; Peterson, Anders; Joborn, Martin") Research Collection Other Conference Item Stochastic prediction of train delays with dynamic Bayesian networks Author(s): Kecman, Pavle; Corman, Francesco; Peterson, Anders; Joborn, Martin Publication
Research Collection Other Conference Item Stochastic prediction of train delays with dynamic Bayesian networks Author(s): Kecman, Pavle; Corman, Francesco; Peterson, Anders; Joborn, Martin Publication
An Ontology-based Framework for Modeling Movement on a Smart Campus
 An Ontology-based Framework for Modeling Movement on a Smart Campus Junchuan Fan 1, Kathleen Stewart 1 1 Department of Geographical and Sustainability Sciences, University of Iowa, Iowa City, IA, 52242,
A new type of RICEPOTS
 A new type of RICEPOTS Alan Parkinson Geography teaching resource College Crown Copyright and Database Right 2014. Ordnance Survey (Digimap Licence) This is one of a series of teaching resources for use
Mountain View Community Shuttle Monthly Operations Report
 Mountain View Community Shuttle Monthly Operations Report October 9, 2018 Contents Passengers per Day, Table...- 3 - Passengers per Day, Chart...- 3 - Ridership Year-To-Date...- 4 - Average Daily Ridership
Style-aware Mid-level Representation for Discovering Visual Connections in Space and Time
 Style-aware Mid-level Representation for Discovering Visual Connections in Space and Time Experiment presentation for CS3710:Visual Recognition Presenter: Zitao Liu University of Pittsburgh ztliu@cs.pitt.edu
Web Structure Mining Nodes, Links and Influence
 Web Structure Mining Nodes, Links and Influence 1 Outline 1. Importance of nodes 1. Centrality 2. Prestige 3. Page Rank 4. Hubs and Authority 5. Metrics comparison 2. Link analysis 3. Influence model 1.
Models to carry out inference vs. Models to mimic (spatio-temporal) systems 5/5/15
 systems 5/5/15") Models to carry out inference vs. Models to mimic (spatio-temporal) systems 5/5/15 Ring-Shaped Hotspot Detection: A Summary of Results, IEEE ICDM 2014 (w/ E. Eftelioglu et al.) Where is a crime source?
Models to carry out inference vs. Models to mimic (spatio-temporal) systems 5/5/15 Ring-Shaped Hotspot Detection: A Summary of Results, IEEE ICDM 2014 (w/ E. Eftelioglu et al.) Where is a crime source?
Randomized Decision Trees
 Randomized Decision Trees compiled by Alvin Wan from Professor Jitendra Malik s lecture Discrete Variables First, let us consider some terminology. We have primarily been dealing with real-valued data,
Discovering Urban Spatial-Temporal Structure from Human Activity Patterns
 ACM SIGKDD International Workshop on Urban Computing (UrbComp 2012) Discovering Urban Spatial-Temporal Structure from Human Activity Patterns Shan Jiang, shanjang@mit.edu Joseph Ferreira, Jr., jf@mit.edu
Information Extraction from Text
 Information Extraction from Text Jing Jiang Chapter 2 from Mining Text Data (2012) Presented by Andrew Landgraf, September 13, 2013 1 What is Information Extraction? Goal is to discover structured information
Discovering and Predicting User Routines by Differential Analysis of Social Network Traces
 Discovering and Predicting User Routines by Differential Analysis of Social Network Traces Fabio Pianese, Xueli An, Fahim Kawsar, Hiroki Ishizuka Enabling Computing Technologies Domain Bell Labs, Alcatel-Lucent
Diagnosing New York City s Noises with Ubiquitous Data
 Diagnosing New York City s Noises with Ubiquitous Data Dr. Yu Zheng yuzheng@microsoft.com Lead Researcher, Microsoft Research Chair Professor at Shanghai Jiao Tong University Background Many cities suffer
PROBABILISTIC LATENT SEMANTIC ANALYSIS
 PROBABILISTIC LATENT SEMANTIC ANALYSIS Lingjia Deng Revised from slides of Shuguang Wang Outline Review of previous notes PCA/SVD HITS Latent Semantic Analysis Probabilistic Latent Semantic Analysis Applications
Urban Computing Using Big Data to Solve Urban Challenges
 Urban Computing Using Big Data to Solve Urban Challenges Dr. Yu Zheng Lead Researcher, Microsoft Research Asia Chair Professor at Shanghai Jiaotong University http://research.microsoft.com/en-us/projects/urbancomputing/default.aspx
Assessing spatial distribution and variability of destinations in inner-city Sydney from travel diary and smartphone location data
 Assessing spatial distribution and variability of destinations in inner-city Sydney from travel diary and smartphone location data Richard B. Ellison 1, Adrian B. Ellison 1 and Stephen P. Greaves 1 1 Institute
SPACE-TIME ACCESSIBILITY MEASURES FOR EVALUATING MOBILITY-RELATED SOCIAL EXCLUSION OF THE ELDERLY
 SPACE-TIME ACCESSIBILITY MEASURES FOR EVALUATING MOBILITY-RELATED SOCIAL EXCLUSION OF THE ELDERLY Izumiyama, Hiroshi Institute of Environmental Studies, The University of Tokyo, Tokyo, Japan Email: izumiyama@ut.t.u-tokyo.ac.jp
Visitor Flows Model for Queensland a new approach
 Visitor Flows Model for Queensland a new approach Jason. van Paassen 1, Mark. Olsen 2 1 Parsons Brinckerhoff Australia Pty Ltd, Brisbane, QLD, Australia 2 Tourism Queensland, Brisbane, QLD, Australia 1
DANIEL WILSON AND BEN CONKLIN. Integrating AI with Foundation Intelligence for Actionable Intelligence
 DANIEL WILSON AND BEN CONKLIN Integrating AI with Foundation Intelligence for Actionable Intelligence INTEGRATING AI WITH FOUNDATION INTELLIGENCE FOR ACTIONABLE INTELLIGENCE in an arms race for artificial
Next Place Prediction Based on Spatiotemporal Pattern Mining of Mobile Device Logs
 sensors Article Next Place Prediction Based on Spatiotemporal Pattern Mining of Mobile Device Logs Sungjun Lee 1, Junseok Lim 1, Jonghun Park 1, * and Kwanho Kim 2 1 Department of Industrial Engineering,
CS 188: Artificial Intelligence. Outline
 CS 188: Artificial Intelligence Lecture 21: Perceptrons Pieter Abbeel UC Berkeley Many slides adapted from Dan Klein. Outline Generative vs. Discriminative Binary Linear Classifiers Perceptron Multi-class
Revisitation in Urban Space vs. Online: A Comparison across POIs, Websites, and Smartphone Apps.
 156 Revisitation in Urban Space vs. Online: A Comparison across POIs, Websites, and Smartphone Apps. HANCHENG CAO, ZHILONG CHEN, FENGLI XU, and YONG LI, Beijing National Research Center for Information
Parking Study MAIN ST
 Parking Study This parking study was initiated to help understand parking supply and parking demand within Oneida City Center. The parking study was performed and analyzed by the Madison County Planning
1 [15 points] Frequent Itemsets Generation With Map-Reduce
![1 [15 points] Frequent Itemsets Generation With Map-Reduce](/thumbs/72/67172903.jpg "1 [15 points] Frequent Itemsets Generation With Map-Reduce") Data Mining Learning from Large Data Sets Final Exam Date: 15 August 2013 Time limit: 120 minutes Number of pages: 11 Maximum score: 100 points You can use the back of the pages if you run out of space.
Data Mining Learning from Large Data Sets Final Exam Date: 15 August 2013 Time limit: 120 minutes Number of pages: 11 Maximum score: 100 points You can use the back of the pages if you run out of space.
Using ArcGIS for Intelligence Analysis. Tony Mason Suzanne Foss Vinh Lam
 Using ArcGIS for Intelligence Analysis Tony Mason Suzanne Foss Vinh Lam Agenda Background Concepts of Using ArcGIS for Intelligence Analysis Pattern of Life Analysis Scenario based demonstration Conclusions
The Scope and Growth of Spatial Analysis in the Social Sciences
 context. 2 We applied these search terms to six online bibliographic indexes of social science Completed as part of the CSISS literature search initiative on November 18, 2003 The Scope and Growth of Spatial
Sample. Contents SECTION 1: PLACE NAMES 6 SECTION 2: CONNECTING TO PLACES 21 SECTION 3: SPACES: NEAR AND FAR 53
 Contents Teachers' Notes 4 National Curriculum Links 5 SECTION 1: PLACE NAMES 6 Teachers' Notes 7-8 Activities Names Of Places 9 Place Names Are Important 1 10 Place Names Are Important 2 11 The Meanings
Mountain View Community Shuttle Monthly Operations Report
 Mountain View Community Shuttle Monthly Operations Report December 6, 2018 Contents Passengers per Day, Table...- 3 - Passengers per Day, Chart...- 3 - Ridership Year-To-Date...- 4 - Average Daily Ridership
Not All Apps Are Created Equal:
 Not All Apps Are Created Equal: Analysis of Spatiotemporal Heterogeneity in Nationwide Mobile Service Usage Cristina Marquez and Marco Gramaglia (Universidad Carlos III de Madrid); Marco Fiore (CNR-IEIIT);
Measuring Poverty. Introduction
 Measuring Poverty Introduction To measure something, we need to provide answers to the following basic questions: 1. What are we going to measure? Poverty? So, what is poverty? 2. Who wants to measure
classroomsecrets.com Reasoning and Problem Solving Read and Interpret Line Graphs Teaching Information
 Reasoning and Problem Solving Read and Interpret Line Graphs 1 National Curriculum Objective: Mathematics Year 5: Solve comparison, sum and difference problems using information presented in a line graph
Advanced Techniques for Mining Structured Data: Process Mining
 Advanced Techniques for Mining Structured Data: Process Mining Frequent Pattern Discovery /Event Forecasting Dr A. Appice Scuola di Dottorato in Informatica e Matematica XXXII Problem definition 1. Given
Distributed ML for DOSNs: giving power back to users
 Distributed ML for DOSNs: giving power back to users Amira Soliman KTH isocial Marie Curie Initial Training Networks Part1 Agenda DOSNs and Machine Learning DIVa: Decentralized Identity Validation for
Approximate Inference Part 1 of 2
 Approximate Inference Part 1 of 2 Tom Minka Microsoft Research, Cambridge, UK Machine Learning Summer School 2009 http://mlg.eng.cam.ac.uk/mlss09/ Bayesian paradigm Consistent use of probability theory
Tomás Eiró Luis Miguel Martínez José Manuel Viegas
 Acknowledgm ents Tomás Eiró Luis Miguel Martínez José Manuel Viegas Instituto Superior Técnico, Lisboa WSTLUR 2011 Whistler, 29 July 2011 Introduction Background q Spatial interactions models are a key
CIV3703 Transport Engineering. Module 2 Transport Modelling
 CIV3703 Transport Engineering Module Transport Modelling Objectives Upon successful completion of this module you should be able to: carry out trip generation calculations using linear regression and category
Approximate Inference Part 1 of 2
 Approximate Inference Part 1 of 2 Tom Minka Microsoft Research, Cambridge, UK Machine Learning Summer School 2009 http://mlg.eng.cam.ac.uk/mlss09/ 1 Bayesian paradigm Consistent use of probability theory
arxiv: v2 [cs.cy] 8 Nov 2016
![arxiv: v2 [cs.cy] 8 Nov 2016](/thumbs/86/93084365.jpg "arxiv: v2 [cs.cy] 8 Nov 2016") A Fuzzy Logic System to Analyze a Student s Lifestyle Sourish Ghosh, Aaditya Sanjay Boob, Nishant Nikhil, Nayan Raju Vysyaraju, and Ankit Kumar Department of Mathematics, Indian Institute of Technology
A Fuzzy Logic System to Analyze a Student s Lifestyle Sourish Ghosh, Aaditya Sanjay Boob, Nishant Nikhil, Nayan Raju Vysyaraju, and Ankit Kumar Department of Mathematics, Indian Institute of Technology
Predictive analysis on Multivariate, Time Series datasets using Shapelets
 1 Predictive analysis on Multivariate, Time Series datasets using Shapelets Hemal Thakkar Department of Computer Science, Stanford University hemal@stanford.edu hemal.tt@gmail.com Abstract Multivariate,
1 Handling of Continuous Attributes in C4.5. Algorithm
 .. Spring 2009 CSC 466: Knowledge Discovery from Data Alexander Dekhtyar.. Data Mining: Classification/Supervised Learning Potpourri Contents 1. C4.5. and continuous attributes: incorporating continuous
FURTHER MATHEMATICS Units 3 & 4 - Written Examination 2
 THIS BOX IS FOR ILLUSTRATIVE PURPOSES ONLY 2016 Examination Package - Trial Examination 4 of 5 Figures STUDENT NUMBER Letter Words FURTHER MATHEMATICS Units 3 & 4 - Written Examination 2 (TSSM s 2014 trial
Induction of Decision Trees
 Induction of Decision Trees Peter Waiganjo Wagacha This notes are for ICS320 Foundations of Learning and Adaptive Systems Institute of Computer Science University of Nairobi PO Box 30197, 00200 Nairobi.
Appendix BAL Baltimore, Maryland 2003 Annual Report on Freeway Mobility and Reliability
 (http://mobility.tamu.edu/mmp) Office of Operations, Federal Highway Administration Appendix BAL Baltimore, Maryland 2003 Annual Report on Freeway Mobility and Reliability This report is a supplement to:
City monitoring with travel demand momentum vector fields: theoretical and empirical findings
 City monitoring with travel demand momentum vector fields: theoretical and empirical findings Xintao Liu 1, Joseph Y.J. Chow 2 1 Department of Civil Engineering, Ryerson University, Canada 2 Tandon School
Information Retrieval and Organisation
 Information Retrieval and Organisation Chapter 13 Text Classification and Naïve Bayes Dell Zhang Birkbeck, University of London Motivation Relevance Feedback revisited The user marks a number of documents