A Computational Movement Analysis Framework For Exploring Anonymity In Human Mobility Trajectories
|
|
|
- Katherine Mitchell
- 6 years ago
- Views:
Transcription


1 A Computational Movement Analysis Framework For Exploring Anonymity In Human Mobility Trajectories Jennifer A. Miller 2015 UT CID Report #1512 This UT CID research was supported in part by the following organizations: identity.utexas.edu
2 A COMPUTATIONAL MOVEMENT ANALYSIS FRAMEWORK FOR EXPLORING ANONYMITY IN HUMAN MOBILITY TRAJECTORIES Background Advancements in tracking technologies such as global positioning systems (GPS), radio frequency identification (RFID), cellular phone networks, and WiFi hotspots have resulted in significant increases in the availability of highly accurate data on moving objects, with unprecedented high spatial and temporal resolution. Within geographic information science (GIScience), computational movement analysis (CMA) has recently emerged as a subfield that focuses on the development and application of computational techniques for collecting, managing, and analyzing movement data in order to better understand the processes that are associated with them (Gudmundssen et al. 2012). As these technologies facilitate the collection of near-seamless (in some cases sub-second) movement tracks, the spatiotemporal footprint of an individual s movement can be explored using CMA techniques. These location data are often studied as trajectories, comprised of a series of timestamped sequential locations. Depending upon the collection method, the location information can be represented by precise latitude and longitude coordinates (e.g., GPS data from a smartphone or other device) or the unique catchment area of a single cellular tower (e.g. call detail records from cellular phones). These relatively low cost location data are used to explore human mobility patterns related to, for example, urban planning, transportation infrastructure, disaster planning/evacuation strategies, potential disease spread, and many other applications (Becker et al. 2013). The ability to study human mobility and issues related to interaction with the environment or other individuals, and the behaviors these interactions suggest has been greatly enhanced by technological advancements that facilitate the collection of high quality location data at unprecedented spatial and temporal resolutions. However, as often happens with technological advancements, the collection of these data has preceded extensive study on how and what they can (or should) be used for, as well as the privacy implications associated with distributing information on an individual s location. The research presented here explores issues related to privacy and identity associated with more recently available high resolution GPS location data. The analysis focuses on using methods from movement pattern analysis and spatial statistical methods to address the following issues: Can activity hot spots be identified from movement data and how can their spatiotemporal structure be explored?
3 How unique are anonymized movement trajectories? How is their uniqueness affected by spatial and temporal resolution? Can movement characteristics such as speed be used to uniquely characterize trajectories? Using movement pattern analysis to identify potential activity hot spots from GPS trajectory data: a case study using taxicab data in San Francisco. An important application using location data involves exploring the spatiotemporal pattern of activity they represent. Previous examples focused predominantly on call detail records (CDR) that were aggregated to their nearest cellular tower (see Gao 2015 for review). Spatial autocorrelation analysis was used to identify source areas with more outgoing calls and sink areas, where more incoming calls occurred. More recently, GPS data have been used to explore movement activity of taxis in Shanghai (Deng and Ji 2011), taxis in New York City (Qian et al. 2015), and cement trucks in Athens (Orellana et al. 2010). While there are certain predictable spatial patterns of taxicab location and movement related to city structure (e.g. greater activity in central business district) or time of day (e.g. towards and away from CBD in morning and evening, respectively), there are also stochastic elements associated with other factors that can often be related to ephemeral activities and passenger behaviors. I hypothesized that the spatiotemporal structure of the collective movement of the taxicabs could be used to infer points-of-interest (POI) or activity hot spots, and that some hot spots would emerge or disappear depending on the time of day. Research questions: How can movement pattern analysis and spatial statistics be used to identify collective points of interest from GPS location data? How can the spatiotemporal structure of these movement activities be explicitly analyzed and visualized? Data San Francisco Cab Dataset ( I used 40 cabs and extracted data for one weekday (Wednesday June 4, 2008) to examine how movement analysis and spatial statistics can be used to explore potential points of interest (POI). The temporal resolution was approximately 1 minute. GPS locations for each of the 40 cabs were partitioned into one of three temporal bins: morning (7-10 am, n = 4634), afternoon (4-7 pm, n = 6009), and evening (9pm-12 midnight, n = 6087). Methods Two different methods were used to explore hot spot activities: the first method involved aggregating the taxi locations to a 250 meter x 250 meter square (size was selected because it is greater than 1 city block but less than 2 blocks) for a subset of downtown San Francisco (peak activity). The number of taxi locations for each square and for each of the three time periods (morning, afternoon, evening) was counted and analyzed using global and local Moran s I.
4 Where x is the count of taxi cabs and wij is the spatial weights matrix used to represent what is near. I used both 1st and 2nd order (row-standardized) contiguity for spatial weights matrix here. Moran s I ranges from [-1] indicating extreme negative spatial autocorrelation to [+1], indicating extreme positive spatial autocorrelation, with values near 0 indicating no autocorrelation. Anselin (1995) introduced a local statistics that decomposed the global Moran s I to a local measure (LISA- local indicator of spatial autocorrelation) as: Where a value is calculated for each observation. A single statistic is no longer reported with LISA, but the values can be mapped and the spatial distribution of spatial autocorrelation can be explored. Figures 2-4 show the local spatial autocorrelation of the taxicabs for the morning (fig. 2), afternoon (fig. 3), and evening (fig. 4) time periods, along with the raw counts. There is a core of relatively high counts in the upper right of the study that is maintained for all time periods, but the magnitude of this core is different for each time period, ranging from a small cluster of high-high values in the morning (fig. 2b) to the largest cluster for the afternoon (fig. 3b). While the global Moran s I was positive and statistically significant for all time periods (using Monte Carlo permutations (n=499), indicating that the overall pattern was near values were similar to each other, there were outliers for each time period. There were 7 high-low cells in the morning- cells (fig. 2b) that had a high count surrounded by neighbors with low cells- which could indicate an isolated area of high activity. Additionally, a single statistically significant positive value for (global) Moran s I indicates overall positive spatial autocorrelation, but cannot differentiate between clusters of high values and clusters of low values. Mapping the local Ii values illustrates that, in addition to the core of high taxi activity, there is a core of low taxi activity in the bottom left for all time periods, as well as pockets of negative spatial autocorrelation (high-low and low-high).
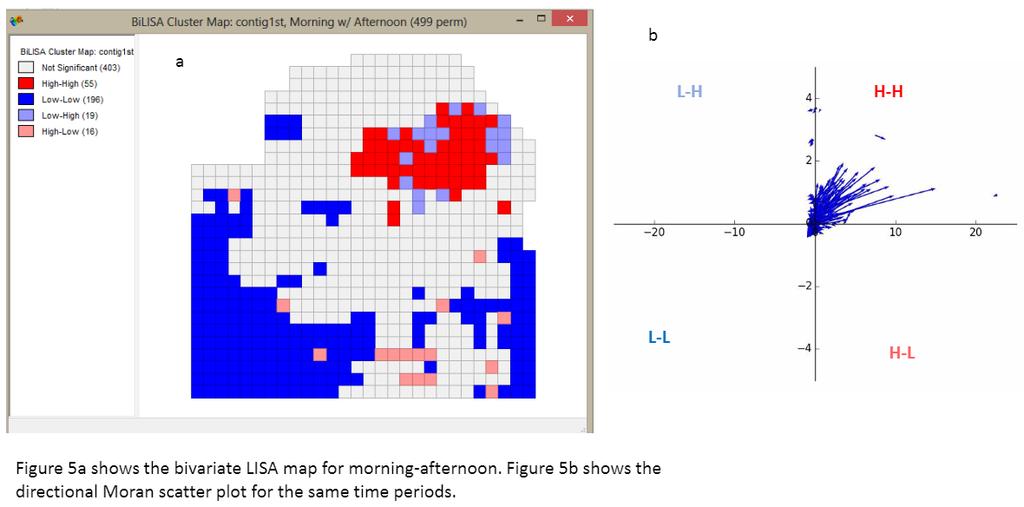
5 The local statistic LISA can be further extended to measure cross-correlation between the value of a variable for a target cell compared to the lagged value of a different variable for its neighbors (in equation 2.0 above, the x variables on the right side of the equation would represent a different variable). Bivariate LISA statistics are particularly useful for studying the change in a variable across time periods (Anselin et al ). Figure 5a shows the bivariate LISA for morning counts as the target compared to the neighboring cells counts for the afternoon. A high-high and low-low cells would be interpreted as an area of high or low activity, respectively, across both time periods, while a low-high would identify a cell that had low activity in the morning compared to high activity among its neighbors in the afternoon. Conversely a high-low would indicate a cell that had high morning activity compared to the low afternoon activity of its neighbors. The low-high cells fringing the CBD show that the area of activity increases from morning to afternoon. Figure 6a shows the afternoon-evening pattern, where a hot spot emerges in the southeastern part of the study area near a major freeway (Bayshore). Figure 7a compares morning counts to evening, and this area is a large hot spot, confirming that it is an area of high activity in the morning and evening, but relatively low activity in the afternoon. A high-low cell here represents an area of high activity in the morning that is less active in the evening and low-high is cells for which activity is higher in the evening compared to morning. A more recent extension to bivariate LISA is the directional Moran scatter plot, which allows for better visualization of the dynamics between changing spatial patterns across time periods (Rey 2014). The directional LISA shows the movement of the statistics across two time periods, and therefore incorporates information from two different Moran scatterplots. For example, figure 5b shows the change in LISA statistic for each cell from morning to afternoon: each vector starts in its position for morning (from figure 2b) and ends in its position for afternoon (from figure 3b). The small arrows in the top left lowhigh quadrant represent cells that were low activity surrounded by high activity in both morning and afternoon. Figure 6b shows that there was much more variation in LISA statistics in afternoon and evening. The vector that is highlighted with a yellow star represents a cell that was a cold spot, or area of low activity in the afternoon, but became a hot spot in the evening. In addition to measuring the spatial pattern of aggregated counts to identify likely activity hotspots, a more novel method involves measuring the spatial autocorrelation of movement parameters, specifically speed. Orellana and Wachowicz (2011) used LISA to analyze pedestrian movement in order to uncover movement suspension (low-low clusters) they suggested would indicate points of interest or activity hotspots. After testing different nearest neighbor spatial weights matrices, one that considers only the 10 closest neighbors to be near was used to measure spatial autocorrelation for all points within each of the three time periods. As the variable of interest is now speed, a low-low could be used to suggest an area of interest or a hot spot, while high-high points would most likely be associated with freeways. Low-highs and high-lows would likely be difficult to disentangle from variable traffic patterns (e.g. stop and go traffic). Figure 8a shows the
6 pattern for the morning period (fig. 8b is zoomed in to downtown San Francisco). Figures 9a and 9b are for the afternoon period and figures 10a and 10b are evening. The spatial distribution of these suspended movement areas represented by low-lows varies with the time of day. In order to more easily visualize the differences in the spatial distribution of low-lows, kernel density of just the low-low points was calculated and a home range or area where most of them was occurred was extracted. While the afternoon and evening low-low clusters are in similar places, the morning low-low clusters extend farther downtown. Also, the afternoon and evening clusters at the bottom right represent the San Francisco Airport, where there was less slow speed among taxi cabs in the morning period. Examining the uniqueness of human mobility trajectories: a case study using smartphone data from Beijing Aggregating counts of GPS locations to a larger area approximates the spatial resolution available when these studies were done with cell phone towers and call counts were aggregated to the Voronoi polygon drawn around each cellular tower. However, there are important privacy issues associated with dealing with actual GPS locations that are often overlooked. Location data are often released after they have been anonymized which means that the trajectory has been stripped of any obvious identifying information such as name, address, phone number, etc. However, personal points of interest (home, work) can still be identified by mining trajectory data for movement patterns, and these points of interest are often associated with unique individuals. Additional locations may be resolved that could have negative implications (ex. repeated visits to a medical clinic may be a cause for concern for employers). Due to data availability, most of the previous work on unicity or measuring the uniqueness of movement traces or trajectories has been with much coarser scaled cell phone data. Surprisingly, even relatively coarse spatial resolution location data such as that associated with call detail records (CDR), where location is an area defined by its proximity to a specific cell phone tower, can be used to uniquely identify an individual. Locations of cell phone towers or antennae are based on population density and the area associated with each one varies considerably. In their study in a small European country, de Montjoye et al. (2013) found that the reception or catchment area for an antenna ranged from 0.15 km2 in urban areas to 15 km2 in rural areas. Zang and Bolot (2011) used anonymized CDR from 25 million individuals across the U.S. to determine the top N locations at which calls were recorded for each of three months. They found that when N = 2 (typically corresponding to work and home), they found that up to 35% of the individuals could be uniquely identified. When N = 3 (they suggested the 3rd location typically represented a school or shopping related location), 50% could be uniquely identified. In their seminal study, de Montjoye et al. (2013) used fifteen months of anonymized mobile phone data (CDR) for 1.5 million individuals in a western European country and found that
7 four randomly selected spatiotemporal points were sufficient to uniquely identify 95% of the individuals. Perhaps more troubling, they found that over 50% of individuals were uniquely identifiable from just two randomly selected locations (typically also corresponding to home and work). Song et al (2014) found similar results with a dataset of one week of mobility data for 1.14 million people (total 56 million records): with just two random points, 60% of the trajectories were unique. It is important to note that uniqueness does not equate to re-identifiability and the objectives of these studies were to examine how unique individual trajectories were, not to actually deanonymize them or re-attach an individual s information to a unique trajectory. However, the ability to determine uniqueness of trajectories is an important prerequisite for re-identification (which would involve correlation with an ancillary dataset) and therefore, represents a potential threat to individual privacy. The degree of uniqueness of trajectories can vary as a function of factors such as typical commuting patterns, transportation modes, and geographical region (which affects commuting patterns and transportation modes). There have been several methods proposed to quantify the anonymity of a database. The most commonly used method of k- anonymity was introduced by Sweeney (2002) as a measure to increase anonymity for non-spatial databases. When applied to spatial databases, it ensures that any set of records (locations) for an individual is at least the same as k-1 individuals. Generally, k = 2, ensuring that at least two trajectories are equivalent, but as k increases, so too does the anonymity. Extensions of k-anonymity include l-diversity and t-closeness (Li et al. 2007). These measures are generally used to manage trajectory datasets (i.e., data would be manipulated so that the level of anonymity reached the reported k level), but in order to quantify the actual level of anonymity of trajectory datasets, a rigorous analysis comparing random points from each trajectory to all other trajectories has to be conducted. With trajectory datasets now available at one second intervals, the volume of these data can result in computationally intensive analysis. Montjoye et al (2013) measured unicity as the percentage of 2500 random traces that were unique give p random points (p ranged from 2 to 5). Song et al (2014) defined uniqueness of trajectories as the percentage of all available trajectories that were uniquely associated with p random points, which they varied from 2 to 6. While anonymity (or lack thereof) has been studied with CDR data, as the previous examples show, it has not yet been addressed with finer spatiotemporal resolution available as GPS locations from, e.g., smartphones. These datasets could potentially be far more unique and therefore more difficult to anonymize. In this study, I do an extensive study of the unicity of GPS movement trajectories testing the effect of spatial resolution and temporal resolution. In addition to location, I also explore how effective movement parameters such as speed could be for uniquely identifying a trajectory. This is one of the first studies to measure unicity of trajectories composed of GPS locations.
8 I hypothesized that the unicity of trajectories will be greater for GPS locations than the coarser scaled CDR locations. I also hypothesized that the attenuating effects of coarsening spatial and temporal resolution will have less impact than they would with CDR locations. I expect that speed will also be effective for uniquely identifying a trajectory when several data points are used. Research questions: How can anonymity be quantified for different types of trajectories and how is it affected by spatial and temporal resolution? Can movement characteristics such as speed be used to uniquely characterize a trajectory in the absence of actual locations? Data Microsoft GeoLife Trajectories ( This is an extremely dense dataset, with temporal resolution of ~1-5 seconds and spatial resolution of ~5-10 meters. We used only one year of data (January December 2009) and used a spatial mask of Beijing (39.6 to 40.2 N latitude), (116 to E longitudes) to remove users who traveled outside of the city during this time period. This resulted in 71 users who had a total of 7,243 daily trajectories (number of locations visited within trajectories varied but the mean was 1600). Methods The basis of our unicity test involved extracting 500 sets of points of size n from each user and counting how many other trajectories they are found in. The percentage of 500 sets of points that matched only one trajectory was calculated and this was done for each of 71 users for four different point sizes (n = 2, 3, 4, and 5). Our measure of unicity, u, is the percentage of 500 random points of size n that are contained in only one trajectory averaged across all 71 users. A unicity value close to 100 indicates a highly unique trajectory that could theoretically be deanonymized, or re-connected with identifying user information more easily; a low unicity value suggests that the random set of points are contained in several different trajectories and therefore would make de-anonymizing trajectories far more challenging. The amount of information from each point was variedwe used just location (x and y), location and time (x,y, and t), and the absolute angle (the absolute angle for point i is measured between the x direction and the step built by relocations i and i + 1). The original latitude and longitude coordinates for these locations have a spatial precision of six decimal places (~0.1 m). In order to test how spatial and temporal resolution affected measurement of unicity, the geographic coordinates were coarsened first to four decimal places (~10m) and the temporal resolution was coarsened to 30 seconds, then further coarsened to three decimal places (100 m) and 60 seconds. Additionally, the precision of
9 the absolute angle measure was decreased from the original (five decimal places) to three decimal places. Figure 12 displays the trajectories for two different users for a single day. The zoomed in subset helps to illustrate the importance of location precision- there are several locations that would be the same for both users if the location precision was coarsened ten- or 100- fold. Figure 13 shows three different users daily trajectories in a space-time cube. The red and green users overlap in time, but not space, while the red and blue users overlap in space but not time. The use of all three pieces of coordinate information- x, y, and t- can be extremely important for uniquely associating a single trajectory. Results Table 1 shows the unicity values associated with size of each random point set. The mean was the average unicity across all 71 users, while the minimum and maximum show the variation in unicity among users. In general, the locations of points on a trajectory were highly unique. 90% of the random sets of just two points composed of only location (no timestamp) were associated with only one trajectory. Adding the timestamp increased the unicity of two points to 97%. When five points with location and timestamp were used, the unicity increased to almost 99%. Somewhat surprisingly, the angle of movement alone has fairly high unicity when the angle of three points are tested, the unicity is similar to the unicity of location for CDR as found in de Montjoye et al. (2013) and Song et al. (2014). Five angle values could uniquely identify a trajectory 73% of the time. Table 1: unicity results for location (x,y), location and time (x,y, t) and the absolute angle of a point. Means and ranges are reported for 500 sets of random points for each of 71 users. Unicity values for coarsened location, time, and absolute angle are shown in table 2. When just two points (no timestamp) are used at the coarser resolution (spatial precision reduced tenfold to ~10 m), only 68.5% of the time are the points associated with a unique trajectory. When the 30 seconds less precise timestamp is added, the unicity is similar to the original resolution, and with five points with location and timestamp, unicity increases to ~94%. The unicity of the absolute angle degrades substantially even using a set of five points results in less than 5% unicity.


10 Table 2: unicity results for location (x,y), location and time (x,y, t) and the absolute angle of a point. Spatial resolution has been coarsened to 4 decimal places; temporal resolution has been coarsened to 30 seconds; and absolute angle coarsened to three decimal places. Means and ranges are reported for 500 sets of random points for each of 71 users. Table 3 shows unicity values for the coarsest location coordinates: the spatial resolution of an x/y pair is now ~100 m and the temporal resolution was coarsened to one minute. The spatial resolution here is closer to the resolution of the antenna reception areas used in the de Montjoye et al. (2013) paper (where spatial resolution ranged from 115 m to 15 km), but the coarsened temporal resolution is still much more precise than the one used in the CDR studies. As a result, using location and time for just two points still results in a high unicity (mean 80.3%), while five points increases the mean unicity to almost 88%. Using just location (no timestamp), the unicity degrades to 32% for two points and 66% for five points. Table 3: unicity results for location (x,y), location and time (x,y, t). Spatial resolution has been coarsened to 3 decimal places; temporal resolution has been coarsened to 60 seconds. Means and ranges are reported for 500 sets of random points for each of 71 users. The mean unicity values for location and location + time, with different levels of coarsening are summarized in figure 14. With the much higher precision and spatial resolution of GPS data currently available, two x/y locations are sufficient to be uniquely associated with a
11 single trajectory 90% of the time, adding the timestamp matches a single trajectory 97% of the time. The three pieces of information- x, y, time- are so specific that increasing the number of points to match to five increases the unicity very little because it is already so high using just two points. The first level of coarsening for x,y,t (~10m spatial, 30 seconds temporal) has similar unicity to the original resolution for just x,y coordinates, and when four or five points are used, the coarsened x,y,t has slightly higher mean unicity. The most coarsened level for x,y,t (~100m, 60 seconds) still has a high unicity (80% for two points). The x,y coordinates (no timestamp) show the greatest increase in unicity when more points are used for matching. This suggests that there is a trade-off between location resolution and amount of information (location points) available. Discussion/Future Work While each of the issues addressed here focuses on a single dataset for the case study, I would expect the results to be generally applicable to other similar mobility datasets. The hotspot analysis illustrated that local spatial statistics can be used to identify hot spots of movement activity, and spatial statistics visualization tools are useful for exploring how these hot spots change through time. The spatial statistics used here all were extensions of Moran s I index, which requires a variable of interest that is measured on a ratio or interval scale, and locations of points do not meet this condition. Therefore, the points were aggregated to polygons and the counts were used as the variable of interest. In the second part of this study, speed (m/sec) was calculated for each point (based on the distance from and time since the previous location) and used as the variable of interest. Spatial autocorrelation of the speed associated with each point was classified into high-high (likely associated with highways), low-high, high-low, and lowlow, which were used here to indicate potential areas of interest. A better understanding of the spatiotemporal structure of human mobility could also increase the predictability of movement. For example, a pattern of high activity or relatively slow movement in certain locations at certain times of the day could be used to infer future movement at the same locations. In both of the above examples, location and relative speed were used as proxies for behavior, respectively. It is also important to note that these variables represented collective behavior, as all points for all 40 taxicabs were considered together. There are interesting future directions to go in with this research, particularly comparing the utility of associating relative speed with points-of-interest for different types of moving entities. Automobiles, and taxicabs in particular, move differently (and slow down for different reasons sometimes) compared to pedestrians and wildlife, and even regular vehicles. It would be interesting to also test how useful other movement parameters such as relative and absolute angle and step length would be for identifying points-of-interest. This is only applicable for entities that can move more freely across space and are less confined to street networks or sidewalks.
12 The unicity study has particularly important implications for privacy and the increasing availability of anonymized trajectory datasets. This is one of the first studies to explore unicity and anonymity with higher resolution GPS data and it should be troubling how unique a set of two location points can be. Decreasing the spatial and temporal resolution reduces the unicity, but five points with x,y coordinates at the coarsest resolution tested here were still uniquely associated with a single trajectory more than 60% of the time. Movement parameters such as speed, angle, and step length have not been tested as potential identifiers of trajectories, but the case study here focusing on absolute angle highlights their potential importance. Five absolute angle data points were uniquely associated with a single trajectory 72% of the time. This suggests that individual movement, irrespective of absolute geographic location, can be identifiable with a sufficient level of precision of angle measurements and data points. Future work should focus specifically on how movement parameters could be used singly or together to identify a trajectory. It is also important to note here that the focus of this study was not to re-attach user information to trajectories, it was just to examine how unique trajectories were based on different factors. The privacy issues associated with higher quality GPS location data should be addressed with the assumption that if a trajectory can be uniquely described with 2-5 GPS points, the trajectory could eventually be de-anonymized. References Anselin L (1995) Local Indicators of Spatial Association LISA. Geographical Analysis, 27(2), Anselin L, Sridharan S and Gholston S (2006) Using Exploratory Spatial Data Analysis to Leverage Social Indicator Databases: The Discovery of Interesting Patterns. Social Indicators Research, 82(2), Becker R, Cáceres R, Hanson K, et al. (2013) Human Mobility Characterization from Cellular Network Data. Commun. ACM, 56(1), de Montjoye Y-A, Hidalgo CA, Verleysen M, et al. (2013) Unique in the Crowd: The privacy bounds of human mobility. Scientific Reports, 3, Deng Z and Ji M (2011) Spatiotemporal structure of taxi services in Shanghai: Using exploratory spatial data analysis. In: IEEE, pp Gao S (2015) Spatio-Temporal Analytics for Exploring Human Mobility Patterns and Urban Dynamics in the Mobile Age. Spatial Cognition & Computation, 15(2), Gudmundsson J, Laube P and Wolle T (2012) Computational movement analysis. In: Kresse W and Danko DM (eds), Springer Handbook of Geographic Information, Springer Berlin Heidelberg, pp
13 Li N, Li T and Venkatasubramanian S (2007) t-closeness: Privacy Beyond k-anonymity and ldiversity. In: IEEE 23rd International Conference on Data Engineering, ICDE 2007, pp Orellana D and Wachowicz M (2011) Exploring Patterns of Movement Suspension in Pedestrian Mobility. Geographical Analysis, 43(3), Orellana DA, Wachowicz M, Knegt de HJ, et al. (2010) Uncovering patterns of suspension of movement. Piorkowski, M., Sarafijanovic-- -Djukic, N., and Grossglauser, M. CRAWDAD dataset epfl/mobility (v ), downloaded from doi: /c7j010, Feb Qian X, Zhan X and Ukkusuri SV (2015) Characterizing Urban Dynamics Using Large Scale Taxicab Data. Springer International Publishing. Rey SJ (2014) Spatial Dynamics and Space-Time Data Analysis. Springer Berlin Heidelberg. Sweeney L (2002) k-anonymity: A MODEL FOR PROTECTING PRIVACY. International Journal of Uncertainty, Fuzziness and Knowledge-Based Systems, 10(05), Zang H and Bolot J (2011) Anonymization of Location Data Does Not Work: A Large-scale Measurement Study. In: Proceedings of the 17th Annual International Conference on Mobile Computing and Networking, MobiCom 11, New York, NY, USA: ACM, pp , Available from: (accessed 15 May 2015). Zheng, Y. Lizhu Zhang, Xing Xie, Wei-Ying Ma. Mining interesting locations and travel sequences from GPS trajectories. In Proceedings of International conference on World Wild Web (WWW 2009), Madrid Spain. ACM Press: Zheng, Y., Quannan Li, Yukun Chen, Xing Xie, Wei-Ying Ma. Understanding Mobility Based on GPS Data. In Proceedings of ACM conference on Ubiquitous Computing (UbiComp 2008), Seoul, Korea. ACM Press: Zheng, Y. Xing Xie, Wei-Ying Ma, GeoLife: A Collaborative Social Networking Service among User, location and trajectory. Invited paper, in IEEE Data Engineering Bulletin. 33, 2, 2010, pp

14

15

16

17


18

19


20

21

22

23
24 Appendix:
25
26
27
28
29
30
31
32
33
34
35
36
37 2015 Proprietary, The University of Texas at Austin, All Rights Reserved. For more information on Center for Identity research, resources and information, visit identity.utexas.edu. identity.utexas.edu
Encapsulating Urban Traffic Rhythms into Road Networks
 Encapsulating Urban Traffic Rhythms into Road Networks Junjie Wang +, Dong Wei +, Kun He, Hang Gong, Pu Wang * School of Traffic and Transportation Engineering, Central South University, Changsha, Hunan,
Detecting Origin-Destination Mobility Flows From Geotagged Tweets in Greater Los Angeles Area
 Detecting Origin-Destination Mobility Flows From Geotagged Tweets in Greater Los Angeles Area Song Gao 1, Jiue-An Yang 1,2, Bo Yan 1, Yingjie Hu 1, Krzysztof Janowicz 1, Grant McKenzie 1 1 STKO Lab, Department
Exploring Human Mobility with Multi-Source Data at Extremely Large Metropolitan Scales. ACM MobiCom 2014, Maui, HI
 Exploring Human Mobility with Multi-Source Data at Extremely Large Metropolitan Scales Desheng Zhang & Tian He University of Minnesota, USA Jun Huang, Ye Li, Fan Zhang, Chengzhong Xu Shenzhen Institute
Exploring the Patterns of Human Mobility Using Heterogeneous Traffic Trajectory Data
 Exploring the Patterns of Human Mobility Using Heterogeneous Traffic Trajectory Data Jinzhong Wang April 13, 2016 The UBD Group Mobile and Social Computing Laboratory School of Software, Dalian University
VISUAL EXPLORATION OF SPATIAL-TEMPORAL TRAFFIC CONGESTION PATTERNS USING FLOATING CAR DATA. Candra Kartika 2015
 VISUAL EXPLORATION OF SPATIAL-TEMPORAL TRAFFIC CONGESTION PATTERNS USING FLOATING CAR DATA Candra Kartika 2015 OVERVIEW Motivation Background and State of The Art Test data Visualization methods Result
Estimating Large Scale Population Movement ML Dublin Meetup
 Deutsche Bank COO Chief Data Office Estimating Large Scale Population Movement ML Dublin Meetup John Doyle PhD Assistant Vice President CDO Research & Development Science & Innovation john.doyle@db.com
Neighborhood Locations and Amenities
 University of Maryland School of Architecture, Planning and Preservation Fall, 2014 Neighborhood Locations and Amenities Authors: Cole Greene Jacob Johnson Maha Tariq Under the Supervision of: Dr. Chao
GIScience & Mobility. Prof. Dr. Martin Raubal. Institute of Cartography and Geoinformation SAGEO 2013 Brest, France
 GIScience & Mobility Prof. Dr. Martin Raubal Institute of Cartography and Geoinformation mraubal@ethz.ch SAGEO 2013 Brest, France 25.09.2013 1 www.woodsbagot.com 25.09.2013 2 GIScience & Mobility Modeling
PATREC PERSPECTIVES Sensing Technology Innovations for Tracking Congestion
 PATREC PERSPECTIVES Sensing Technology Innovations for Tracking Congestion Drivers have increasingly been using inexpensive mapping applications imbedded into mobile devices (like Google Maps, MapFactor,
SPATIO-TEMPORAL PATTERN MINING ON TRAJECTORY DATA USING ARM
 SPATIO-TEMPORAL PATTERN MINING ON TRAJECTORY DATA USING ARM S. Khoshahval a *, M. Farnaghi a, M. Taleai a a Faculty of Geodesy and Geomatics Engineering, K.N. Toosi University of Technology, Tehran, Iran
Uncovering Patterns of Suspension of Movement
 Uncovering Patterns of Suspension of Movement D. Orellana, M. Wachowicz, H.J. De Knegt, A. Ligtenberg and A. K. Bregt Wageningen UR, P.O. Box 6700AA Wageningen, The Netherlands Email: [daniel.orellana,
Uncovering the Digital Divide and the Physical Divide in Senegal Using Mobile Phone Data
 Uncovering the Digital Divide and the Physical Divide in Senegal Using Mobile Phone Data Song Gao, Bo Yan, Li Gong, Blake Regalia, Yiting Ju, Yingjie Hu STKO Lab, Department of Geography, University of
Measurement of human activity using velocity GPS data obtained from mobile phones
 Measurement of human activity using velocity GPS data obtained from mobile phones Yasuko Kawahata 1 Takayuki Mizuno 2 and Akira Ishii 3 1 Graduate School of Information Science and Technology, The University
Sensing Urban Density using Mobile Phone GPS Locations: A case study of Odaiba area, Japan
 Sensing Urban Density using Mobile Phone GPS Locations: A case study of Odaiba area, Japan Teerayut Horanont 1,2,*, Santi Phithakkitnukoon 3,*, Ryosuke Shibasaki 1 1 Department of Civil Engineering, The
Spatial-Temporal Analytics with Students Data to recommend optimum regions to stay
 Spatial-Temporal Analytics with Students Data to recommend optimum regions to stay By ARUN KUMAR BALASUBRAMANIAN (A0163264H) DEVI VIJAYAKUMAR (A0163403R) RAGHU ADITYA (A0163260N) SHARVINA PAWASKAR (A0163302W)
Assessing spatial distribution and variability of destinations in inner-city Sydney from travel diary and smartphone location data
 Assessing spatial distribution and variability of destinations in inner-city Sydney from travel diary and smartphone location data Richard B. Ellison 1, Adrian B. Ellison 1 and Stephen P. Greaves 1 1 Institute
A route map to calibrate spatial interaction models from GPS movement data
 A route map to calibrate spatial interaction models from GPS movement data K. Sila-Nowicka 1, A.S. Fotheringham 2 1 Urban Big Data Centre School of Political and Social Sciences University of Glasgow Lilybank
Implementing Visual Analytics Methods for Massive Collections of Movement Data
 Implementing Visual Analytics Methods for Massive Collections of Movement Data G. Andrienko, N. Andrienko Fraunhofer Institute Intelligent Analysis and Information Systems Schloss Birlinghoven, D-53754
* Abstract. Keywords: Smart Card Data, Public Transportation, Land Use, Non-negative Matrix Factorization.
 Analysis of Activity Trends Based on Smart Card Data of Public Transportation T. N. Maeda* 1, J. Mori 1, F. Toriumi 1, H. Ohashi 1 1 The University of Tokyo, 7-3-1 Hongo Bunkyo-ku, Tokyo, Japan *Email:
Socio-Economic Levels and Human Mobility
 1 Socio-Economic Levels and Human Mobility V. Frias-Martinez, J. Virseda, E. Frias-Martinez Abstract Socio-economic levels provide an understanding of the population s access to housing, education, health
A framework for spatio-temporal clustering from mobile phone data
 A framework for spatio-temporal clustering from mobile phone data Yihong Yuan a,b a Department of Geography, University of California, Santa Barbara, CA, 93106, USA yuan@geog.ucsb.edu Martin Raubal b b
Discovering Urban Spatial-Temporal Structure from Human Activity Patterns
 ACM SIGKDD International Workshop on Urban Computing (UrbComp 2012) Discovering Urban Spatial-Temporal Structure from Human Activity Patterns Shan Jiang, shanjang@mit.edu Joseph Ferreira, Jr., jf@mit.edu
Lecture 3: Exploratory Spatial Data Analysis (ESDA) Prof. Eduardo A. Haddad
 Prof. Eduardo A. Haddad") Lecture 3: Exploratory Spatial Data Analysis (ESDA) Prof. Eduardo A. Haddad Key message Spatial dependence First Law of Geography (Waldo Tobler): Everything is related to everything else, but near things
Lecture 3: Exploratory Spatial Data Analysis (ESDA) Prof. Eduardo A. Haddad Key message Spatial dependence First Law of Geography (Waldo Tobler): Everything is related to everything else, but near things
SPACE Workshop NSF NCGIA CSISS UCGIS SDSU. Aldstadt, Getis, Jankowski, Rey, Weeks SDSU F. Goodchild, M. Goodchild, Janelle, Rebich UCSB
 SPACE Workshop NSF NCGIA CSISS UCGIS SDSU Aldstadt, Getis, Jankowski, Rey, Weeks SDSU F. Goodchild, M. Goodchild, Janelle, Rebich UCSB August 2-8, 2004 San Diego State University Some Examples of Spatial
An Implementation of Mobile Sensing for Large-Scale Urban Monitoring
 An Implementation of Mobile Sensing for Large-Scale Urban Monitoring Teerayut Horanont 1, Ryosuke Shibasaki 1,2 1 Department of Civil Engineering, University of Tokyo, Meguro, Tokyo 153-8505, JAPAN Email:
Research Article Urban Mobility Dynamics Based on Flexible Discrete Region Partition
 International Journal of Distributed Sensor Networks, Article ID 782649, 1 pages http://dx.doi.org/1.1155/214/782649 Research Article Urban Mobility Dynamics Based on Flexible Discrete Region Partition
Extracting mobility behavior from cell phone data DATA SIM Summer School 2013
 Extracting mobility behavior from cell phone data DATA SIM Summer School 2013 PETER WIDHALM Mobility Department Dynamic Transportation Systems T +43(0) 50550-6655 F +43(0) 50550-6439 peter.widhalm@ait.ac.at
Spatial Data, Spatial Analysis and Spatial Data Science
 Spatial Data, Spatial Analysis and Spatial Data Science Luc Anselin http://spatial.uchicago.edu 1 spatial thinking in the social sciences spatial analysis spatial data science spatial data types and research
GPS-tracking Method for Understating Human Behaviours during Navigation
 GPS-tracking Method for Understating Human Behaviours during Navigation Wook Rak Jung and Scott Bell Department of Geography and Planning, University of Saskatchewan, Saskatoon, SK Wook.Jung@usask.ca and
Lecture 3: Exploratory Spatial Data Analysis (ESDA) Prof. Eduardo A. Haddad
 Prof. Eduardo A. Haddad") Lecture 3: Exploratory Spatial Data Analysis (ESDA) Prof. Eduardo A. Haddad Key message Spatial dependence First Law of Geography (Waldo Tobler): Everything is related to everything else, but near things
Lecture 3: Exploratory Spatial Data Analysis (ESDA) Prof. Eduardo A. Haddad Key message Spatial dependence First Law of Geography (Waldo Tobler): Everything is related to everything else, but near things
City of Hermosa Beach Beach Access and Parking Study. Submitted by. 600 Wilshire Blvd., Suite 1050 Los Angeles, CA
 City of Hermosa Beach Beach Access and Parking Study Submitted by 600 Wilshire Blvd., Suite 1050 Los Angeles, CA 90017 213.261.3050 January 2015 TABLE OF CONTENTS Introduction to the Beach Access and Parking
Outline ESDA. Exploratory Spatial Data Analysis ESDA. Luc Anselin
 Exploratory Spatial Data Analysis ESDA Luc Anselin University of Illinois, Urbana-Champaign http://www.spacestat.com Outline ESDA Exploring Spatial Patterns Global Spatial Autocorrelation Local Spatial
Data Mining II Mobility Data Mining
 Data Mining II Mobility Data Mining F. Giannotti& M. Nanni KDD Lab ISTI CNR Pisa, Italy Outline Mobility Data Mining Introduction MDM methods MDM methods at work. Understanding Human Mobility Clustering
Differentially Private Real-time Data Release over Infinite Trajectory Streams
 Differentially Private Real-time Data Release over Infinite Trajectory Streams Kyoto University, Japan Department of Social Informatics Yang Cao, Masatoshi Yoshikawa 1 Outline Motivation: opportunity &
Generating Urban Mobility Data Sets Using Scalable GANs
 Generating Urban Mobility Data Sets Using Scalable GANs Abhinav Jauhri & John Paul Shen ECE Department Carnegie Mellon University {ajauhri, jpshen}@cmu.edu Objective Generate city-scale human mobility
Modeling Crowd Flows Network to Infer Origins and Destinations of Crowds from Cellular Data
 Modeling Crowd Flows Network to Infer Origins and Destinations of Crowds from Cellular Data Ai-Jou Chou ajchou@cs.nctu.edu.tw Gunarto Sindoro Njoo gunarto.cs01g@g2.nctu.edu.tw Wen-Chih Peng wcpeng@cs.nctu.edu.tw
GIS Spatial Statistics for Public Opinion Survey Response Rates
 GIS Spatial Statistics for Public Opinion Survey Response Rates July 22, 2015 Timothy Michalowski Senior Statistical GIS Analyst Abt SRBI - New York, NY t.michalowski@srbi.com www.srbi.com Introduction
Place this Photo on a Map: A Study of Explicit Disclosure of Location Information
 Place this Photo on a Map: A Study of Explicit Disclosure of Location Information Fabien Girardin 1, Josep Blat 1 1 Department of ICT, Pompeu Fabra University, 08003 Barcelona, Spain {Fabien.Girardin,
Keywords: Air Quality, Environmental Justice, Vehicle Emissions, Public Health, Monitoring Network
 NOTICE: this is the author s version of a work that was accepted for publication in Transportation Research Part D: Transport and Environment. Changes resulting from the publishing process, such as peer
Assessing pervasive user-generated content to describe tourist dynamics
 Assessing pervasive user-generated content to describe tourist dynamics Fabien Girardin, Josep Blat Universitat Pompeu Fabra, Barcelona, Spain {Fabien.Girardin, Josep.Blat}@upf.edu Abstract. In recent
The Challenge of Geospatial Big Data Analysis
 288 POSTERS The Challenge of Geospatial Big Data Analysis Authors - Teerayut Horanont, University of Tokyo, Japan - Apichon Witayangkurn, University of Tokyo, Japan - Shibasaki Ryosuke, University of Tokyo,
Local Spatial Autocorrelation Clusters
 Local Spatial Autocorrelation Clusters Luc Anselin http://spatial.uchicago.edu LISA principle local Moran local G statistics issues and interpretation LISA Principle Clustering vs Clusters global spatial
Spatial Data Science. Soumya K Ghosh
 Workshop on Data Science and Machine Learning (DSML 17) ISI Kolkata, March 28-31, 2017 Spatial Data Science Soumya K Ghosh Professor Department of Computer Science and Engineering Indian Institute of Technology,
Extracting Patterns of Individual Movement Behaviour from a Massive Collection of Tracked Positions
 Extracting Patterns of Individual Movement Behaviour from a Massive Collection of Tracked Positions Gennady Andrienko and Natalia Andrienko Fraunhofer Institute IAIS Schloss Birlinghoven, 53754 Sankt Augustin,
Activity Identification from GPS Trajectories Using Spatial Temporal POIs Attractiveness
 Activity Identification from GPS Trajectories Using Spatial Temporal POIs Attractiveness Lian Huang, Qingquan Li, Yang Yue State Key Laboratory of Information Engineering in Survey, Mapping and Remote
Understanding taxi travel demand patterns through Floating Car Data Nuzzolo, A., Comi, A., Papa, E. and Polimeni, A.
 WestminsterResearch http://www.westminster.ac.uk/westminsterresearch Understanding taxi travel demand patterns through Floating Car Data Nuzzolo, A., Comi, A., Papa, E. and Polimeni, A. A paper presented
Spatiotemporal Analysis of Urban Traffic Accidents: A Case Study of Tehran City, Iran
 Spatiotemporal Analysis of Urban Traffic Accidents: A Case Study of Tehran City, Iran January 2018 Niloofar HAJI MIRZA AGHASI Spatiotemporal Analysis of Urban Traffic Accidents: A Case Study of Tehran
Parking Occupancy Prediction and Pattern Analysis
 Parking Occupancy Prediction and Pattern Analysis Xiao Chen markcx@stanford.edu Abstract Finding a parking space in San Francisco City Area is really a headache issue. We try to find a reliable way to
Spatial Extension of the Reality Mining Dataset
 R&D Centre for Mobile Applications Czech Technical University in Prague Spatial Extension of the Reality Mining Dataset Michal Ficek, Lukas Kencl sponsored by Mobility-Related Applications Wanted! Urban
Mapcube and Mapview. Two Web-based Spatial Data Visualization and Mining Systems. C.T. Lu, Y. Kou, H. Wang Dept. of Computer Science Virginia Tech
 Mapcube and Mapview Two Web-based Spatial Data Visualization and Mining Systems C.T. Lu, Y. Kou, H. Wang Dept. of Computer Science Virginia Tech S. Shekhar, P. Zhang, R. Liu Dept. of Computer Science University
Urban Population Migration Pattern Mining Based on Taxi Trajectories
 Urban Population Migration Pattern Mining Based on Taxi Trajectories ABSTRACT Bing Zhu Tsinghua University Beijing, China zhub.daisy@gmail.com Leonidas Guibas Stanford University Stanford, CA, U.S.A. guibas@cs.stanford.edu
DM-Group Meeting. Subhodip Biswas 10/16/2014
 DM-Group Meeting Subhodip Biswas 10/16/2014 Papers to be discussed 1. Crowdsourcing Land Use Maps via Twitter Vanessa Frias-Martinez and Enrique Frias-Martinez in KDD 2014 2. Tracking Climate Change Opinions
Diagnosing New York City s Noises with Ubiquitous Data
 Diagnosing New York City s Noises with Ubiquitous Data Dr. Yu Zheng yuzheng@microsoft.com Lead Researcher, Microsoft Research Chair Professor at Shanghai Jiao Tong University Background Many cities suffer
The Use of Local Moran s I in Determining the Effectiveness of Location for Gas Extraction
 Lauren Heller GIS and GPS Applications in Earth Science December 7, 2009 The Use of Local Moran s I in Determining the Effectiveness of Location for Gas Extraction The base map of gas production in Yuma
Exploring the Impact of Ambient Population Measures on Crime Hotspots
 Exploring the Impact of Ambient Population Measures on Crime Hotspots Nick Malleson School of Geography, University of Leeds http://nickmalleson.co.uk/ N.S.Malleson@leeds.ac.uk Martin Andresen Institute
Purchase patterns, socioeconomic status, and political inclination
 Purchase patterns, socioeconomic status, and political inclination Xiaowen Dong 1, Eaman Jahani 1, Alfredo Morales-Guzman 1,2, Burçin Bozkaya 3, Bruno Lepri 1,4, and Alex Sandy Pentland 1 1 MIT Media Lab.
TOWARDS ESTIMATING THE PRESENCE OF VISITORS FROM THE AGGREGATE MOBILE PHONE NETWORK ACTIVITY THEY GENERATE
 TOWARDS ESTIMATING THE PRESENCE OF VISITORS FROM THE AGGREGATE MOBILE PHONE NETWORK ACTIVITY THEY GENERATE Fabien GIRARDIN SENSEable City Laboratory Massachusetts Institute of Technology 77 Massachusetts
Automatic Classification of Location Contexts with Decision Trees
 Automatic Classification of Location Contexts with Decision Trees Maribel Yasmina Santos and Adriano Moreira Department of Information Systems, University of Minho, Campus de Azurém, 4800-058 Guimarães,
QUANTIFICATION OF THE NATURAL VARIATION IN TRAFFIC FLOW ON SELECTED NATIONAL ROADS IN SOUTH AFRICA
 QUANTIFICATION OF THE NATURAL VARIATION IN TRAFFIC FLOW ON SELECTED NATIONAL ROADS IN SOUTH AFRICA F DE JONGH and M BRUWER* AECOM, Waterside Place, Tygerwaterfront, Carl Cronje Drive, Cape Town, South
A Machine Learning Approach to Trip Purpose Imputation in GPS-Based Travel Surveys
 A Machine Learning Approach to Trip Purpose Imputation in GPS-Based Travel Surveys Yijing Lu 1, Shanjiang Zhu 2, and Lei Zhang 3,* 1. Graduate Research Assistant 2. Research Scientist 2. Assistant Professor
Inferring Friendship from Check-in Data of Location-Based Social Networks
 Inferring Friendship from Check-in Data of Location-Based Social Networks Ran Cheng, Jun Pang, Yang Zhang Interdisciplinary Centre for Security, Reliability and Trust, University of Luxembourg, Luxembourg
Clustering Analysis of London Police Foot Patrol Behaviour from Raw Trajectories
 Clustering Analysis of London Police Foot Patrol Behaviour from Raw Trajectories Jianan Shen 1, Tao Cheng 2 1 SpaceTimeLab for Big Data Analytics, Department of Civil, Environmental and Geomatic Engineering,
The Recognition of Temporal Patterns in Pedestrian Behaviour Using Visual Exploration Tools
 The Recognition of Temporal Patterns in Pedestrian Behaviour Using Visual Exploration Tools I. Kveladze 1, S. C. van der Spek 2, M. J. Kraak 1 1 University of Twente, Faculty of Geo-Information Science
Exploring the Association Between Family Planning and Developing Telecommunications Infrastructure in Rural Peru
 Exploring the Association Between Family Planning and Developing Telecommunications Infrastructure in Rural Peru Heide Jackson, University of Wisconsin-Madison September 21, 2011 Abstract This paper explores
Supporting movement patterns research with qualitative sociological methods gps tracks and focus group interviews. M. Rzeszewski, J.
 Supporting movement patterns research with qualitative sociological methods gps tracks and focus group interviews M. Rzeszewski, J. Kotus Adam Mickiewicz University, ul. Dziegielowa 27, 61-680 Poznan,
Modelling exploration and preferential attachment properties in individual human trajectories
 1.204 Final Project 11 December 2012 J. Cressica Brazier Modelling exploration and preferential attachment properties in individual human trajectories using the methods presented in Song, Chaoming, Tal
Unit 1 Part 2. Concepts Underlying The Geographic Perspective
 Unit 1 Part 2 Concepts Underlying The Geographic Perspective Unit Expectations 1.B Enduring Understanding: Students will be able to.. Know that Geography offers asset of concepts, skills, and tools that
Spatial Analysis 1. Introduction
 Spatial Analysis 1 Introduction Geo-referenced Data (not any data) x, y coordinates (e.g., lat., long.) ------------------------------------------------------ - Table of Data: Obs. # x y Variables -------------------------------------
Geographical Bias on Social Media and Geo-Local Contents System with Mobile Devices
 212 45th Hawaii International Conference on System Sciences Geographical Bias on Social Media and Geo-Local Contents System with Mobile Devices Kazunari Ishida Hiroshima Institute of Technology k.ishida.p7@it-hiroshima.ac.jp
Spatial Analysis I. Spatial data analysis Spatial analysis and inference
 Spatial Analysis I Spatial data analysis Spatial analysis and inference Roadmap Outline: What is spatial analysis? Spatial Joins Step 1: Analysis of attributes Step 2: Preparing for analyses: working with
Validating general human mobility patterns on massive GPS data
 Validating general human mobility patterns on massive GPS data Luca Pappalardo, Salvatore Rinzivillo, Dino Pedreschi, and Fosca Giannotti KDDLab, Institute of Information Science and Technologies (ISTI),
EXPLORATORY SPATIAL DATA ANALYSIS OF BUILDING ENERGY IN URBAN ENVIRONMENTS. Food Machinery and Equipment, Tianjin , China
 EXPLORATORY SPATIAL DATA ANALYSIS OF BUILDING ENERGY IN URBAN ENVIRONMENTS Wei Tian 1,2, Lai Wei 1,2, Pieter de Wilde 3, Song Yang 1,2, QingXin Meng 1 1 College of Mechanical Engineering, Tianjin University
WEATHER IMPACT. on FLOATING CAR DATA
 WEATHER IMPACT on FLOATING CAR DATA Alexander Sohr Research Scientist, DLR Institute of Transportation Systems Rutherfordstr. 2, 12489 Berlin, Germany TEL +49 3 67 55 458, FAX +49 3 67 55 291, alexander.sohr@dlr.de
Cluster Analysis using SaTScan
 Cluster Analysis using SaTScan Summary 1. Statistical methods for spatial epidemiology 2. Cluster Detection What is a cluster? Few issues 3. Spatial and spatio-temporal Scan Statistic Methods Probability
Collection and Analyses of Crowd Travel Behaviour Data by using Smartphones
 Collection and Analyses of Crowd Travel Behaviour Data by using Smartphones Rik Bellens 1 Sven Vlassenroot 2 Sidharta Guatama 3 Abstract: In 2010 the MOVE project started in the collection and analysis
March Centre for Geo-Information. Thesis Report GIRS
 March 2011 Centre for Geo-Information Thesis Report GIRS-2011-07 Uncovering movement suspension patterns on GPS tracking data. Analysing the temporal dimension of movement suspension patterns on pedestrian
Regional Snapshot Series: Transportation and Transit. Commuting and Places of Work in the Fraser Valley Regional District
 Regional Snapshot Series: Transportation and Transit Commuting and Places of Work in the Fraser Valley Regional District TABLE OF CONTENTS Complete Communities Daily Trips Live/Work Ratio Commuting Local
Figure 8.2a Variation of suburban character, transit access and pedestrian accessibility by TAZ label in the study area
 Figure 8.2a Variation of suburban character, transit access and pedestrian accessibility by TAZ label in the study area Figure 8.2b Variation of suburban character, commercial residential balance and mix
Mapping and Analysis for Spatial Social Science
 Mapping and Analysis for Spatial Social Science Luc Anselin Spatial Analysis Laboratory Dept. Agricultural and Consumer Economics University of Illinois, Urbana-Champaign http://sal.agecon.uiuc.edu Outline
Tracey Farrigan Research Geographer USDA-Economic Research Service
 Rural Poverty Symposium Federal Reserve Bank of Atlanta December 2-3, 2013 Tracey Farrigan Research Geographer USDA-Economic Research Service Justification Increasing demand for sub-county analysis Policy
Understanding and Measuring Urban Expansion
 VOLUME 1: AREAS AND DENSITIES 21 CHAPTER 3 Understanding and Measuring Urban Expansion THE CLASSIFICATION OF SATELLITE IMAGERY The maps of the urban extent of cities in the global sample were created using
Mobility Analytics through Social and Personal Data. Pierre Senellart
 Mobility Analytics through Social and Personal Data Pierre Senellart Session: Big Data & Transport Business Convention on Big Data Université Paris-Saclay, 25 novembre 2015 Analyzing Transportation and
Exploring Urban Mobility from Taxi Trajectories: A Case Study of Nanjing, China
 Exploring Urban Mobility from Taxi Trajectories: A Case Study of Nanjing, China Yihong Yuan and Maël Le Noc Department of Geography, Texas State University, San Marcos, TX, U.S.A. {yuan, mael.lenoc}@txstate.edu
Travel behavior of low-income residents: Studying two contrasting locations in the city of Chennai, India
 Travel behavior of low-income residents: Studying two contrasting locations in the city of Chennai, India Sumeeta Srinivasan Peter Rogers TRB Annual Meet, Washington D.C. January 2003 Environmental Systems,
City monitoring with travel demand momentum vector fields: theoretical and empirical findings
 City monitoring with travel demand momentum vector fields: theoretical and empirical findings Xintao Liu 1, Joseph Y.J. Chow 2 1 Department of Civil Engineering, Ryerson University, Canada 2 Tandon School
Caesar s Taxi Prediction Services
 1 Caesar s Taxi Prediction Services Predicting NYC Taxi Fares, Trip Distance, and Activity Paul Jolly, Boxiao Pan, Varun Nambiar Abstract In this paper, we propose three models each predicting either taxi
Using spatial-temporal signatures to infer human activities from personal trajectories on location-enabled mobile devices
 Using spatial-temporal signatures to infer human activities from personal trajectories on location-enabled mobile devices Yingjie Hu 1, Wenwen Li 2, Krzysztof Janowicz 1, Kathleen Deutsch 1, Grant McKenzie
Understanding Activity Location Choice with Mobile Phone Data. Menglin Wang. A dissertation. submitted in partial fulfillment of the
 Understanding Activity Location Choice with Mobile Phone Data Menglin Wang A dissertation submitted in partial fulfillment of the requirements for the degree of Doctor of Philosophy University of Washington
Session 2477: The Role of Advanced Computational Tools in Visualizing Spatiotemporal Complexity
 2011 Annual AAG Meeting, Seattle, Washington. April 13, 2011 Session 2477: The Role of Advanced Computational Tools in Visualizing Spatiotemporal Complexity Visualizing and Analyzing the Spatiotemporal
The spatial network Streets and public spaces are the where people move, interact and transact
 The spatial network Streets and public spaces are the where people move, interact and transact The spatial network Cities are big spatial networks that create more of these opportunities Five key discoveries
Human Mobility Model Establishment with Hidden Markov Model
 Recent Researches in Information Science and Applications Human Mobility Model Establishment with Hidden Markov Model SEUNG HO RYU Hongik University Department of Computer Engineering 72-1, Sangsu, Mapo,
Exploring Urban Mobility from Taxi Trajectories: A Case Study of Nanjing, China
 Exploring Urban Mobility from Taxi Trajectories: A Case Study of Nanjing, China Yihong Yuan, Maël Le Noc Department of Geography, Texas State University,San Marcos, TX, USA {yuan, mael.lenoc}@ txstate.edu
NEW YORK DEPARTMENT OF SANITATION. Spatial Analysis of Complaints
 NEW YORK DEPARTMENT OF SANITATION Spatial Analysis of Complaints Spatial Information Design Lab Columbia University Graduate School of Architecture, Planning and Preservation November 2007 Title New York
Texas A&M University
 Texas A&M University CVEN 658 Civil Engineering Applications of GIS Hotspot Analysis of Highway Accident Spatial Pattern Based on Network Spatial Weights Instructor: Dr. Francisco Olivera Author: Zachry
Evaluation of urban mobility using surveillance cameras
 Procedia Computer Science Volume 66, 2015, Pages 364 371 YSC 2015. 4th International Young Scientists Conference on Computational Science Evaluation of urban mobility using surveillance cameras Alexey
Finding Hot Spots in ArcGIS Online: Minimizing the Subjectivity of Visual Analysis. Nicholas M. Giner Esri Parrish S.
 Finding Hot Spots in ArcGIS Online: Minimizing the Subjectivity of Visual Analysis Nicholas M. Giner Esri Parrish S. Henderson FBI Agenda The subjectivity of maps What is Hot Spot Analysis? Why do Hot
Exploring the Use of Urban Greenspace through Cellular Network Activity
 Exploring the Use of Urban Greenspace through Cellular Network Activity Ramón Cáceres 1, James Rowland 1, Christopher Small 2, and Simon Urbanek 1 1 AT&T Labs Research, Florham Park, NJ, USA {ramon,jrr,urbanek}@research.att.com
Understanding individual and collective mobility patterns from smart card records: A case study in Shenzhen
 Understanding individual and collective mobility patterns from smart card records: A case study in Shenzhen The MIT Faculty has made this article openly available. Please share how this access benefits
Bus Landscapes: Analyzing Commuting Pattern using Bus Smart Card Data in Beijing
 Bus Landscapes: Analyzing Commuting Pattern using Bus Smart Card Data in Beijing Ying Long, Beijing Institute of City Planning 龙瀛 Jean-Claude Thill, The University of North Carolina at Charlotte 1 INTRODUCTION
Mining Spatial Data in Human Health?
 What is Special about Mining Spatial Data in Human Health? Shashi Shekhar McKnight Distinguished University Professor Department of Computer Science and Engineering, University of Minnesota www.cs.umn.edu/~shekhar