Mapping and Analysis for Spatial Social Science
|
|
|
- Gary Walters
- 6 years ago
- Views:
Transcription
1 Mapping and Analysis for Spatial Social Science Luc Anselin Spatial Analysis Laboratory Dept. Agricultural and Consumer Economics University of Illinois, Urbana-Champaign
2 Outline Introduction Geovisualization Statistical Maps Map Smoothing Linking and Brushing Visualizing Spatial Autocorrelation Space-Time Correlation
3 Introduction
4 Spatial Models Growing Interest in Space, Spatiality and Spatial Interaction among Theoretical Social Sciences Overarching Concepts social interaction context, neighborhood effects interacting agents, strategic interaction spatial externalities, agglomeration geography as a proxy
5 Spatial Data Growing Interest in the use of Spatial Data in Empirical Social Science georeferenced data addresses, lat-lon (GPS survey) distance and accessibility measures access to infrastructure, spatial mismatch Role of GIS affordable and transparent spatial data manipulation
6 Geographic Information Systems GIS as a Set of Tools Burrough: set of tools for collecting, storing, retrieving at will, transforming and displaying spatial data from the real world for a particular set of purposes a GIS, GISes (= systems) GIS as Science (the new geography) Goodchild: Geographic Information Science generic scientific questions pertaining to geographic data central role of spatial analysis GIScience
7 What is Spatial Analysis From Data to Information beyond mapping: added value transformations, manipulations and application of analytical methods to spatial (geographic) data Lack of Locational Invariance analyses where the outcome changes when the location of the objects under study changes median center, clusters, spatial autocorrelation

8 spatial analysis avant la lettre Dr. Snow s map of cholera deaths in London
9 Components of Spatial Analysis Visualization Showing interesting patterns Exploratory Spatial Data Analysis Finding interesting patterns Spatial Modeling, Regression Explaining interesting patterns
10 Implementation of Spatial Analysis Beyond GIS Analytical functionality not part of typical commercial GIS Analytical extensions, DynESDA2 Exploration requires interactive approach Spatial modeling requires specialized statistical methods Explicit treatment of spatial autocorrelation Space-time is not space + time Methods of Geovisualization, ESDA and Spatial Regression Analysis
11 (Limited) Illustration of Techniques Geovisualization specialized maps ESDA dynamically linked windows Spatial Correlation Analysis global and local spatial autocorrelation space-time correlation
12 Geovisualization
13 Beyond Mapping Map a collection of spatially defined objects (Monmonier) Geovisualization combination of map and scientific visualization methods (computer science) exploit human s pattern recognition abilities How to lie with maps many design issues human perception can be tricked
14 Choropleth Maps Map Counterpart of Histogram values/attributes for discrete spatial units choro from choros (colors) NOT chloro Practical Issues choice of intervals equal interval, equal share (quantiles), standard deviational, choice of colors important for perception of patterns misleading role of area larger areas seem more important

15 Color Brewer
16 Cartograms Misleading Effect of Area large areal units draw attention Symbol Maps symbols (bars, circles) superimposed on actual areas Cartogram change the layout to reflect size other than area population size, variable magnitude respect topology (spatial arrangement)
17 Choropleth Map (Juvenile Crime VA)
18 Point Map

19 Thiessen Polygons

20 Contiguous Cartogram Nebraska county population -

21 Cartogram (GeoTools) Infant Mortality England and Wales, 1851
22 Isopleth Maps Map Counterpart of Density Plot values/attributes for continuous fields lines of equal value, contour lines 3-d surface plots Practical Issues choice of intervals spatial interpolation construct observations for locations that are not observed statistical problem = spatial prediction
 and")
23 Residential Sales Price, Baltimore MD (1980) sample points (darker is higher) and contours
24 Statistical Maps
25 Visualizing Spatial Distributions Spatialized EDA icons and glyphs matching locations special case of symbol maps Box Map outlier map visual popout, both magnitude and location Regional Box Plots spatial heterogeneity different distributions in spatial subsets

26 spatial lag bar chart blue = crime at i, red = spatial lag, average crime for neighbors
27 Spatialized EDA Spatial Chernoff Faces the burglar s view of crime clusters in Columbus


28 Box Map quartile map with outliers highlighted suicide rates in France (Durkheim 1897)

29 Linked Box Map in DynESDA2

30 Regional Histogram

31 Regional Box Plot Columbus crime: core vs periphery
32 Map Plots and Plot Maps Linked Micromap Plots - LM plots a micromap for each quantile micromaps linked to other statistical graphs Conditioned Choropleth Maps - cc maps choropleth maps on dependent variable micromap matrix conditioning along two dimensions

33 Linked Micromap Plots (Carr)

34 Conditioned Choropleth Map (Carr)
35 Map Smoothing
36 Mapping Events Events as Locations individual points point pattern analysis Events as Rates areal aggregates counts of events rate = # events / # population at risk raw rate is ML estimate of risk
37 Problems with Rate Maps Intrinsic Heterogeneity variance depends on mean variance depends on base Variance Instability spurious outliers Excess Risk is Non-Spatial does not account for spatial autocorrelation
38 Map Smoothing Empirical Bayes shrink rates to reference national average regional average = subset average Spatial Rate Smoother spatial moving average spatial range defined by spatial weights

39 Event and Base
40 Raw Rate Map

41 EB Smoothed Map

42 Spatial Rate Smoother

43 Regional EB Smoothing
44 Linking and Brushing
45 Linking Views different views of data statistical graphs: histogram, box plot, scatterplot map Table (list) Dynamic Linking views dynamically linked click on one view and corresponding observations (points, areas) on other views are highlighted

46 Linking Point and Polygon Maps

47 Dynamic Linking and Multimedia - panoramap
48 Brushing Brushing moving brush over map or graph highlights matching observations in other statistical graphs and vice versa Brushing Scatterplots recalculates slope of regression line Geographic Brushing simultaneous selecting on multiple maps

49 Selection in Scatterplot

50 Map Brushing in DynESDA2
51 Visualizing Spatial Autocorrelation
52 Random or Clustered?

53 Random or Clustered?
54 Moran s I Moran s I Spatial Autocorrelation Statistic cross-product statistic I = (N/S 0 ) Σ i Σ j w ij. z i.z j / Σ i z i 2 with z i = x i - µ and S 0 = Σ i Σ j w ij Inference normal distribution randomization permutation

55 Observed (left) and randomized (right) distribution for Columbus Crime Moran s I = Moran s I =
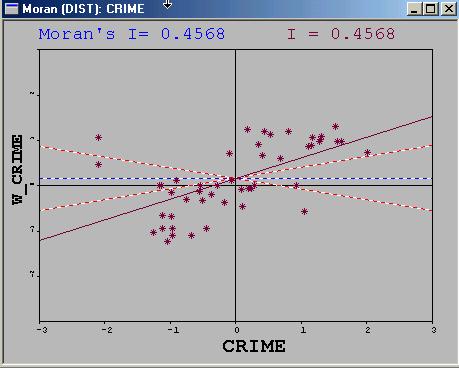
56 Moran Scatterplot Linear Spatial Autocorrelation linear association between value at i and weighted average of neighbors: Σ j w ij y j vs. y i, or Wy vs y four quadrants high-high, low-low = spatial clusters high-low, low-high = spatial outliers Moran s I slope of linear scatterplot smoother I = z Wz / z z
57 Significance Envelope

58 Reference Distribution (CRIME)
59 Use of Moran Scatterplot Classification of Spatial Autocorrelation Local Nonstationarity outliers high leverage points sensitivity to boundary values Regimes different slopes in subsets of the data

60 Moran Scatterplot Map for Columbus crime four quadrants of the scatterplot (not significant )

61 Moran Scatterplot - Regimes
62 Local Moran Local Moran Statistic I i = (z i / m 2 )Σ j w ij.z j Σ i I i = N.I Inference randomization assumption conditional permutation local dependence or heterogeneity? Visualization LISA map and Moran Significance Map
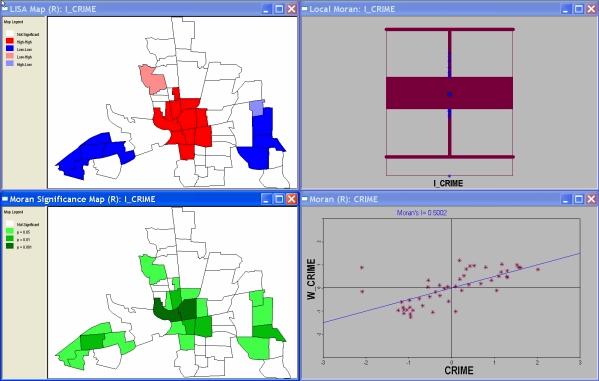
63 LISA MAPS
64 Space-Time Correlation
65 Space-Time Moran Scatterplot Generalized Moran Scatterplot Regression slope of Wz t on z t-1 both variables standardized = visualization of Wartenberg multivariate Moran statistic Significance testing permutation permutation envelope (2.5% and 97.5% from permutation reference distribution) Four Types of Association High-high, Low-low; High-low, Low-high

66 Space-Time Moran Scatterplot p = p = 0.002

67 Moran Scatterplot Matrix
68 Generalized LISA Generalization of Local Moran z 1i x Σ j w ij z 2j z 1 and z 2 different variables same variable at different times Inference Null hypothesis random assignment between value of z 1 at i, t and neighboring values of z 2
69 Space-Time Patterns Space-Time Cluster = Contagion High (above avg) values at a location surrounded by High values at different time compare to high-high same time Similar for Low-Low Space-Time Outlier = Change High (above avg) surrounded by Low (below avg) at different time Similar for Low-High Significance based on permutation
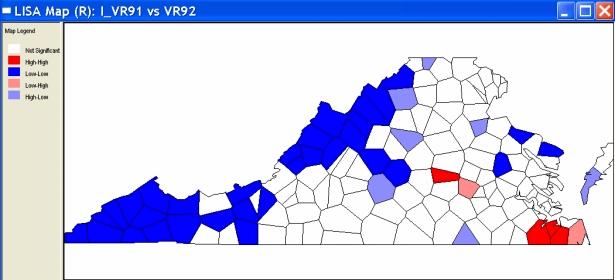
70 Space-Time LISA Maps
71 Interpretation and Limitations Most Important assessing lack of spatial randomness suggests significant spatial structure Multivariate Association univariate spatial autocorrelation may result from multivariate association scale mismatch need to control for other variables = spatial regression LISA Clusters and Hot Spots suggest interesting locations do not explain
72
Luc Anselin Spatial Analysis Laboratory Dept. Agricultural and Consumer Economics University of Illinois, Urbana-Champaign
 GIS and Spatial Analysis Luc Anselin Spatial Analysis Laboratory Dept. Agricultural and Consumer Economics University of Illinois, Urbana-Champaign http://sal.agecon.uiuc.edu Outline GIS and Spatial Analysis
Outline ESDA. Exploratory Spatial Data Analysis ESDA. Luc Anselin
 Exploratory Spatial Data Analysis ESDA Luc Anselin University of Illinois, Urbana-Champaign http://www.spacestat.com Outline ESDA Exploring Spatial Patterns Global Spatial Autocorrelation Local Spatial
Geovisualization. Luc Anselin. Copyright 2016 by Luc Anselin, All Rights Reserved
 Geovisualization Luc Anselin http://spatial.uchicago.edu from EDA to ESDA from mapping to geovisualization mapping basics multivariate EDA primer From EDA to ESDA Exploratory Data Analysis (EDA) reaction
Rate Maps and Smoothing
 Rate Maps and Smoothing Luc Anselin Spatial Analysis Laboratory Dept. Agricultural and Consumer Economics University of Illinois, Urbana-Champaign http://sal.agecon.uiuc.edu Outline Mapping Rates Risk
Lecture 3: Exploratory Spatial Data Analysis (ESDA) Prof. Eduardo A. Haddad
 Prof. Eduardo A. Haddad") Lecture 3: Exploratory Spatial Data Analysis (ESDA) Prof. Eduardo A. Haddad Key message Spatial dependence First Law of Geography (Waldo Tobler): Everything is related to everything else, but near things
Lecture 3: Exploratory Spatial Data Analysis (ESDA) Prof. Eduardo A. Haddad Key message Spatial dependence First Law of Geography (Waldo Tobler): Everything is related to everything else, but near things
Exploratory Spatial Data Analysis Using GeoDA: : An Introduction
 Exploratory Spatial Data Analysis Using GeoDA: : An Introduction Prepared by Professor Ravi K. Sharma, University of Pittsburgh Modified for NBDPN 2007 Conference Presentation by Professor Russell S. Kirby,
Exploratory Spatial Data Analysis and GeoDa
 Exploratory Spatial Data Analysis and GeoDa Luc Anselin Spatial Analysis Laboratory Dept. Agricultural and Consumer Economics University of Illinois, Urbana-Champaign http://sal.agecon.uiuc.edu Outline
Exploratory Spatial Data Analysis (And Navigating GeoDa)
") Exploratory Spatial Data Analysis (And Navigating GeoDa) June 9, 2006 Stephen A. Matthews Associate Professor of Sociology & Anthropology, Geography and Demography Director of the Geographic Information
Exploratory Spatial Data Analysis (And Navigating GeoDa) June 9, 2006 Stephen A. Matthews Associate Professor of Sociology & Anthropology, Geography and Demography Director of the Geographic Information
OPEN GEODA WORKSHOP / CRASH COURSE FACILITATED BY M. KOLAK
 OPEN GEODA WORKSHOP / CRASH COURSE FACILITATED BY M. KOLAK WHAT IS GEODA? Software program that serves as an introduction to spatial data analysis Free Open Source Source code is available under GNU license
KAAF- GE_Notes GIS APPLICATIONS LECTURE 3
 GIS APPLICATIONS LECTURE 3 SPATIAL AUTOCORRELATION. First law of geography: everything is related to everything else, but near things are more related than distant things Waldo Tobler Check who is sitting
Soc/Anth 597 Spatial Demography March 14, GeoDa 0.95i Exercise A. Stephen A. Matthews. Outline. 1. Background
 Soc/Anth 597 Spatial Demography March 14, 2006 GeoDa 0.95i Exercise A Stephen A. Matthews Outline 1. Background 2. Data set introduced (GDANEPAL.SHP) 3. GeoDa introduced Task 1: Start GeoDa Task 2: Open
Local Spatial Autocorrelation Clusters
 Local Spatial Autocorrelation Clusters Luc Anselin http://spatial.uchicago.edu LISA principle local Moran local G statistics issues and interpretation LISA Principle Clustering vs Clusters global spatial
Kriging Luc Anselin, All Rights Reserved
 Kriging Luc Anselin Spatial Analysis Laboratory Dept. Agricultural and Consumer Economics University of Illinois, Urbana-Champaign http://sal.agecon.uiuc.edu Outline Principles Kriging Models Spatial Interpolation
Spatial Autocorrelation (2) Spatial Weights
 Spatial Weights") Spatial Autocorrelation (2) Spatial Weights Luc Anselin Spatial Analysis Laboratory Dept. Agricultural and Consumer Economics University of Illinois, Urbana-Champaign http://sal.agecon.uiuc.edu Outline
Spatial Autocorrelation (2) Spatial Weights Luc Anselin Spatial Analysis Laboratory Dept. Agricultural and Consumer Economics University of Illinois, Urbana-Champaign http://sal.agecon.uiuc.edu Outline
Outline. Introduction to SpaceStat and ESTDA. ESTDA & SpaceStat. Learning Objectives. Space-Time Intelligence System. Space-Time Intelligence System
 Outline I Data Preparation Introduction to SpaceStat and ESTDA II Introduction to ESTDA and SpaceStat III Introduction to time-dynamic regression ESTDA ESTDA & SpaceStat Learning Objectives Activities
Spatial Tools for Econometric and Exploratory Analysis
 Spatial Tools for Econometric and Exploratory Analysis Michael F. Goodchild University of California, Santa Barbara Luc Anselin University of Illinois at Urbana-Champaign http://csiss.org Outline A Quick
Spatial Regression. 1. Introduction and Review. Luc Anselin. Copyright 2017 by Luc Anselin, All Rights Reserved
 Spatial Regression 1. Introduction and Review Luc Anselin http://spatial.uchicago.edu matrix algebra basics spatial econometrics - definitions pitfalls of spatial analysis spatial autocorrelation spatial
Introduction to Spatial Statistics and Modeling for Regional Analysis
 Introduction to Spatial Statistics and Modeling for Regional Analysis Dr. Xinyue Ye, Assistant Professor Center for Regional Development (Department of Commerce EDA University Center) & School of Earth,
EXPLORATORY SPATIAL DATA ANALYSIS OF BUILDING ENERGY IN URBAN ENVIRONMENTS. Food Machinery and Equipment, Tianjin , China
 EXPLORATORY SPATIAL DATA ANALYSIS OF BUILDING ENERGY IN URBAN ENVIRONMENTS Wei Tian 1,2, Lai Wei 1,2, Pieter de Wilde 3, Song Yang 1,2, QingXin Meng 1 1 College of Mechanical Engineering, Tianjin University
Spatial Data, Spatial Analysis and Spatial Data Science
 Spatial Data, Spatial Analysis and Spatial Data Science Luc Anselin http://spatial.uchicago.edu 1 spatial thinking in the social sciences spatial analysis spatial data science spatial data types and research
Exploratory Spatial Data Analysis (ESDA)
") Exploratory Spatial Data Analysis (ESDA) VANGHR s method of ESDA follows a typical geospatial framework of selecting variables, exploring spatial patterns, and regression analysis. The primary software
Exploratory Spatial Data Analysis (ESDA) VANGHR s method of ESDA follows a typical geospatial framework of selecting variables, exploring spatial patterns, and regression analysis. The primary software
Spatial Clusters of Rates
 Spatial Clusters of Rates Luc Anselin http://spatial.uchicago.edu concepts EBI local Moran scan statistics Concepts Rates as Risk from counts (spatially extensive) to rates (spatially intensive) rate =
Introduction GeoXp : an R package for interactive exploratory spatial data analysis. Illustration with a data set of schools in Midi-Pyrénées.
 Presentation of Presentation of Use of Introduction : an R package for interactive exploratory spatial data analysis. Illustration with a data set of schools in Midi-Pyrénées. Authors of : Christine Thomas-Agnan,
SASI Spatial Analysis SSC Meeting Aug 2010 Habitat Document 5
 OBJECTIVES The objectives of the SASI Spatial Analysis were to (1) explore the spatial structure of the asymptotic area swept (z ), (2) define clusters of high and low z for each gear type, (3) determine
Measures of Spatial Dependence
 Measures of Spatial Dependence Carlos Hurtado Department of Economics University of Illinois at Urbana-Champaign hrtdmrt2@illinois.edu Junel 30th, 2016 C. Hurtado (UIUC - Economics) Spatial Econometrics
Finding Hot Spots in ArcGIS Online: Minimizing the Subjectivity of Visual Analysis. Nicholas M. Giner Esri Parrish S.
 Finding Hot Spots in ArcGIS Online: Minimizing the Subjectivity of Visual Analysis Nicholas M. Giner Esri Parrish S. Henderson FBI Agenda The subjectivity of maps What is Hot Spot Analysis? Why do Hot
Attribute Data. ArcGIS reads DBF extensions. Data in any statistical software format can be
 This hands on application is intended to introduce you to the foundational methods of spatial data analysis available in GeoDa. We will undertake an exploratory spatial data analysis, of 1,387 southern
Spatial Analysis I. Spatial data analysis Spatial analysis and inference
 Spatial Analysis I Spatial data analysis Spatial analysis and inference Roadmap Outline: What is spatial analysis? Spatial Joins Step 1: Analysis of attributes Step 2: Preparing for analyses: working with
Geographical Information Systems Institute. Center for Geographic Analysis, Harvard University. GeoDa: Spatial Autocorrelation
 Geographical Information Systems Institute, A. Background From geodacenter.asu.edu: GeoDa is a free software program that serves as an introduction to spatial data analysis. OpenGeoDa is the cross-platform,
GIS Test Drive What a Geographic Information System Is and What it Can Do. Alison Davis-Holland
 GIS Test Drive What a Geographic Information System Is and What it Can Do Alison Davis-Holland adavisholland@gmail.com WHO AM I? Geospatial Analyst M.S. in Geographic and Cartographic Sciences Use GIS
Geometric Algorithms in GIS
 Geometric Algorithms in GIS GIS Software Dr. M. Gavrilova GIS System What is a GIS system? A system containing spatially referenced data that can be analyzed and converted to new information for a specific
Spatial Autocorrelation
 Spatial Autocorrelation Luc Anselin http://spatial.uchicago.edu spatial randomness positive and negative spatial autocorrelation spatial autocorrelation statistics spatial weights Spatial Randomness The
SPACE Workshop NSF NCGIA CSISS UCGIS SDSU. Aldstadt, Getis, Jankowski, Rey, Weeks SDSU F. Goodchild, M. Goodchild, Janelle, Rebich UCSB
 SPACE Workshop NSF NCGIA CSISS UCGIS SDSU Aldstadt, Getis, Jankowski, Rey, Weeks SDSU F. Goodchild, M. Goodchild, Janelle, Rebich UCSB August 2-8, 2004 San Diego State University Some Examples of Spatial
Lecture 4. Spatial Statistics
 Lecture 4 Spatial Statistics Lecture 4 Outline Statistics in GIS Spatial Metrics Cell Statistics Neighborhood Functions Neighborhood and Zonal Statistics Mapping Density (Density surfaces) Hot Spot Analysis
Global Spatial Autocorrelation Clustering
 Global Spatial Autocorrelation Clustering Luc Anselin http://spatial.uchicago.edu join count statistics Moran s I Moran scatter plot non-parametric spatial autocorrelation Join Count Statistics Recap -
Intro to GIS Summer 2012 Data Visualization
 Intro to GIS Summer 2012 Data Visualization UNDERSTANDING YOUR MAP DATA Qualitative vs. Quantitative Data Qualitative Data classified by category e.g. Soil types, Animal Species Quantitative Data grouped
The GeoDa Book. Exploring Spatial Data. Luc Anselin
 The GeoDa Book Exploring Spatial Data Luc Anselin Copyright 2017 by GeoDa Press LLC All rights reserved. ISBN: 0-9863421-2-2 ISBN-13: 978-0-9863421-2-7 GeoDa Press LLC, Chicago, IL GeoDa TM is a trade
Comparing Color and Leader Line Approaches for Highlighting in Geovisualization
 Comparing Color and Leader Line Approaches for Highlighting in Geovisualization A. L. Griffin 1, A. C. Robinson 2 1 School of Physical, Environmental, and Mathematical Sciences, University of New South
The Nature of Geographic Data
 4 The Nature of Geographic Data OVERVIEW Elaborates on the spatial is special theme Focuses on how phenomena vary across space and the general nature of geographic variation Describes the main principles
Concepts and Applications of Kriging. Eric Krause Konstantin Krivoruchko
 Concepts and Applications of Kriging Eric Krause Konstantin Krivoruchko Outline Introduction to interpolation Exploratory spatial data analysis (ESDA) Using the Geostatistical Wizard Validating interpolation
Web-Based Analytical Tools for the Exploration of Spatial Data
 Web-Based Analytical Tools for the Exploration of Spatial Data Luc Anselin, Yong Wook Kim and Ibnu Syabri Spatial Analysis Laboratory Department of Agricultural and Consumer Economics University of Illinois,
GIS and Spatial Statistics: One World View or Two? Michael F. Goodchild University of California Santa Barbara
 GIS and Spatial Statistics: One World View or Two? Michael F. Goodchild University of California Santa Barbara Location as attribute The data table Census summary table What value is location as an explanatory
VISUALIZING MULTIVARIATE SPATIAL CORRELATION WITH DYNAMICALLY LINKED WINDOWS
 The Regional Economics Applications Laboratory (REAL) is a cooperative venture between the University of Illinois and the Federal Reserve Bank of Chicago focusing on the development and use of analytical
Introduction to Statistics
 Introduction to Statistics Data and Statistics Data consists of information coming from observations, counts, measurements, or responses. Statistics is the science of collecting, organizing, analyzing,
Spatial Analysis 1. Introduction
 Spatial Analysis 1 Introduction Geo-referenced Data (not any data) x, y coordinates (e.g., lat., long.) ------------------------------------------------------ - Table of Data: Obs. # x y Variables -------------------------------------
A Local Indicator of Multivariate Spatial Association: Extending Geary s c.
 A Local Indicator of Multivariate Spatial Association: Extending Geary s c. Luc Anselin Center for Spatial Data Science University of Chicago anselin@uchicago.edu November 9, 2017 This research was funded
Concepts and Applications of Kriging. Eric Krause
 Concepts and Applications of Kriging Eric Krause Sessions of note Tuesday ArcGIS Geostatistical Analyst - An Introduction 8:30-9:45 Room 14 A Concepts and Applications of Kriging 10:15-11:30 Room 15 A
Exploratory Spatial Data Analysis of Regional Economic Disparities in Beijing during the Preparation Period of the 2008 Olympic Games
 Exploratory Spatial Data Analysis of Regional Economic Disparities in Beijing during the Preparation Period of the 2008 Olympic Games Xiaoyi Ma, Tao Pei Thursday, May 27, 2010 The State Key Laboratory
GEOGRAPHY 350/550 Final Exam Fall 2005 NAME:
 1) A GIS data model using an array of cells to store spatial data is termed: a) Topology b) Vector c) Object d) Raster 2) Metadata a) Usually includes map projection, scale, data types and origin, resolution
Geographical Information Systems Institute. Center for Geographic Analysis, Harvard University. GeoDa: Exploratory Spatial Data Analysis
 Geographical Information Systems Institute, A. Background GeoDa: Exploratory Spatial Data Analysis From geodacenter.asu.edu: GeoDa is a free software program that serves as an introduction to spatial data
Spatial correlation and demography.
 Spatial correlation and demography. Sébastien Oliveau, Christophe Guilmoto To cite this version: Sébastien Oliveau, Christophe Guilmoto. Spatial correlation and demography.: Exploring India s demographic
Lecture 5 Geostatistics
 Lecture 5 Geostatistics Lecture Outline Spatial Estimation Spatial Interpolation Spatial Prediction Sampling Spatial Interpolation Methods Spatial Prediction Methods Interpolating Raster Surfaces with
Tracey Farrigan Research Geographer USDA-Economic Research Service
 Rural Poverty Symposium Federal Reserve Bank of Atlanta December 2-3, 2013 Tracey Farrigan Research Geographer USDA-Economic Research Service Justification Increasing demand for sub-county analysis Policy
Michael Harrigan Office hours: Fridays 2:00-4:00pm Holden Hall
 Announcement New Teaching Assistant Michael Harrigan Office hours: Fridays 2:00-4:00pm Holden Hall 209 Email: michael.harrigan@ttu.edu Guofeng Cao, Texas Tech GIST4302/5302, Lecture 2: Review of Map Projection
CSISS Tools and Spatial Analysis Software
 CSISS Tools and Spatial Analysis Software June 5, 2006 Stephen A. Matthews Associate Professor of Sociology & Anthropology, Geography and Demography Director of the Geographic Information Analysis Core
GIS Spatial Statistics for Public Opinion Survey Response Rates
 GIS Spatial Statistics for Public Opinion Survey Response Rates July 22, 2015 Timothy Michalowski Senior Statistical GIS Analyst Abt SRBI - New York, NY t.michalowski@srbi.com www.srbi.com Introduction
CS : Spatial Data Modeling and Analysis. Geovisualization
 CS260-002: Spatial Data Modeling and Analysis Geovisualization Visual Perception Learning Styles & Personality Types: Visual, Auditory, Kinesthetic Cholera cases in the London epidemic of 1854 Cholera
Spatial Regression. 10. Specification Tests (2) Luc Anselin. Copyright 2017 by Luc Anselin, All Rights Reserved
 Luc Anselin. Copyright 2017 by Luc Anselin, All Rights Reserved") Spatial Regression 10. Specification Tests (2) Luc Anselin http://spatial.uchicago.edu 1 robust LM tests higher order tests 2SLS residuals specification search 2 Robust LM Tests 3 Recap and Notation LM-Error
Spatial Regression 10. Specification Tests (2) Luc Anselin http://spatial.uchicago.edu 1 robust LM tests higher order tests 2SLS residuals specification search 2 Robust LM Tests 3 Recap and Notation LM-Error
The role of topological outliers in the spatial analysis of georeferenced social media data
 06 April 2017 The role of topological outliers in the spatial analysis of georeferenced social media data René Westerholt, Heidelberg University Seminar on Spatial urban analytics: big data, methodologies,
Geographic Data Science - Lecture IV
 Geographic Data Science - Lecture IV Mapping Data Dani Arribas-Bel Today Mapping data MAUP Choropleths Definition Classes Cartograms Conditional maps Space-Time mapping Data maps Abstraction from the purely
Construction Engineering. Research Laboratory. Approaches Towards the Identification of Patterns in Violent Events, Baghdad, Iraq ERDC/CERL CR-09-1
 ERDC/CERL CR-09-1 Approaches Towards the Identification of Patterns in Violent Events, Baghdad, Iraq Luc Anselin and Gianfranco Piras May 2009 Construction Engineering Research Laboratory Approved for
Finding Hot Spots in ArcGIS Online: Minimizing the Subjectivity of Visual Analysis. Nicholas M. Giner Esri Parrish S.
 Finding Hot Spots in ArcGIS Online: Minimizing the Subjectivity of Visual Analysis Nicholas M. Giner Esri Parrish S. Henderson - FBI Agenda The subjectivity of maps What is Hot Spot Analysis? What is Outlier
Final Project: An Income and Education Study of Washington D.C.
 Final Project: An Income and Education Study of Washington D.C. Barbara J. McKay Archibald Geography 586 Dr. Justine Blanford 12 December, 2009 As the seat of the United States Federal Government, Washington
Concepts and Applications of Kriging
 Esri International User Conference San Diego, California Technical Workshops July 24, 2012 Concepts and Applications of Kriging Konstantin Krivoruchko Eric Krause Outline Intro to interpolation Exploratory
Models to carry out inference vs. Models to mimic (spatio-temporal) systems 5/5/15
 systems 5/5/15") Models to carry out inference vs. Models to mimic (spatio-temporal) systems 5/5/15 Ring-Shaped Hotspot Detection: A Summary of Results, IEEE ICDM 2014 (w/ E. Eftelioglu et al.) Where is a crime source?
Models to carry out inference vs. Models to mimic (spatio-temporal) systems 5/5/15 Ring-Shaped Hotspot Detection: A Summary of Results, IEEE ICDM 2014 (w/ E. Eftelioglu et al.) Where is a crime source?
Geog183: Cartographic Design and Geovisualization Winter Quarter 2017 Lecture 6: Map types and Data types
 Geog183: Cartographic Design and Geovisualization Winter Quarter 2017 Lecture 6: Map types and Data types Data types Data dimension: Point, Line, Area, Volume (Text) Data continuity: Discrete, Point, Polygon:
The Case for Space in the Social Sciences
 The Case for Space in the Social Sciences Don Janelle Center for Spatially Integrated Social Science University of California, Santa Barbara Roundtable on Geographical Voices and Geographical Analysis
GIST 4302/5302: Spatial Analysis and Modeling
 GIST 4302/5302: Spatial Analysis and Modeling Lecture 2: Review of Map Projections and Intro to Spatial Analysis Guofeng Cao http://thestarlab.github.io Department of Geosciences Texas Tech University
The Use of Spatial Weights Matrices and the Effect of Geometry and Geographical Scale
 The Use of Spatial Weights Matrices and the Effect of Geometry and Geographical Scale António Manuel RODRIGUES 1, José António TENEDÓRIO 2 1 Research fellow, e-geo Centre for Geography and Regional Planning,
The Implementation of Autocorrelation-Based Regioclassification in ArcMap Using ArcObjects
 140 The Implementation of Autocorrelation-Based Regioclassification in ArcMap Using ArcObjects Christoph MAYRHOFER Abstract Conventional methods for cartographic classification are often solely based on
AIM HIGH SCHOOL. Curriculum Map W. 12 Mile Road Farmington Hills, MI (248)
") AIM HIGH SCHOOL Curriculum Map 2923 W. 12 Mile Road Farmington Hills, MI 48334 (248) 702-6922 www.aimhighschool.com COURSE TITLE: Statistics DESCRIPTION OF COURSE: PREREQUISITES: Algebra 2 Students will
AIM HIGH SCHOOL Curriculum Map 2923 W. 12 Mile Road Farmington Hills, MI 48334 (248) 702-6922 www.aimhighschool.com COURSE TITLE: Statistics DESCRIPTION OF COURSE: PREREQUISITES: Algebra 2 Students will
Points. Luc Anselin. Copyright 2017 by Luc Anselin, All Rights Reserved
 Points Luc Anselin http://spatial.uchicago.edu 1 classic point pattern analysis spatial randomness intensity distance-based statistics points on networks 2 Classic Point Pattern Analysis 3 Classic Examples
Where Do Overweight Women In Ghana Live? Answers From Exploratory Spatial Data Analysis
 Where Do Overweight Women In Ghana Live? Answers From Exploratory Spatial Data Analysis Abstract Recent findings in the health literature indicate that health outcomes including low birth weight, obesity
Concepts and Applications of Kriging
 2013 Esri International User Conference July 8 12, 2013 San Diego, California Technical Workshop Concepts and Applications of Kriging Eric Krause Konstantin Krivoruchko Outline Intro to interpolation Exploratory
Spatial Trends of unpaid caregiving in Ireland
 Spatial Trends of unpaid caregiving in Ireland Stamatis Kalogirou 1,*, Ronan Foley 2 1. NCG Affiliate, Thoukididi 20, Drama, 66100, Greece; Tel: +30 6977 476776; Email: skalogirou@gmail.com; Web: http://www.gisc.gr.
Overview of Statistical Analysis of Spatial Data
 Overview of Statistical Analysis of Spatial Data Geog 2C Introduction to Spatial Data Analysis Phaedon C. Kyriakidis www.geog.ucsb.edu/ phaedon Department of Geography University of California Santa Barbara
STARS: Space-Time Analysis of Regional Systems
 STARS: Space-Time Analysis of Regional Systems Sergio J. Rey Mark V. Janikas April 27, 2004 Abstract Space-Time Analysis of Regional Systems (STARS) is an open source package designed for dynamic exploratory
Glossary. The ISI glossary of statistical terms provides definitions in a number of different languages:
 Glossary The ISI glossary of statistical terms provides definitions in a number of different languages: http://isi.cbs.nl/glossary/index.htm Adjusted r 2 Adjusted R squared measures the proportion of the
GIST 4302/5302: Spatial Analysis and Modeling Lecture 2: Review of Map Projections and Intro to Spatial Analysis
 GIST 4302/5302: Spatial Analysis and Modeling Lecture 2: Review of Map Projections and Intro to Spatial Analysis Guofeng Cao http://www.spatial.ttu.edu Department of Geosciences Texas Tech University guofeng.cao@ttu.edu
Identification of Regional Subcenters Using Spatial Data Analysis for Estimating Traffic Volume
 Identification of Regional Subcenters Using Spatial Data Analysis for Estimating Traffic Volume Fang Zhao and Nokil Park Lehman Center for Transportation Research Department of Civil & Env.. Engineering
Sociology 6Z03 Review I
 Sociology 6Z03 Review I John Fox McMaster University Fall 2016 John Fox (McMaster University) Sociology 6Z03 Review I Fall 2016 1 / 19 Outline: Review I Introduction Displaying Distributions Describing
Spatial autocorrelation: robustness of measures and tests
 Spatial autocorrelation: robustness of measures and tests Marie Ernst and Gentiane Haesbroeck University of Liege London, December 14, 2015 Spatial Data Spatial data : geographical positions non spatial
Development of Integrated Spatial Analysis System Using Open Sources. Hisaji Ono. Yuji Murayama
 Development of Integrated Spatial Analysis System Using Open Sources Hisaji Ono PASCO Corporation 1-1-2, Higashiyama, Meguro-ku, TOKYO, JAPAN; Telephone: +81 (03)3421 5846 FAX: +81 (03)3421 5846 Email:
Spatial Pattern Analysis: Mapping Trends and Clusters. Lauren M. Scott, PhD Lauren Rosenshein Bennett, MS
 Spatial Pattern Analysis: Mapping Trends and Clusters Lauren M. Scott, PhD Lauren Rosenshein Bennett, MS Presentation Outline Spatial statistics overview Describing spatial patterns Quantifying spatial
EXPLORATORY SPATIAL DATA ANALYSIS IN A GEOCOMPUTATIONAL ENVIRONMENT
 EXPLORATORY SPATIAL DATA ANALYSIS IN A GEOCOMPUTATIONAL ENVIRONMENT Luc Anselin Regional Research Institute and Department of Economics West Virginia University P.O. Box 6825 Morgantown, WV 26506 lanselin@wvu.edu
Aggregated cancer incidence data: spatial models
 Aggregated cancer incidence data: spatial models 5 ième Forum du Cancéropôle Grand-est - November 2, 2011 Erik A. Sauleau Department of Biostatistics - Faculty of Medicine University of Strasbourg ea.sauleau@unistra.fr
Intensity Analysis of Spatial Point Patterns Geog 210C Introduction to Spatial Data Analysis
 Intensity Analysis of Spatial Point Patterns Geog 210C Introduction to Spatial Data Analysis Chris Funk Lecture 4 Spatial Point Patterns Definition Set of point locations with recorded events" within study
Spatial Analysis II. Spatial data analysis Spatial analysis and inference
 Spatial Analysis II Spatial data analysis Spatial analysis and inference Roadmap Spatial Analysis I Outline: What is spatial analysis? Spatial Joins Step 1: Analysis of attributes Step 2: Preparing for
What s special about spatial data?
 What s special about spatial data? Road map Geographic Information analysis The need to develop spatial thinking Some fundamental geographic concepts (PBCS) What are the effects of space? Spatial autocorrelation
Spatial Analysis 2. Spatial Autocorrelation
 Spatial Analysis 2 Spatial Autocorrelation Spatial Autocorrelation a relationship between nearby spatial units of the same variable If, for every pair of subareas i and j in the study region, the drawings
Contents. 9. Fractional and Quadratic Equations 2 Example Example Example
 Contents 9. Fractional and Quadratic Equations 2 Example 9.52................................ 2 Example 9.54................................ 3 Example 9.55................................ 4 1 Peterson,
Why Is It There? Attribute Data Describe with statistics Analyze with hypothesis testing Spatial Data Describe with maps Analyze with spatial analysis
 6 Why Is It There? Why Is It There? Getting Started with Geographic Information Systems Chapter 6 6.1 Describing Attributes 6.2 Statistical Analysis 6.3 Spatial Description 6.4 Spatial Analysis 6.5 Searching
Quantitative Methods Chapter 0: Review of Basic Concepts 0.1 Business Applications (II) 0.2 Business Applications (III)
 0.2 Business Applications (III)") Quantitative Methods Chapter 0: Review of Basic Concepts 0.1 Business Applications (II) 0.1.1 Simple Interest 0.2 Business Applications (III) 0.2.1 Expenses Involved in Buying a Car 0.2.2 Expenses Involved
Quantitative Methods Chapter 0: Review of Basic Concepts 0.1 Business Applications (II) 0.1.1 Simple Interest 0.2 Business Applications (III) 0.2.1 Expenses Involved in Buying a Car 0.2.2 Expenses Involved
Spatial Data Mining. Regression and Classification Techniques
 Spatial Data Mining Regression and Classification Techniques 1 Spatial Regression and Classisfication Discrete class labels (left) vs. continues quantities (right) measured at locations (2D for geographic
I L L I N O I S UNIVERSITY OF ILLINOIS AT URBANA-CHAMPAIGN
 Introduction Edps/Psych/Stat/ 584 Applied Multivariate Statistics Carolyn J Anderson Department of Educational Psychology I L L I N O I S UNIVERSITY OF ILLINOIS AT URBANA-CHAMPAIGN c Board of Trustees,
DIFFERENT INFLUENCES OF SOCIOECONOMIC FACTORS ON THE HUNTING AND FISHING LICENSE SALES IN COOK COUNTY, IL
 DIFFERENT INFLUENCES OF SOCIOECONOMIC FACTORS ON THE HUNTING AND FISHING LICENSE SALES IN COOK COUNTY, IL Xiaohan Zhang and Craig Miller Illinois Natural History Survey University of Illinois at Urbana
This lab exercise will try to answer these questions using spatial statistics in a geographic information system (GIS) context.
 context.") by Introduction Problem Do the patterns of forest fires change over time? Do forest fires occur in clusters, and do the clusters change over time? Is this information useful in fighting forest fires? This
by Introduction Problem Do the patterns of forest fires change over time? Do forest fires occur in clusters, and do the clusters change over time? Is this information useful in fighting forest fires? This
Overview key concepts and terms (based on the textbook Chang 2006 and the practical manual)
") Introduction Geo-information Science (GRS-10306) Overview key concepts and terms (based on the textbook 2006 and the practical manual) Introduction Chapter 1 Geographic information system (GIS) Geographically
Introduction Geo-information Science (GRS-10306) Overview key concepts and terms (based on the textbook 2006 and the practical manual) Introduction Chapter 1 Geographic information system (GIS) Geographically
Where to Invest Affordable Housing Dollars in Polk County?: A Spatial Analysis of Opportunity Areas
 Resilient Neighborhoods Technical Reports and White Papers Resilient Neighborhoods Initiative 6-2014 Where to Invest Affordable Housing Dollars in Polk County?: A Spatial Analysis of Opportunity Areas