Regional Snapshot Series: Transportation and Transit. Commuting and Places of Work in the Fraser Valley Regional District
|
|
|
- Bertha Williams
- 5 years ago
- Views:
Transcription

1 Regional Snapshot Series: Transportation and Transit Commuting and Places of Work in the Fraser Valley Regional District
2

3 TABLE OF CONTENTS Complete Communities Daily Trips Live/Work Ratio Commuting Local Trips Regional Trips The Regional Snapshot Series for the Fraser Valley Regional District is designed to provide the public with greater insight into the forces which are shaping growth and change in the region today. For a full list of documents currently available in the series, please visit us on the web at:

4 CHOICES FOR OUR FUTURE: our regional growth strategy Transportation and increasingly transit are an important part of daily life in the Fraser Valley Regional District. Choices for Our Future, the FVRD s regional growth strategy adopted in 2004, supports the development of a network of sustainable communities where residents can live and work in the same community and region. It also seeks to promote greater transportation choice and reduce automobile dependency by encouraging pedestrian and bicycle infrastructure, as well as a broader range of transit services. COMPLETE COMMUNITIES WHERE WE CAN LIVE, WORK, AND PLAY A network of sustainable communities The Fraser Valley Regional District (FVRD) is comprised of six member municipalities and seven electoral areas and features a variety of diverse landscapes, from small rural villages to the fifth largest city in British Columbia. Recognizing that the region s large land base presents a number of transportation challenges, the regional growth strategy promotes the development of a network of sustainable communities with strong social, economic, and environmental linkages, while at the same time encouraging local self-sufficiency. This is the foundation for building complete communities that provide residents with local jobs and services that are accessible to everyone through a wide range of transportation choices. Building complete communities that provide residents with jobs and services close to where they live can improve accessibility to employment opportunities, reduce the number of commuters on the roads, and help reduce vehicle congestion, air pollution, and greenhouse gas emissions. In addition, local jobs and services can also help to make walking, cycling and taking transit to work a more attractive option, resulting in cleaner, healthier communities in the Fraser Valley. Fraser Valley Regional District and surrounding area Kamloops Plan for settlement patterns that minimize the use of automobiles and encourage walking, bicycling, and the efficient use of public transit, where practical. Whistler Harrison Hot Springs Boston Bar Kent Yale Hope - Choices for our Future Metro Vancouver Canada United States Bellingham, WA Satellite image: Google Earth

5 DAILY TRIPS TO WORK AND ELSEWHERE Most trips are local Building complete communities means providing jobs and services that residents can access locally. In 2004, a daily trip survey was undertaken to evaluate the length and purpose of trips in the three largest FVRD communities. For the region as a whole, fully 92% of all trips made stayed within the FVRD. This percentage includes commutes to work and school as well as trips for recreation, errands or shopping. On a more local level, and in particular had a high percentage of trips stay within their communities, at 81% and 87% respectively. Trips made from the District of were somewhat less self-contained, with 71% staying within its boundaries. The survey also found that the main purpose of trips within the FVRD was for personal business, with the second largest category being commutes to and from places of work and post-secondary institutions. Daily Trips from,, and by Destination 0% 20% 40% 60% 80% 100% Within City Within FVRD Outside FVRD Source: TransLink 2004 Trip Diary Proportion of Daily Trips by Purpose in,, and 14% 60% 14% 2% 5% 5% Source: TransLink 2004 Trip Diary Personal Business From Work or Post Secondary Trips Made During Work To Work or Post Secondary Provide opportunities for residents to live and work in the same community or region. - Choices for our Future To Grade School From Grade School

6 LIVE/WORK RATIO IN THE REGION Nearly 60% of residents work in the community where they live One measure of a complete community is the ratio of residents who live and work in the same community to those who live locally but work elsewhere. Based on data from the 2006 Canada Census, the region has a high proportion of residents who live and work in the same community. in particular is a highly self-contained community, with over two thirds of residents working within the city. is also high on the list, with 62% of workers remaining within the city limits to work. The District of is about average for communities in the Lower Mainland, with 36% of residents living and working within the community. Percentage of Lower Mainland Workers Living and Working in the Same Community 100% 80% 60% Overall in the FVRD, the number of people working within their own municipality sits at well over half of all residents at 57%. Encouraging cycling, walking and transit use for these local trips is a priority for creating a sustainable transportation future in the Fraser Valley. 40% 20% 0% Vancouver FVRD Richmond Surrey Burnaby Delta Coquitlam West Vancouver New Westminster White Rock Port Moody Work in city of residence Work outside city of residence Metro Vancouver FVRD 36% 64% 62% 38% Fraser Valley Regional District 57% 43% 67% 33% work in city of residence work outside city of residence


7 COMMUTING HOW FAR DO WE TRAVEL? Relatively short commuting distances How far people commute on a daily basis can also tell us a lot about our goal to create sustainable communities. Shorter commutes mean that residents are working closer to home, and the FVRD has some of the shortest commutes to work in the Lower Mainland. and especially are well below the BC average at around 6 kilometres each. Rural areas like the District of Kent and the FVRD electoral areas have relatively higher commute distances as a result of their more dispersed settlement patterns and distance from employment centres. Likewise, the Census Metropolitan Area (CMA) and the Census Agglomeration (CA) have higher commuting distances because they incorporate many of the more rural areas and the agriculture and resource-industry jobs that are so important to the region. Unlike other places of employment, these jobs are mostly located outside urban centres, and are generally not accessible by transit, walking or cycling. Kilometres Median Commuting Distance for Lower Mainland Communities The District of has one of the higher average commuting distances in the region, resulting from a lower number of jobs concentrated in the area and good transportation connections. Easily accessible connections to through Highway 11 and to many other Lower Mainland destinations both by automobile and the West Coast Express (WCE) rail service add to s higher travel distances to and from work. 0 White Rock Maple Ridge Pitt Meadows Port Coquitlam Port Moody Fraser Valley E Surrey Delta Township of Langley Coquitlam New Westminster Kent City of Langley Vancouver, CMA, CMA Richmond, CA Burnaby West Vancouver Canada District of N. Vancouver Vancouver City of N. Vancouver


8 LOCAL TRIPS JOBS ARE CLOSE TO HOME Percentage of Commuters Traveling Less than 5km to Work Most of us travel shorter distances The majority of the jobs in the region are clustered within the FVRD s urban growth boundary, concentrated within the three largest municipalities of,, and. With jobs located nearby to where residents live, trips to and from work are shorter and result in less congestion and a reduced impact on the environment. Although most of the jobs are concentrated within the urbanized areas of these municipalities, there are also significant numbers of jobs in the agricultural areas and smaller communities surrounding the larger urban centres. The importance of these jobs to their respective communities cannot be overstated; however their rural locations and dispersed pattern do create challenges that have implications for transportation networks in the region. Many employees in the agricultural and resource sectors depend on the flexibility of the automobile, and jobs are often located in areas where densities are not high enough for transit service. City of North Vancouver Vancouver GVRD Electoral Area A City of Langley Kent Richmond Canada White Rock Bowen Island District of North Vancouver Burnaby Port Coquitlam New Westminster Coquitlam Maple Ridge Surrey Delta District of Langley West Vancouver Port Moody Pitt Meadows Fraser Valley Electoral Area E Anmore Lions Bay Fraser Valley Electoral Area H Belcarra 0% 10% 20% 30% 40% 50% 60% % of Commuters Employment Distribution in the FVRD: Total Jobs by Census Tract Note: Total Jobs are shown at the geographic centre of the source census tract, not at actual location. Kent Metro Vancouver FVRD

9 REGIONAL TRIPS 24% OF COMMUTERS HEAD INTO METRO VANCOUVER Total Daily Commutes crossing the Metro Vancouver-FVRD Boundary 22, Langleys are the main destination for trips to Metro Vancouver According to the 2006 Census, 76% of all trips to work stay within the Fraser Valley Regional District. In addition, of the 24% of commuters who do leave the region, a significant majority travel only to municipalities close or adjacent to the FVRD s southwestern boundary. The four closest municipalities to the FVRD the Langleys, Surrey, and Maple Ridge collectively represent 66.1% of all trip destinations from the FVRD into Metro Vancouver, suggesting that only a minority of commuters are crossing congested bridges to destinations north of the Fraser River. FVRD Commuters to Metro Vancouver by Destination Municipality ,215 Westbound to Metro Vancouver from FVRD Eastbound to FVRD from Metro Vancouver Commuter Destinations in Metro Vancouver Total Commuters to Metro Vancouver % of Total Langley City and District 7, Surrey 4, Maple Ridge 2, Vancouver 1, Burnaby 1, Coquitlam Richmond Delta Port Coquitlam New Westminster Pitt Meadows White Rock City of North Vancouver Port Moody District of North Vancouver Other Total 22, % 66.1% of FVRD commuters heading to Metro Vancouver go to either the Langleys, Surrey, or Maple Ridge.


10 REGIONAL TRIPS MAJOR EMPLOYMENT DESTINATIONS Commutes into Metro Vancouver by Top 8 Industry Types (% of total trips) Industrial areas are a major destination for commuters to Metro Vancouver 6.8% 6.2% 6.1% 20.7% Of the approximately 22,000 trips (24% of job-related trips in the region) leaving the FVRD and heading to Metro Vancouver daily, the majority are destined for communities directly adjacent to the region, namely Maple Ridge and Langley. Major destinations further west are largely concentrated in census tracts which contain major industrial areas such as DeltaPort, Annacis Island, and South Westminster. Other significant destinations for journey to work trips in Metro Vancouver are largely clustered in the north side of the Township of Langley and Surrey, and include the Gloucester and Port Kells Industrial Parks. As the chart to the right shows, manufacturing, transportation, warehousing and other employment sectors based in these industrial areas make up a large proportion of the jobs for commuters heading in to Metro Vancouver from the FVRD. 7.8% 8.0% 8.0% Manufacturing Health care and social assistance Retail trade Wholesale trade Transportation and warehousing Public administration Construction Educational services 8.3% Major Employment Destinations and Work Trips to Metro Vancouver Census Tracts for FVRD Residents Downtown Vancouver Pacific Reach/Cape Horn Industrial Area Annacis Island South Westminster Industrial Area Port Kells Industrial Area Maple Ridge North Delta Willowbrook Gloucester Industrial Area Langley DeltaPort


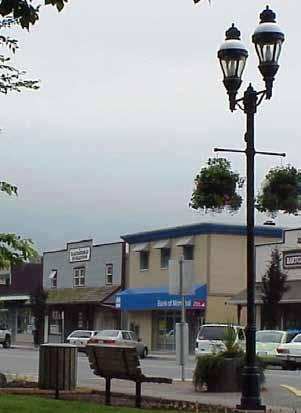
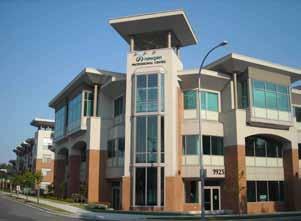
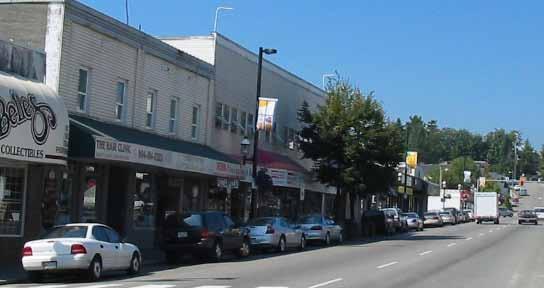
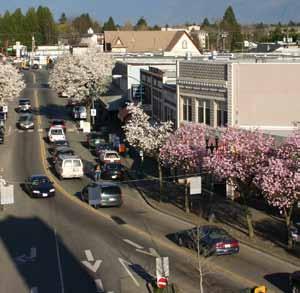
11 The Fraser Valley Regional District is comprised of 6 member municipalities and 7 electoral areas. City of, City of, District of, District of Hope, District of Kent, Village of Harrison Hot Springs and Electoral Areas A, B, C, D, E, F and G. Fraser Valley Regional District Image: Josh McCulloch (Picture BC)
12 Regional Snapshot Series: Transportation and Transit Commuting and Places of Work in the Fraser Valley Regional District June 2009 Fraser Valley Regional District Cheam Avenue, BC V2P 1N6 Toll free:
Port Cities Conference: How Regional Planning can Help Support a Competitive Port. Christina DeMarco Metro Vancouver
 Port Cities Conference: How Regional Planning can Help Support a Competitive Port Christina DeMarco Metro Vancouver June 12. 2008 Metro Vancouver Regional Growth Management Three ways to help support the
Managing Growth: Integrating Land Use & Transportation Planning
 Managing Growth: Integrating Land Use & Transportation Planning Metro Vancouver Sustainability Community Breakfast Andrew Curran Manager, Strategy June 12, 2013 2 Integrating Land Use & Transportation
CERTIFIED RESOLUTION. introduction: and dated May 29, 2017, as attached, as appropriate
 15322 Buena Vista Avenue, White Rock BC, Canada V4B 1Y6 www.whiterockcity.ca City of White Rock P: 604.541.22121 F: 604.541.9348 /2tC% City Clerk s Office IT E ROC K June 13,2017 Stephanie Lam, Deputy
METRO VANCOUVER 2040: SHAPING OUR FUTURE PERFORMANCE MONITORING GUIDELINE
 METRO VANCOUVER 2040: SHAPING OUR FUTURE PERFORMANCE MONITORING GUIDELINE Progress toward NOVEMBER 30, 2017 2 Progress toward Shaping our Future TABLE OF CONTENTS Introduction and Background... 4 Metro
Social Indicators and Trends 2014
 Social Indicators and Trends 2014 Healthy City for All Target Add to the Greenest City Action Plan, a biodiversity target and a target related to toxins prevention. By 2025: every Vancouver neighbourhood
Trip Generation Model Development for Albany
 Trip Generation Model Development for Albany Hui (Clare) Yu Department for Planning and Infrastructure Email: hui.yu@dpi.wa.gov.au and Peter Lawrence Department for Planning and Infrastructure Email: lawrence.peter@dpi.wa.gov.au
Metro Vancouver Shaping Our Future. Regional Growth Strategy. Adopted by the Greater Vancouver Regional District Board on July 29, 2011
 SUSTAINABLE REGION INITIATIVE... TURNING IDEAS INTO ACTION Regional Growth Strategy Bylaw No.1136, 2010 Metro Vancouver 2040 Shaping Our Future Adopted by the Greater Vancouver Regional District Board
Date: June 19, 2013 Meeting Date: July 5, Consideration of the City of Vancouver s Regional Context Statement
 Section E 1.5 To: From: Regional Planning and Agriculture Committee Lee-Ann Garnett, Senior Regional Planner Planning, Policy and Environment Department Date: June 19, 2013 Meeting Date: July 5, 2013 Subject:
Attachment 3. Updating UBC s Regional Context Statement. University of British Columbia CONSIDERATION MEMORANDUM OF CONSULTATION INPUT
 Attachment 3 University of British Columbia Updating UBC s Regional Context Statement CONSIDERATION MEMORANDUM OF CONSULTATION INPUT Campus and Community Planning February 24, 2014 1 CONSIDERATION MEMORANDUM
NEEDED: EQUITY IN REGIONAL PLANNING & FUNDING ALLOCATION
 NEEDED: EQUITY IN REGIONAL PLANNING & FUNDING ALLOCATION Metro Vancouver Should Act To End Decades of Destructive Funding- Favoritism For North of Fraser Public-Transit /Mega-Projects!! Broadway Subway
HORIZON 2030: Land Use & Transportation November 2005
 PROJECTS Land Use An important component of the Horizon transportation planning process involved reviewing the area s comprehensive land use plans to ensure consistency between them and the longrange transportation
Economic Activity Economic A ctivity
 5 Economic Economic Activity Activity ECONOMIC ACTIVITY 5.1 EMPLOYMENT... 5-7 5.1.1 OBJECTIVE... 5-7 5.1.2 POLICIES... 5-7 5.2 PROTECTING THE AREA OF EMPLOYMENT... 5-9 5.2.1 OBJECTIVE... 5-9 5.2.2 POLICIES...
Local Area Key Issues Paper No. 13: Southern Hinterland townships growth opportunities
 Draft Sunshine Coast Planning Scheme Review of Submissions Local Area Key Issues Paper No. 13: Southern Hinterland townships growth opportunities Key Issue: Growth opportunities for Southern Hinterland
Neighborhood Locations and Amenities
 University of Maryland School of Architecture, Planning and Preservation Fall, 2014 Neighborhood Locations and Amenities Authors: Cole Greene Jacob Johnson Maha Tariq Under the Supervision of: Dr. Chao
Assessing spatial distribution and variability of destinations in inner-city Sydney from travel diary and smartphone location data
 Assessing spatial distribution and variability of destinations in inner-city Sydney from travel diary and smartphone location data Richard B. Ellison 1, Adrian B. Ellison 1 and Stephen P. Greaves 1 1 Institute
MULTIPLE CHOICE. Choose the one alternative that best completes the statement or answers the question.
 AP Test 13 Review Name MULTIPLE CHOICE. Choose the one alternative that best completes the statement or answers the question. 1) Compared to the United States, poor families in European cities are more
Note: Prior Contact Checks will be required at other stages in the adoption process. The Agency will advise you when these are required.
 MINISTRY OF CHILDREN AND FAMILY DEVELOPMENT (MCFD) PRIOR CONTACT CHECK (PCC) - 4 forms: Prior Contact Check Request Consent for Prior Contact Check Consent to Share Information Form C Results of Prior
Figure 8.2a Variation of suburban character, transit access and pedestrian accessibility by TAZ label in the study area
 Figure 8.2a Variation of suburban character, transit access and pedestrian accessibility by TAZ label in the study area Figure 8.2b Variation of suburban character, commercial residential balance and mix
CLAREMONT MASTER PLAN 2017: LAND USE COMMUNITY INPUT
 Planning and Development Department 14 North Street Claremont, New Hampshire 03743 Ph: (603) 542-7008 Fax: (603) 542-7033 Email: cityplanner@claremontnh.com www.claremontnh.com CLAREMONT MASTER PLAN 2017:
SxD STUDIO MAPPING THE SPIKES TEAM VANAGAIN.
 SxD STUDIO MAPPING THE SPIKES 10.21.05 TEAM VANAGAIN. Elise Menard + Lesya Fesiak + Mo Rouhi + Xenia Semenianuk SxD STUDIO MAPPING THE SPIKES 10.21.05 Transportation Transit Ridership Population Density
State initiative following up the 2006 national planning report
 18 ness districts and public institutions, should be integrated with the opportunities for public transport services. State initiative following up the 2006 national planning report The Ministry of the
Too Close for Comfort
 Too Close for Comfort Overview South Carolina consists of urban, suburban, and rural communities. Students will utilize maps to label and describe the different land use classifications. Connection to
Population Density. Population density: A measure of how crowded a place is.
 Population Density Population density: A measure of how crowded a place is. Formula: Population Density = Population Total Area km 2 Overall Canada has a low population density of about 3 people per km
Grade 9 Social Studies Canadian Identity. Chapter 3 Review Canada s People. Chapter 3: Canada s People
 Grade 9 Social Studies Canadian Identity Chapter 3 Review Canada s People Chapter 3: Canada s People Terms (notes or textbook) Population Distribution Site Factors Seigneurial system Corridors Urbanization
BROOKINGS May
 Appendix 1. Technical Methodology This study combines detailed data on transit systems, demographics, and employment to determine the accessibility of jobs via transit within and across the country s 100
Impact of Metropolitan-level Built Environment on Travel Behavior
 Impact of Metropolitan-level Built Environment on Travel Behavior Arefeh Nasri 1 and Lei Zhang 2,* 1. Graduate Research Assistant; 2. Assistant Professor (*Corresponding Author) Department of Civil and
The Spatial Structure of Cities: International Examples of the Interaction of Government, Topography and Markets
 Module 2: Spatial Analysis and Urban Land Planning The Spatial Structure of Cities: International Examples of the Interaction of Government, Topography and Markets Alain Bertaud Urbanist Summary What are
Technical Memorandum #2 Future Conditions
 Technical Memorandum #2 Future Conditions To: Dan Farnsworth Transportation Planner Fargo-Moorhead Metro Council of Governments From: Rick Gunderson, PE Josh Hinds PE, PTOE Houston Engineering, Inc. Subject:
Key Issue 1: Why Do Services Cluster Downtown?
 Key Issue 1: Why Do Services Cluster Downtown? Pages 460-465 ***Always keep your key term packet out whenever you take notes from Rubenstein. As the terms come up in the text, think through the significance
Study Overview. the nassau hub study. The Nassau Hub
 Livable Communities through Sustainable Transportation the nassau hub study AlternativeS analysis / environmental impact statement The Nassau Hub Study Overview Nassau County has initiated the preparation
Measuring connectivity in London
 Measuring connectivity in London OECD, Paris 30 th October 2017 Simon Cooper TfL City Planning 1 Overview TfL Connectivity measures in TfL PTALs Travel time mapping Catchment analysis WebCAT Current and
Key Issue 1: Why Do Services Cluster Downtown?
 Key Issue 1: Why Do Services Cluster Downtown? Pages 460-465 1. Define the term CBD in one word. 2. List four characteristics of a typical CBD. Using your knowledge of services from chapter 12, define
Mapping Accessibility Over Time
 Journal of Maps, 2006, 76-87 Mapping Accessibility Over Time AHMED EL-GENEIDY and DAVID LEVINSON University of Minnesota, 500 Pillsbury Drive S.E., Minneapolis, MN 55455, USA; geneidy@umn.edu (Received
R E SEARCH HIGHLIGHTS
 Canada Research Chair in Urban Change and Adaptation R E SEARCH HIGHLIGHTS Research Highlight No.8 November 2006 THE IMPACT OF ECONOMIC RESTRUCTURING ON INNER CITY WINNIPEG Introduction This research highlight
2013/14 Authority Statistics
 Ministries 294 146 2921 1191 89 1289 331 90 3 2993 2913 303 Aboriginal Relations and Reconciliation 0 2 0 0 0 0 0 0 0 0 0 0 Advanced Education 6 0 18 8 0 12 0 0 0 20 20 4 Advanced Education, Innovation
The paper is based on commuting flows between rural and urban areas. Why is this of
 Commuting 1 The paper is based on commuting flows between rural and urban areas. Why is this of interest? Academically, extent of spread of urban agglomeration economies, also the nature of rural-urban
GIS Analysis of Crenshaw/LAX Line
 PDD 631 Geographic Information Systems for Public Policy, Planning & Development GIS Analysis of Crenshaw/LAX Line Biying Zhao 6679361256 Professor Barry Waite and Bonnie Shrewsbury May 12 th, 2015 Introduction
Most people used to live like this
 Urbanization Most people used to live like this Increasingly people live like this. For the first time in history, there are now more urban residents than rural residents. Land Cover & Land Use Land cover
APPENDIX IV MODELLING
 APPENDIX IV MODELLING Kingston Transportation Master Plan Final Report, July 2004 Appendix IV: Modelling i TABLE OF CONTENTS Page 1.0 INTRODUCTION... 1 2.0 OBJECTIVE... 1 3.0 URBAN TRANSPORTATION MODELLING
Generic Success Criteria
 Generic Success Criteria Significance I can identify a short term and long term impact that a development/event/issue has/had locally/globally. I can discuss (verbally, graphically, etc.) how a development/event/issue
Urban Planning Word Search Level 1
 Urban Planning Word Search Level 1 B C P U E C O S Y S T E M P A R E U O E U R B A N P L A N N E R T N S T D H E C O U N T Y G E R E R D W R E N I C I T Y C O U N C I L A A A S U G G C I L A G P R I R
Economic Geography of the Long Island Region
 Geography of Data Economic Geography of the Long Island Region Copyright 2011 AFG 1 The geography of economic activity requires: - the gathering of spatial data - the location of data geographically -
Council Workshop on Neighbourhoods Thursday, October 4 th, :00 to 4:00 p.m. Burlington Performing Arts Centre
 Council Workshop on Neighbourhoods Thursday, October 4 th, 2012 1:00 to 4:00 p.m. Burlington Performing Arts Centre Agenda Introductions Warm-Up Exercise Presentation Exercise Neighbourhood Planning Break
Chapter 12. Services
 Chapter 12 Services Where di services originate? Key Issue #1 Shoppers in Salzburg, Austria Origins & Types of Services Types of services Consumer services Business services Public services Changes in
Key Issue 1: Where Are Services Distributed?
 Key Issue 1: Where Are Services Distributed? Pages 430-433 *See the Introduction on page 430 to answer questions #1-4 1. Define service: 2. What sector of the economy do services fall under? 3. Define
Travel behavior of low-income residents: Studying two contrasting locations in the city of Chennai, India
 Travel behavior of low-income residents: Studying two contrasting locations in the city of Chennai, India Sumeeta Srinivasan Peter Rogers TRB Annual Meet, Washington D.C. January 2003 Environmental Systems,
East Bay BRT. Planning for Bus Rapid Transit
 East Bay BRT Planning for Bus Rapid Transit Regional Vision Draper Prison The Bottleneck is a State-Level issue, Salt Lake County 2050 Population: 1.5M Draper Prison hopefully with some State-Level funding!
Regional Performance Measures
 G Performance Measures Regional Performance Measures Introduction This appendix highlights the performance of the MTP/SCS for 2035. The performance of the Revenue Constrained network also is compared to
Urban Form and Travel Behavior:
 Urban Form and Travel Behavior: Experience from a Nordic Context! Presentation at the World Symposium on Transport and Land Use Research (WSTLUR), July 28, 2011 in Whistler, Canada! Petter Næss! Professor
2014/15 Authority Statistics
 Open Opened Not Open Ministries 304 200 2718 806 50 1342 365 37 0 2600 2566 456 Advanced Education 3 3 20 9 0 7 3 0 0 19 19 4 Agriculture 1 0 5 3 0 1 0 0 0 4 4 2 Children and Family Development 79 18 620
River North Multi-Modal Transit Analysis
 River North Multi-Modal Transit Analysis November 7, 2006 Dan Meyers, AICP URS Corporation 612-373-6446 / dan_meyers@urscorp.com River North Study Area Reasons for initiating the study Downtown areas north
BIG IDEAS. Area of Learning: SOCIAL STUDIES Urban Studies Grade 12. Learning Standards. Curricular Competencies
 Area of Learning: SOCIAL STUDIES Urban Studies Grade 12 BIG IDEAS Urbanization is a critical force that shapes both human life and the planet. The historical development of cities has been shaped by geographic,
research highlight Wind-Rain Relationships in Southwestern British Columbia Introduction Methodology Figure 2 Lower Mainland meteorological stations
 research highlight June 2007 Technical Series 07-114 Introduction Building envelope failures in southwestern British Columbia has brought to light the strong influence of wind-driven rain on building envelopes.
The Elusive Connection between Density and Transit Use
 The Elusive Connection between Density and Transit Use Abstract: The connection between density and transportation is heralded by planners, yet results are often elusive. This paper analyzes two regions,
of places Key stage 1 Key stage 2 describe places
 Unit 25 Geography and numbers ABOUT THE UNIT This continuous unit aims to show how geographical enquiry can provide a meaningful context for the teaching and reinforcement of many aspects of the framework
6 th Line Municipal Class Environmental Assessment
 6 th Line Municipal Class Environmental Assessment County Road 27 to St John s Road Town of Innisfil, ON September 6, 2016 APPENDIX L: TRAVEL DEMAND FORECASTING MEMORANDUM Accessible formats are available
Chapter 10 Human Settlement Geography Book 1 Class 12
 CHAPTER 10 HUMAN SETTLEMENTS 1. RURAL, SUB URBAN AND URBAN SETTLEMENTS: This classification is common worldwide but the criteria differ from country to country. 5. Criteria for classification differs from
Integrated Infrastructure Planning & Spatial Mapping
 Integrated Infrastructure Planning & Spatial Mapping Presenter: Heidi Dixon, Principal Social Planner, DTPLI 23 May 2014 PART 1 PLAN MELBOURNE : Metropolitan Planning Strategy PART 2 Case Study: DTPLI
Making space for a more foundational construction sector in Brussels
 Making space for a more foundational construction sector in Brussels Sarah De Boeck, David Bassens & Michael Ryckewaert Social innovation in the Foundational Economy Cardiff, 5 th of September 2018 1.
A Review of Concept of Peri-urban Area & Its Identification
 A Review of Concept of Peri-urban Area & Its Identification Ar. Manita Saxena Research Scholar Department of Architecture and Planning M.A.N.I.T, Bhopal Dr. Supriya Vyas Assistant Professor, Department
Giant Traveling Map Lesson
 Giant Traveling Map Lesson TITLE / AUTHOR: Idahoans on the Move / Rebecca Theobald IDAHO ACADEMIC STANDARDS / SUITABLE DISCIPLINES: OBJECTIVES: Students will: Learn about major cities in Idaho during three
Regional Performance Measures
 G Performance Measures Regional Performance Measures Introduction This appendix highlights the performance of the MTP/SCS for 2035. The performance of the Revenue Constrained network also is compared to
INDUSTRIAL MARKET OVERVIEW
 INDUSTRIAL MARKET OVERVIEW Presented to: Metro Vancouver Planning Committee Presented by: Curtis Scott Manager, Market Intelligence Western Roy Pat Industrial Sales & Leasing Canada Vancouver PRESENTATION
National Spatial Development Perspective (NSDP) Policy Coordination and Advisory Service
 Policy Coordination and Advisory Service") National Spatial Development Perspective (NSDP) Policy Coordination and Advisory Service 1 BACKGROUND The advances made in the First Decade by far supersede the weaknesses. Yet, if all indicators were
National Spatial Development Perspective (NSDP) Policy Coordination and Advisory Service 1 BACKGROUND The advances made in the First Decade by far supersede the weaknesses. Yet, if all indicators were
Shaping Your Neighbourhood
 Shaping Your Neighbourhood Building a Core Sustainable Neighbourhood Action Plan Nov. 25 & 26, 2006 Welcome! Peter Russell Planner, Holland Barrs Planning Group Inc. Role in this project: Work with the
Socials Studies. Chapter 3 Canada s People 3.0-Human Geography
 Socials Studies Chapter 3 Canada s People 3.0-Human Geography Physical Geography Study of the natural features of the Earth s surface including landforms, climate, ocean currents and flora and fauna Human
Spatial profile of three South African cities
 Spatial Outcomes Workshop South African Reserve Bank Conference Centre Pretoria September 29-30, 2009 Spatial profile of three South African cities by Alain Bertaud September 29 Email: duatreb@msn.com
CORPORATION OF THE CITY OF COURTENAY COUNCIL MEETING AGENDA
 CORPORATION OF THE CITY OF COURTENAY COUNCIL MEETING AGENDA DATE: Monday, January 14, 2013 PLACE: City Hall Council Chambers TIME: 4:00 p.m. 1.00 ADOPTION OF MINUTES 1. Adopt January 7, 2013 Regular Council
Employment Decentralization and Commuting in U.S. Metropolitan Areas. Symposium on the Work of Leon Moses
 Employment Decentralization and Commuting in U.S. Metropolitan Areas Alex Anas Professor of Economics University at Buffalo Symposium on the Work of Leon Moses February 7, 2014 9:30-11:15am, and 2:30-4:30pm
Saskatoon Region Economic Diversity Report
 Saskatoon Region Economic Diversity Report Economic Diversity: Empirical Calculations and Comparisons In order to analyse the economic diversity of the Saskatoon Region, we first had to answer a few questions:
2012/13 Authority Statistics
 ed Ministries 315 344 2741 1031 100 1347 243 89 2 2812 2761 295 Aboriginal Relations and Reconciliation 0 1 1 1 0 0 0 0 0 1 1 0 Advanced Education, Innovation and Technology 2 0 21 7 1 4 2 1 0 15 15 8
Growth Management: Analysis of Comments Received and Responses Comments received as of October 16, 2017
 Growth Management: Analysis of Comments Received and s Comments received as of October 16, Comments informing the Region of Peel s growth management work have been summarized with responses below. These
Local Economic Activity Around Rapid Transit Stations
 Local Economic Activity Around Rapid Transit Stations The Case of Chicago s Orange Line Julie Cooper, MPP 2014 Harris School of Public Policy Transport Chicago June 6, 2014 Motivation Impacts of transit
Alternatives Analysis Report
 1.0 PURPOSE AND NEED The Southern California Association of Governments (SCAG), in coordination with the Los Angeles County Metropolitan Transportation Authority (Metro) and the Orange County Transportation
The Economic and Social Health of the Cairngorms National Park 2010 Summary
 The Economic and Social Health of the Cairngorms National Park 2010 Published by Cairngorms National Park Authority The Economic and Social Health of the Cairngorms National Park 2010 This summary highlights
National planning report for Denmark
 National planning report for Denmark from the Minister for Environment and Energy Local identity and new challenges Summary 2000 1 CONTENTS 4 PREFACE: REGIONAL DEVELOPMENT AND SPATIAL PLANNING 6 1. BALANCED
a) Imbedding flexibility b) Different incentives for different locations? 1. What are we trying to achieve?
 Imbedding flexibility b) Different incentives for different locations? 1. What are we trying to achieve?") 2 1. What are we trying to achieve? a) Growth as fast as possible (spatially neutral) b) Growth as fast as possible, in as many places as possible c) Shift in the pattern of geographic distribution of
2 1. What are we trying to achieve? a) Growth as fast as possible (spatially neutral) b) Growth as fast as possible, in as many places as possible c) Shift in the pattern of geographic distribution of
THE LEGACY OF DUBLIN S HOUSING BOOM AND THE IMPACT ON COMMUTING
 Proceedings ITRN2014 4-5th September, Caulfield and Ahern: The Legacy of Dublin s housing boom and the impact on commuting THE LEGACY OF DUBLIN S HOUSING BOOM AND THE IMPACT ON COMMUTING Brian Caulfield
Summary and Implications for Policy
 Summary and Implications for Policy 1 Introduction This is the report on a background study for the National Spatial Strategy (NSS) regarding the Irish Rural Structure. The main objective of the study
accessibility accessibility by-pass bid-rent curve bridging point administrative centre How easy or difficult a place is to reach.
 accessibility accessibility How easy or difficult a place is to reach. How easy or difficult it is to enter a building. administrative centre bid-rent curve The function of a town which is a centre for
Chapter 12. Key Issue Three: Why do business services locate in large settlements?
 Chapter 12 Key Issue Three: Why do business services locate in large settlements? Business Services and Settlements World cities Ancient world cities Medieval world cities Modern world cities Hierarchy
A MULTI-MODAL APPROACH TO SUSTAINABLE ACCESSIBILITY: A CASE STUDY FOR THE CITY OF GALWAY, IRELAND
 A MULTI-MODAL APPROACH TO SUSTAINABLE ACCESSIBILITY: A CASE STUDY FOR THE CITY OF GALWAY, IRELAND Dr. Amaya Vega Post-Doctoral Researcher School of Business and Economics, National University of Ireland
Government of Canada Designation of Vancouver Island as a Foreign Trade Zone Point
 2017 Government of Canada Designation of Vancouver Island as a Foreign Trade Zone Point Preface This position paper developed by VIEA working with a working group of Island industry and transportation
The National Spatial Strategy
 Purpose of this Consultation Paper This paper seeks the views of a wide range of bodies, interests and members of the public on the issues which the National Spatial Strategy should address. These views
Answers to British Columbia Quizzes
 Answers to British Columbia Quizzes p. 1 Test Your Knowledge What do you remember from your review of the British Columbia section of the E-atlas? 1. What percentage of Canada's total area does British
AP Human Geography Unit 7a: Services Guided Reading Mr. Stepek Introduction (Rubenstein p ) 1. What is the tertiary sector of the economy?
 1. What is the tertiary sector of the economy?") Public Business Consumer AP Human Geography Unit 7a: Services Guided Reading Mr. Stepek Introduction (Rubenstein p 372 374) 1. What is the tertiary sector of the economy? 2. What is a service activity?
Public Business Consumer AP Human Geography Unit 7a: Services Guided Reading Mr. Stepek Introduction (Rubenstein p 372 374) 1. What is the tertiary sector of the economy? 2. What is a service activity?
Economic and Social Urban Indicators: A Spatial Decision Support System for Chicago Area Transportation Planning
 Economic and Social Urban Indicators: A Spatial Decision Support System for Chicago Area Transportation Planning Piyushimita Thakuriah (Vonu), P.S. Sriraj, Paul Metaxatos, Inshu Minocha & Tanushri Swarup
Frequently Asked Questions
 What is the Regional Transit Engagement Series? As one of the fastest growing regions in the country, there is recognition that long-term transit planning efforts should be accelerated if we are to remain
StanCOG Transportation Model Program. General Summary
 StanCOG Transportation Model Program Adopted By the StanCOG Policy Board March 17, 2010 What are Transportation Models? General Summary Transportation Models are technical planning and decision support
Welcome to GCSE Geography. Where will it take us today?
 Welcome to GCSE Geography Where will it take us today? Urban Futures Dynamic Development Resource Reliance UK in the 21 st Century Global Hazards Changing Climate Distinctive Landscapes Sustaining Ecosystems
A/Prof. Mark Zuidgeest ACCESSIBILITY EFFECTS OF RELOCATION AND HOUSING PROJECT FOR THE URBAN POOR IN AHMEDABAD, INDIA
 A/Prof. Mark Zuidgeest ACCESSIBILITY EFFECTS OF RELOCATION AND HOUSING PROJECT FOR THE URBAN POOR IN AHMEDABAD, INDIA South African Cities Network/University of Pretoria, 09 April 2018 MOBILITY Ability
c. What is the most distinctive above ground result of high land costs and intensive land use? i. Describe the vertical geography of a skyscraper?
 AP Human Geography Unit 7b Guided Reading: Urban Patterns and Social Issues Mr. Stepek Key Issue #1: Why Do Services Cluster Downtown? (Rubenstein p 404 410) 1. What is the CBD? What does it contain and
Geographic Locations Survey of Clinical Psychologists in Canada
 Geographic Locations Survey of Clinical Psychologists in Canada A publication of the Canadian Psychological Association. 1999 To order print copies, click here! Print copies of this CPA document are available
CHAPTER 2. Strategic Context
 CHAPTER 2 Strategic Aim: To facilitate the future development of Cork as a national gateway city within the integrated land use and transportation framework set out in the Cork Area Strategic Plan 2001
Identifying Megaregions in the US: Implications for Infrastructure Investment
 7. 10. 2 0 08 Identifying Megaregions in the US: Implications for Infrastructure Investment Dr. Myungje Woo Dr. Catherine L. Ross Jason Barringer Harry West Jessica Lynn Harbour Doyle Center for Quality
22 cities with at least 10 million people See map for cities with red dots
 22 cities with at least 10 million people See map for cities with red dots Seven of these are in LDC s, more in future Fastest growing, high natural increase rates, loss of farming jobs and resulting migration
Transport Planning in Large Scale Housing Developments. David Knight
 Transport Planning in Large Scale Housing Developments David Knight Large Scale Housing Developments No longer creating great urban spaces in the UK (Hall 2014) Transport Planning Transport planning processes
Advances in Geographic Data Science and Urban Analytics
 Advances in Geographic Data Science and Urban Analytics Alex Singleton Professor of Geographic Information Science Department of Geography and Planning Consumer Data Research Centre www.cdrc.ac.uk www.geographicdatascience.com
MODULE 1 INTRODUCING THE TOWNSHIP RENEWAL CHALLENGE
 MODULE 1 INTRODUCING THE TOWNSHIP RENEWAL CHALLENGE FOCUS OF THE MODULE Township renewal challenges and developmental outcomes covered in this module: Historical origins of townships and the inherited
Understanding Land Use and Walk Behavior in Utah
 Understanding Land Use and Walk Behavior in Utah 15 th TRB National Transportation Planning Applications Conference Callie New GIS Analyst + Planner STUDY AREA STUDY AREA 11 statistical areas (2010 census)