Finding Hot Spots in ArcGIS Online: Minimizing the Subjectivity of Visual Analysis. Nicholas M. Giner Esri Parrish S.
|
|
|
- Buddy Aubrey Briggs
- 6 years ago
- Views:
Transcription


1 Finding Hot Spots in ArcGIS Online: Minimizing the Subjectivity of Visual Analysis Nicholas M. Giner Esri Parrish S. Henderson FBI
2 Agenda The subjectivity of maps What is Hot Spot Analysis? Why do Hot Spot Analysis? Pattern Analysis: ArcGIS Desktop vs. ArcGIS Online Heat Maps vs. Hot Spot Maps How does Hot Spot Analysis work? How does Local Outlier Analysis work? Parrish Henderson Federal Bureau of Investigation

3 Maps are subjective Bronx, NY Water Quality Incidents January 2010 February 2017 Is there a spatial pattern in the location of these water quality incidents?

4 Maps are subjective Ft. Worth, TX Fire Response Times Is there a spatial pattern in the response times of these fire calls?


5 Maps are subjective Natural Breaks Southeast USA Economic Resilience to Natural Disasters (Counties) Equal Interval Quantile Geometric Interval Is there a spatial pattern in economic resilience to natural disasters in the Southeastern USA?

")


6 What is Hot Spot Analysis? Identifies statistically significant hot spots and cold spots (i.e. spatial clusters of high and low values) in geographic data It is based on Tobler s First Law of Geography all things are related, but near things are more related than distant things (i.e. Spatial dependence or Spatial autocorrelation)
7 Why do Hot Spot Analysis? 1) Exploration: To reveal new insights and quantify patterns in data that you might not see 2) Regression workflows: Determining if you have spatial dependence in your residuals (one of the 6 checks of Ordinary Least Squares Regression ) 3) Interpolation workflows: Spatial dependence is the foundation of Geostatistics
8 Pattern Analysis: ArcGIS Desktop vs. ArcGIS Online ArcGIS Pro ArcGIS Online

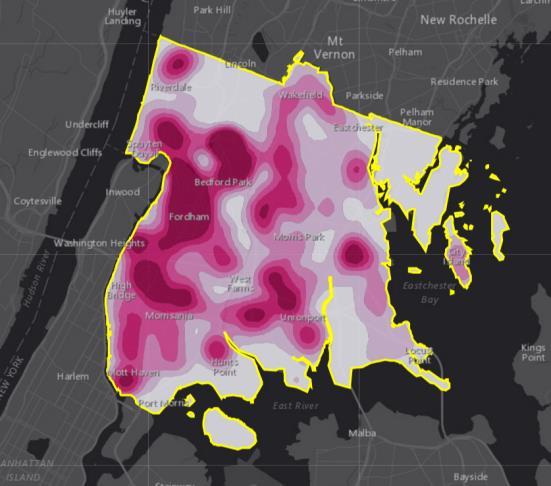

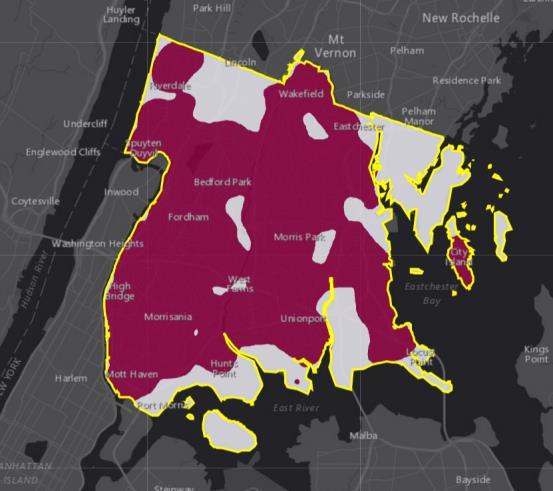
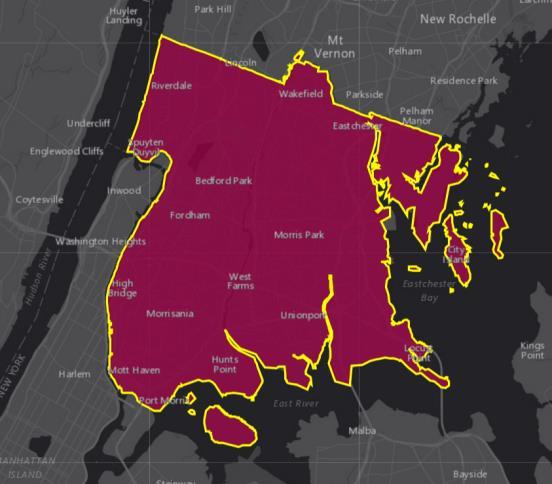
9 Heat Maps vs. Hot Spot Maps
10 Demo #1 Heat Maps: Calculate Density in ArcGIS Online

11 How does Hot Spot Analysis work? Getis-Ord Gi* Statistic
12 How does Hot Spot Analysis work?
13 How does Hot Spot Analysis work? Feature
14 How does Hot Spot Analysis work? Feature Neighborhood
15 How does Hot Spot Analysis work? Study Area Feature Neighborhood
16 How does Hot Spot Analysis work? Study Area Is this Neighborhood Significantly different from the study area?
17 How does Hot Spot Analysis work? If significantly higher The feature is marked a Hot Spot Cold Spot 99% Confidence Cold Spot 95% Confidence Cold Spot 90% Confidence Not Significant Hot Spot 90% Confidence Hot Spot 95% Confidence Hot Spot 99% Confidence
18 How does Hot Spot Analysis work?
19 How does Hot Spot Analysis work?
20 How does Hot Spot Analysis work?
21 How does Hot Spot Analysis work?
22 How does Hot Spot Analysis work?
23 How does Hot Spot Analysis work? Cold Spot 99% Confidence Cold Spot 95% Confidence Cold Spot 90% Confidence Not Significant Hot Spot 90% Confidence Hot Spot 95% Confidence Hot Spot 99% Confidence
24 z-score (degree of clustering) How is Neighborhood defined? 6 5 Optimal neighborhood distance is where degree of clustering is highest 4 3 In ArcGIS Online, neighborhood is chosen for you via the Optimized Hot Spot Analysis tool Spatial Autocorrelation is calculated at multiple distances Distance


25 Examples of Hot Spot Analysis Point Locations Chicago Crimes: (2014) DC Snow Removal Complaints: Jan 2016 February 2016 NYC Graffiti: Jan Present


26 Examples of Hot Spot Analysis Point Attributes Austria Heavy Metals: Cadmium Concentration


27 Examples of Hot Spot Analysis Polygon Attributes Philadelphia Tracts: Market Potential for Medicaid DC Block Groups: Republican Party Affiliation
28 Demo #2 Hot Spots: Find Hot Spots in ArcGIS Online
")
29 How does Local Outlier Analysis work? Local Indicators of Spatial Association (LISA) Statistic
30 How does Local Outlier Analysis work?
31 How does Local Outlier Analysis work? Feature
32 How does Local Outlier Analysis work? Feature Neighborhood
33 How does Local Outlier Analysis work? Is this Neighborhood Is this Feature AND Significantly different from all other neighborhoods? Significantly different from all other features?
34 How does Local Outlier Analysis work? Feature is higher than other features, Feature is higher than other features, Neighborhood is lower than other neighborhoods High Outlier HL HH Neighborhood is higher than other neighborhoods Feature is lower than other features, LL LH Feature is lower than other features, Neighborhood is lower than other neighborhoods Neighborhood is higher than other neighborhoods Low Outlier
35 How does Local Outlier Analysis work? High-High Cluster High-Low Outlier Low-High Outlier Low-Low Cluster Not Significant
36 Demo #3 Outliers: Find Outliers in ArcGIS Online
37 Analyzing Crime Hot Spots in New Orleans Parrish Henderson Federal Bureau of Investigation


38 Please Take Our Survey on the Esri Events App! Download the Esri Events app and find your event Select the session you attended Scroll down to find the survey Complete Answers and Select Submit

39 Print Your Certificate of Attendance Print stations located in the 140 Concourse Monday 12:30 PM 6:30 PM GIS Solutions Expo, Hall B Tuesday 10:45 AM 5:15 PM GIS Solutions Expo, Hall B 5:15 PM 6:30 PM Expo Social, Hall B 6:30 PM 9:30 PM Networking Reception, Smithsonian National Air and Space Museum


40
41 Appendix

42 Equations are local measures of spatial autocorrelation that calculate the degree of association between zone i and its neighbors j given a specified distance radius d (Getis and Ord, 1992). They help identify pockets of dependence called hot spots or cold spots. For example, if zone i has a high value and its neighbors j within distance d have high values, then this is a hot spot. The null hypothesis for these statistics is that there is no spatial clustering of similar values and the output is a map of z-scores. If a z-score is high or low (+ or 1.96 for a p-value < 0.05) then we can reject the null hypothesis and conclude that there is statistically significant spatial clustering of high or low values. where d represents the distance radius, the numerator is the sum of all zones j within d of zone i, and the denominator is the sum of all zones j in the study area not including zone i (Getis and Ord, 1992). The only difference between Gi and Gi* is that Gi* includes the value of zone i in the calculation (O Sullivan and Unwin, 2003). is a disaggregated version of the global Moran s statistic in that the equation is applied only to one particular zone rather than the summation of all the zones in the dataset (O Sullivan and Unwin, 2003). Thus it is a local measure of spatial autocorrelation and attempts to identify statistically significant clusters of similar values (high or low values). Because the LISA statistic is calculated locally, the Local Moran s index scores can be displayed spatially on a cluster map (Anselin, 1995). What is the definition of zone? In this case, the zone is defined by the adjacency matrix and the order of contiguity specified. For example, a firstorder, Queen s case contiguity zone around the state of Pennsylvania would include all states immediately sharing a border on all sides with Pennsylvania (Ohio, West Virginia, Maryland, Delaware, New Jersey, and New York). The zone would change if the type and order of contiguity changed. Other examples of the type of contiguity would be the Rook s and Bishop s case. Other examples of order of contiguity would be second or third order (Ord, 2010). where z i and z j represent deviations from the mean in zones i and j, and the summation over j indicates that only neighboring values are included in the calculation. W is the spatial weights matrix and defines adjacencies (Anselin, 1995).

43 z-scores and p-values
Finding Hot Spots in ArcGIS Online: Minimizing the Subjectivity of Visual Analysis. Nicholas M. Giner Esri Parrish S.
 Finding Hot Spots in ArcGIS Online: Minimizing the Subjectivity of Visual Analysis Nicholas M. Giner Esri Parrish S. Henderson - FBI Agenda The subjectivity of maps What is Hot Spot Analysis? What is Outlier
ArcGIS Pro: Analysis and Geoprocessing. Nicholas M. Giner Esri Christopher Gabris Blue Raster
 ArcGIS Pro: Analysis and Geoprocessing Nicholas M. Giner Esri Christopher Gabris Blue Raster Agenda What is Analysis and Geoprocessing? Analysis in ArcGIS Pro - 2D (Spatial xy) - 3D (Elevation - z) - 4D
ArcGIS Online Analytics. Mike Flanagan
 ArcGIS Online Analytics Mike Flanagan MFlanagan@esri.com Agenda Introduction to ArcGIS Online Spatial Analysis ArcGIS Online Spatial Analysis Workflow Demos and Examples Wrap-up Q&A ArcGIS A complete web
An introduction to ArcGIS Maps for Office. Scott Ball & Mike Flanagan
 An introduction to ArcGIS Maps for Office Scott Ball & Mike Flanagan Main takeaways for today Adding the where to your analysis You can learn a lot when you unlock the power of geography in your analytics
GIS Spatial Statistics for Public Opinion Survey Response Rates
 GIS Spatial Statistics for Public Opinion Survey Response Rates July 22, 2015 Timothy Michalowski Senior Statistical GIS Analyst Abt SRBI - New York, NY t.michalowski@srbi.com www.srbi.com Introduction
Spatial Analysis I. Spatial data analysis Spatial analysis and inference
 Spatial Analysis I Spatial data analysis Spatial analysis and inference Roadmap Outline: What is spatial analysis? Spatial Joins Step 1: Analysis of attributes Step 2: Preparing for analyses: working with
Objectives Define spatial statistics Introduce you to some of the core spatial statistics tools available in ArcGIS 9.3 Present a variety of example a
 Introduction to Spatial Statistics Opportunities for Education Lauren M. Scott, PhD Mark V. Janikas, PhD Lauren Rosenshein Jorge Ruiz-Valdepeña 1 Objectives Define spatial statistics Introduce you to some
Concepts and Applications of Kriging. Eric Krause
 Concepts and Applications of Kriging Eric Krause Sessions of note Tuesday ArcGIS Geostatistical Analyst - An Introduction 8:30-9:45 Room 14 A Concepts and Applications of Kriging 10:15-11:30 Room 15 A
Tracey Farrigan Research Geographer USDA-Economic Research Service
 Rural Poverty Symposium Federal Reserve Bank of Atlanta December 2-3, 2013 Tracey Farrigan Research Geographer USDA-Economic Research Service Justification Increasing demand for sub-county analysis Policy
Spatial Pattern Analysis: Mapping Trends and Clusters
 Esri International User Conference San Diego, California Technical Workshops July 24, 2012 Spatial Pattern Analysis: Mapping Trends and Clusters Lauren M. Scott, PhD Lauren Rosenshein Bennett, MS Presentation
Luc Anselin Spatial Analysis Laboratory Dept. Agricultural and Consumer Economics University of Illinois, Urbana-Champaign
 GIS and Spatial Analysis Luc Anselin Spatial Analysis Laboratory Dept. Agricultural and Consumer Economics University of Illinois, Urbana-Champaign http://sal.agecon.uiuc.edu Outline GIS and Spatial Analysis
Exploratory Spatial Data Analysis (ESDA)
") Exploratory Spatial Data Analysis (ESDA) VANGHR s method of ESDA follows a typical geospatial framework of selecting variables, exploring spatial patterns, and regression analysis. The primary software
Exploratory Spatial Data Analysis (ESDA) VANGHR s method of ESDA follows a typical geospatial framework of selecting variables, exploring spatial patterns, and regression analysis. The primary software
Lecture 4. Spatial Statistics
 Lecture 4 Spatial Statistics Lecture 4 Outline Statistics in GIS Spatial Metrics Cell Statistics Neighborhood Functions Neighborhood and Zonal Statistics Mapping Density (Density surfaces) Hot Spot Analysis
Nature of Spatial Data. Outline. Spatial Is Special
 Nature of Spatial Data Outline Spatial is special Bad news: the pitfalls of spatial data Good news: the potentials of spatial data Spatial Is Special Are spatial data special? Why spatial data require
Spatial Autocorrelation
 Spatial Autocorrelation Luc Anselin http://spatial.uchicago.edu spatial randomness positive and negative spatial autocorrelation spatial autocorrelation statistics spatial weights Spatial Randomness The
Lecture 3: Exploratory Spatial Data Analysis (ESDA) Prof. Eduardo A. Haddad
 Prof. Eduardo A. Haddad") Lecture 3: Exploratory Spatial Data Analysis (ESDA) Prof. Eduardo A. Haddad Key message Spatial dependence First Law of Geography (Waldo Tobler): Everything is related to everything else, but near things
Lecture 3: Exploratory Spatial Data Analysis (ESDA) Prof. Eduardo A. Haddad Key message Spatial dependence First Law of Geography (Waldo Tobler): Everything is related to everything else, but near things
Geospatial Standards Support - An Overview. Marten Hogeweg & Satish Sankaran
 Geospatial Standards Support - An Overview Marten Hogeweg & Satish Sankaran Agenda Interoperability and Standards ArcGIS Open, Interoperable and Standards Compliant Esri Open initiatives Understanding
2/7/2018. Module 4. Spatial Statistics. Point Patterns: Nearest Neighbor. Spatial Statistics. Point Patterns: Nearest Neighbor
 Spatial Statistics Module 4 Geographers are very interested in studying, understanding, and quantifying the patterns we can see on maps Q: What kinds of map patterns can you think of? There are so many
Concepts and Applications of Kriging. Eric Krause Konstantin Krivoruchko
 Concepts and Applications of Kriging Eric Krause Konstantin Krivoruchko Outline Introduction to interpolation Exploratory spatial data analysis (ESDA) Using the Geostatistical Wizard Validating interpolation
Spatial Regression. 1. Introduction and Review. Luc Anselin. Copyright 2017 by Luc Anselin, All Rights Reserved
 Spatial Regression 1. Introduction and Review Luc Anselin http://spatial.uchicago.edu matrix algebra basics spatial econometrics - definitions pitfalls of spatial analysis spatial autocorrelation spatial
Web GIS Patterns and Practices
 FedGIS Conference February 24 25, 2016 Washington, DC Web GIS Patterns and Practices Philip Heede Jay Theodore Witt Mathot Web GIS Transformation of the ArcGIS Platform Desktop Apps Web Maps Web Scenes
Geodatabase: Best Practices. Robert LeClair, Senior Instructor
 Geodatabase: Best Practices Robert LeClair, Senior Instructor Agenda Geodatabase Creation Data Ownership Data Model Data Configuration Geodatabase Behaviors Data Validation Extending Performance Geodatabase
Measures of Spatial Dependence
 Measures of Spatial Dependence Carlos Hurtado Department of Economics University of Illinois at Urbana-Champaign hrtdmrt2@illinois.edu Junel 30th, 2016 C. Hurtado (UIUC - Economics) Spatial Econometrics
Spatial Pattern Analysis: Mapping Trends and Clusters
 2013 Esri International User Conference July 8 12, 2013 San Diego, California Technical Workshop Spatial Pattern Analysis: Mapping Trends and Clusters Lauren Rosenshein Bennett Brett Rose Presentation
What s special about spatial data?
 What s special about spatial data? Road map Geographic Information analysis The need to develop spatial thinking Some fundamental geographic concepts (PBCS) What are the effects of space? Spatial autocorrelation
Mapping Your Educational Research: Putting Spatial Concepts into Practice with GIS. Mark Hogrebe Washington University in St.
 Mapping Your Educational Research: Putting Spatial Concepts into Practice with GIS Mapping Your Educational Research: Putting Spatial Concepts into Practice with GIS Mark Hogrebe Washington University
Lecture 3: Exploratory Spatial Data Analysis (ESDA) Prof. Eduardo A. Haddad
 Prof. Eduardo A. Haddad") Lecture 3: Exploratory Spatial Data Analysis (ESDA) Prof. Eduardo A. Haddad Key message Spatial dependence First Law of Geography (Waldo Tobler): Everything is related to everything else, but near things
Lecture 3: Exploratory Spatial Data Analysis (ESDA) Prof. Eduardo A. Haddad Key message Spatial dependence First Law of Geography (Waldo Tobler): Everything is related to everything else, but near things
Spatial Pattern Analysis: Mapping Trends and Clusters. Lauren M. Scott, PhD Lauren Rosenshein Bennett, MS
 Spatial Pattern Analysis: Mapping Trends and Clusters Lauren M. Scott, PhD Lauren Rosenshein Bennett, MS Presentation Outline Spatial statistics overview Describing spatial patterns Quantifying spatial
Concepts and Applications of Kriging
 2013 Esri International User Conference July 8 12, 2013 San Diego, California Technical Workshop Concepts and Applications of Kriging Eric Krause Konstantin Krivoruchko Outline Intro to interpolation Exploratory
Concepts and Applications of Kriging
 Esri International User Conference San Diego, California Technical Workshops July 24, 2012 Concepts and Applications of Kriging Konstantin Krivoruchko Eric Krause Outline Intro to interpolation Exploratory
Local Spatial Autocorrelation Clusters
 Local Spatial Autocorrelation Clusters Luc Anselin http://spatial.uchicago.edu LISA principle local Moran local G statistics issues and interpretation LISA Principle Clustering vs Clusters global spatial
Final Project: An Income and Education Study of Washington D.C.
 Final Project: An Income and Education Study of Washington D.C. Barbara J. McKay Archibald Geography 586 Dr. Justine Blanford 12 December, 2009 As the seat of the United States Federal Government, Washington
Geodatabase An Introduction
 Federal GIS Conference 2014 February 10 11, 2014 Washington DC Geodatabase An Introduction Ralph Denkenberger esri Session Path The Geodatabase - What is it? - Why use it? - What types are there? Inside
Exploratory Spatial Data Analysis Using GeoDA: : An Introduction
 Exploratory Spatial Data Analysis Using GeoDA: : An Introduction Prepared by Professor Ravi K. Sharma, University of Pittsburgh Modified for NBDPN 2007 Conference Presentation by Professor Russell S. Kirby,
Network Analysis Services in ArcGIS Enterprise. Deelesh Mandloi
 Network Analysis Services in ArcGIS Enterprise Deelesh Mandloi Slides from this demo theater http://esriurl.com/uc17nas Agenda Network Analyst concepts ArcGIS Enterprise publishing workflow - Geoprocessing
Temporal vs. Spatial Data
 Temporal vs. Spatial Data Temporal 1 dimensional Units: day, week, month Lag: t, t-1, t-2 Durbin-Watson Spatial 2-3 dimensional Units: county, mile, region Lag: near neighbor, networks (?) Moran s I Differencing
The Implementation of Autocorrelation-Based Regioclassification in ArcMap Using ArcObjects
 140 The Implementation of Autocorrelation-Based Regioclassification in ArcMap Using ArcObjects Christoph MAYRHOFER Abstract Conventional methods for cartographic classification are often solely based on
Metadata for Supporting Spatial Data on the Web. Marten Hogeweg & Satish Sankaran
 Metadata for Supporting Spatial Data on the Web Marten Hogeweg & Satish Sankaran Tim Berners Lee s rating system for the WWW Published Accessible Discoverable Associations Data is released Data is structured
SASI Spatial Analysis SSC Meeting Aug 2010 Habitat Document 5
 OBJECTIVES The objectives of the SASI Spatial Analysis were to (1) explore the spatial structure of the asymptotic area swept (z ), (2) define clusters of high and low z for each gear type, (3) determine
Application of the Getis-Ord Gi* statistic (Hot Spot Analysis) to seafloor organisms
 to seafloor organisms") Application of the Getis-Ord Gi* statistic (Hot Spot Analysis) to seafloor organisms Diana Watters Research Fisheries Biologist Habitat Ecology Team Santa Cruz, CA Southwest Fisheries Science Center Fisheries
Application of the Getis-Ord Gi* statistic (Hot Spot Analysis) to seafloor organisms Diana Watters Research Fisheries Biologist Habitat Ecology Team Santa Cruz, CA Southwest Fisheries Science Center Fisheries
Identification of Regional Subcenters Using Spatial Data Analysis for Estimating Traffic Volume
 Identification of Regional Subcenters Using Spatial Data Analysis for Estimating Traffic Volume Fang Zhao and Nokil Park Lehman Center for Transportation Research Department of Civil & Env.. Engineering
SPACE Workshop NSF NCGIA CSISS UCGIS SDSU. Aldstadt, Getis, Jankowski, Rey, Weeks SDSU F. Goodchild, M. Goodchild, Janelle, Rebich UCSB
 SPACE Workshop NSF NCGIA CSISS UCGIS SDSU Aldstadt, Getis, Jankowski, Rey, Weeks SDSU F. Goodchild, M. Goodchild, Janelle, Rebich UCSB August 2-8, 2004 San Diego State University Some Examples of Spatial
Dr Arulsivanathan Naidoo Statistics South Africa 18 October 2017
 ESRI User Conference 2017 Space Time Pattern Mining Analysis of Matric Pass Rates in Cape Town Schools Dr Arulsivanathan Naidoo Statistics South Africa 18 October 2017 Choose one of the following Leadership
Spatial analysis of electricity demand patterns in Greece: Application of a GIS-based methodological framework
 Session ERE3.8/HS5.7: Renewable energy and environmental systems: modelling, control and management for a sustainable future Spatial analysis of electricity demand patterns in Greece: Application of a
Introduction to ArcGIS Maps for Office. Greg Ponto Scott Ball
 Introduction to ArcGIS Maps for Office Greg Ponto Scott Ball Agenda What is Maps for Office? Platform overview What are Apps for the Office? ArcGIS Maps for Office features - Visualization - Geoenrichment
Mapping and Analysis for Spatial Social Science
 Mapping and Analysis for Spatial Social Science Luc Anselin Spatial Analysis Laboratory Dept. Agricultural and Consumer Economics University of Illinois, Urbana-Champaign http://sal.agecon.uiuc.edu Outline
ArcGIS Data Reviewer: Quality Assessment for Elevation Raster Datasets. Roslyn Dunn
 ArcGIS Data Reviewer: Quality Assessment for Elevation Raster Datasets Roslyn Dunn What is ArcGIS Data Reviewer? Data Quality Management for ArcGIS Provides - Rule-based validation - Interactive tools
ArcGIS Data Reviewer: Assessing Positional Accuracy. Roslyn Dunn
 ArcGIS Data Reviewer: Assessing Positional Accuracy Roslyn Dunn What is ArcGIS Data Reviewer? Data Quality Management for ArcGIS Provides - Rule-based validation - Interactive tools - Track errors Validate
Spatial Analysis and Modeling (GIST 4302/5302) Guofeng Cao Department of Geosciences Texas Tech University
 Guofeng Cao Department of Geosciences Texas Tech University") Spatial Analysis and Modeling (GIST 4302/5302) Guofeng Cao Department of Geosciences Texas Tech University TTU Graduate Certificate Geographic Information Science and Technology (GIST) 3 Core Courses and
Spatial Analysis and Modeling (GIST 4302/5302) Guofeng Cao Department of Geosciences Texas Tech University TTU Graduate Certificate Geographic Information Science and Technology (GIST) 3 Core Courses and
In matrix algebra notation, a linear model is written as
 DM3 Calculation of health disparity Indices Using Data Mining and the SAS Bridge to ESRI Mussie Tesfamicael, University of Louisville, Louisville, KY Abstract Socioeconomic indices are strongly believed
Everything is related to everything else, but near things are more related than distant things.
 SPATIAL ANALYSIS DR. TRIS ERYANDO, MA Everything is related to everything else, but near things are more related than distant things. (attributed to Tobler) WHAT IS SPATIAL DATA? 4 main types event data,
This lab exercise will try to answer these questions using spatial statistics in a geographic information system (GIS) context.
 context.") by Introduction Problem Do the patterns of forest fires change over time? Do forest fires occur in clusters, and do the clusters change over time? Is this information useful in fighting forest fires? This
by Introduction Problem Do the patterns of forest fires change over time? Do forest fires occur in clusters, and do the clusters change over time? Is this information useful in fighting forest fires? This
Analyzing the Geospatial Rates of the Primary Care Physician Labor Supply in the Contiguous United States
 Analyzing the Geospatial Rates of the Primary Care Physician Labor Supply in the Contiguous United States By Russ Frith Advisor: Dr. Raid Amin University of W. Florida Capstone Project in Statistics April,
Introduction to Spatial Analysis in ArcGIS Online. Jian Lange, Vicki Lynn Cove
 Introduction to Spatial Analysis in ArcGIS Online Jian Lange, Vicki Lynn Cove Topics Introducing ArcGIS Online Spatial Analysis ArcGIS Online Spatial Analysis Workflow Demos and examples - Using ArcGIS
Spatial analysis. Spatial descriptive analysis. Spatial inferential analysis:
 Spatial analysis Spatial descriptive analysis Point pattern analysis (minimum bounding box, mean center, weighted mean center, standard distance, nearest neighbor analysis) Spatial clustering analysis
Michael Harrigan Office hours: Fridays 2:00-4:00pm Holden Hall
 Announcement New Teaching Assistant Michael Harrigan Office hours: Fridays 2:00-4:00pm Holden Hall 209 Email: michael.harrigan@ttu.edu Guofeng Cao, Texas Tech GIST4302/5302, Lecture 2: Review of Map Projection
HUMAN CAPITAL CATEGORY INTERACTION PATTERN TO ECONOMIC GROWTH OF ASEAN MEMBER COUNTRIES IN 2015 BY USING GEODA GEO-INFORMATION TECHNOLOGY DATA
 International Journal of Civil Engineering and Technology (IJCIET) Volume 8, Issue 11, November 2017, pp. 889 900, Article ID: IJCIET_08_11_089 Available online at http://http://www.iaeme.com/ijciet/issues.asp?jtype=ijciet&vtype=8&itype=11
This report details analyses and methodologies used to examine and visualize the spatial and nonspatial
 Analysis Summary: Acute Myocardial Infarction and Social Determinants of Health Acute Myocardial Infarction Study Summary March 2014 Project Summary :: Purpose This report details analyses and methodologies
ArcGIS for Geostatistical Analyst: An Introduction. Steve Lynch and Eric Krause Redlands, CA.
 ArcGIS for Geostatistical Analyst: An Introduction Steve Lynch and Eric Krause Redlands, CA. Outline - What is geostatistics? - What is Geostatistical Analyst? - Spatial autocorrelation - Geostatistical
Outline ESDA. Exploratory Spatial Data Analysis ESDA. Luc Anselin
 Exploratory Spatial Data Analysis ESDA Luc Anselin University of Illinois, Urbana-Champaign http://www.spacestat.com Outline ESDA Exploring Spatial Patterns Global Spatial Autocorrelation Local Spatial
Introduction to Spatial Statistics and Modeling for Regional Analysis
 Introduction to Spatial Statistics and Modeling for Regional Analysis Dr. Xinyue Ye, Assistant Professor Center for Regional Development (Department of Commerce EDA University Center) & School of Earth,
GIS Test Drive What a Geographic Information System Is and What it Can Do. Alison Davis-Holland
 GIS Test Drive What a Geographic Information System Is and What it Can Do Alison Davis-Holland adavisholland@gmail.com WHO AM I? Geospatial Analyst M.S. in Geographic and Cartographic Sciences Use GIS
Spatial Analysis 1. Introduction
 Spatial Analysis 1 Introduction Geo-referenced Data (not any data) x, y coordinates (e.g., lat., long.) ------------------------------------------------------ - Table of Data: Obs. # x y Variables -------------------------------------
GIST 4302/5302: Spatial Analysis and Modeling
 GIST 4302/5302: Spatial Analysis and Modeling Spring 2016 Lectures: Tuesdays & Thursdays 12:30pm-1:20pm, Science 234 Labs: GIST 4302: Monday 1:00-2:50pm or Tuesday 2:00-3:50pm GIST 5302: Wednesday 2:00-3:50pm
The Use of Local Moran s I in Determining the Effectiveness of Location for Gas Extraction
 Lauren Heller GIS and GPS Applications in Earth Science December 7, 2009 The Use of Local Moran s I in Determining the Effectiveness of Location for Gas Extraction The base map of gas production in Yuma
Esri Defense Mapping: Cartographic Production. Bo King
 Esri Defense Mapping: Cartographic Production Bo King Agenda Esri Defense Mapping: Cartographic Production Solution Overview Desktop Cartographic Production Workflow - Create Rapid Graphic Product On Demand
A GEOSTATISTICAL APPROACH TO PREDICTING A PHYSICAL VARIABLE THROUGH A CONTINUOUS SURFACE
 Katherine E. Williams University of Denver GEOG3010 Geogrpahic Information Analysis April 28, 2011 A GEOSTATISTICAL APPROACH TO PREDICTING A PHYSICAL VARIABLE THROUGH A CONTINUOUS SURFACE Overview Data
GIST 4302/5302: Spatial Analysis and Modeling
 GIST 4302/5302: Spatial Analysis and Modeling Spring 2014 Lectures: Tuesdays & Thursdays 2:00pm-2:50pm, Holden Hall 00038 Lab sessions: Tuesdays or Thursdays 3:00pm-4:50pm or Wednesday 1:00pm-2:50pm, Holden
Spatial Analysis with ArcGIS Pro STUDENT EDITION
 Spatial Analysis with ArcGIS Pro STUDENT EDITION Copyright 2018 Esri All rights reserved. Course version 2.0. Version release date November 2018. Printed in the United States of America. The information
Administering Your Enterprise Geodatabase using Python. Gerhard Trichtl
 Administering Your Enterprise Geodatabase using Python Gerhard Trichtl What is the Geodatabase What is the Geodatabase A physical store of geographic data - Scalable storage model supported on different
Spatial Autocorrelation (2) Spatial Weights
 Spatial Weights") Spatial Autocorrelation (2) Spatial Weights Luc Anselin Spatial Analysis Laboratory Dept. Agricultural and Consumer Economics University of Illinois, Urbana-Champaign http://sal.agecon.uiuc.edu Outline
Spatial Autocorrelation (2) Spatial Weights Luc Anselin Spatial Analysis Laboratory Dept. Agricultural and Consumer Economics University of Illinois, Urbana-Champaign http://sal.agecon.uiuc.edu Outline
Spatial Data Mining. Regression and Classification Techniques
 Spatial Data Mining Regression and Classification Techniques 1 Spatial Regression and Classisfication Discrete class labels (left) vs. continues quantities (right) measured at locations (2D for geographic
ArcGIS API for Python for Data Scientists. Andrew Chapkowski Alberto Nieto
 ArcGIS API for Python for Data Scientists Andrew Chapkowski Alberto Nieto Analysts, Data Scientists and Developers Source: PyCon India 2018 Python And Data: Past, Present And Future By Peter Wang Why
Where to Invest Affordable Housing Dollars in Polk County?: A Spatial Analysis of Opportunity Areas
 Resilient Neighborhoods Technical Reports and White Papers Resilient Neighborhoods Initiative 6-2014 Where to Invest Affordable Housing Dollars in Polk County?: A Spatial Analysis of Opportunity Areas
Spatial Data, Spatial Analysis and Spatial Data Science
 Spatial Data, Spatial Analysis and Spatial Data Science Luc Anselin http://spatial.uchicago.edu 1 spatial thinking in the social sciences spatial analysis spatial data science spatial data types and research
An Introduction to Spatial Autocorrelation and Kriging
 An Introduction to Spatial Autocorrelation and Kriging Matt Robinson and Sebastian Dietrich RenR 690 Spring 2016 Tobler and Spatial Relationships Tobler s 1 st Law of Geography: Everything is related to
EXPLORATORY SPATIAL DATA ANALYSIS OF BUILDING ENERGY IN URBAN ENVIRONMENTS. Food Machinery and Equipment, Tianjin , China
 EXPLORATORY SPATIAL DATA ANALYSIS OF BUILDING ENERGY IN URBAN ENVIRONMENTS Wei Tian 1,2, Lai Wei 1,2, Pieter de Wilde 3, Song Yang 1,2, QingXin Meng 1 1 College of Mechanical Engineering, Tianjin University
Mapping For Wellness: Then and Now
 Mapping For Wellness: Then and Now John Ritter, Ph.D. Geomatics Dept. Oregon Institute of Technology Klamath Falls, OR 97601 John.Ritter@oit.edu Sponsors 1 Objectives Understand how medical mapping can
Output: -Observed Mean Distance -Expected Mean Distance - Nearest Neighbor Index -Graphic report - Test variables:
 Clustering: global indexes (to measure the global degree of clustering for the whole set of events) -> methods based on quadrats (joint count) vs. on distances AVERAGE NEAREST NEIGHBOUR: the distance between
Spatial Data Analysis with ArcGIS Desktop: From Basic to Advance
 Spatial Data Analysis with ArcGIS Desktop: From Basic to Advance 1. Course overview Modern environmental, energy as well as resource modeling and planning require huge amount of geographically located
GIST 4302/5302: Spatial Analysis and Modeling Lecture 2: Review of Map Projections and Intro to Spatial Analysis
 GIST 4302/5302: Spatial Analysis and Modeling Lecture 2: Review of Map Projections and Intro to Spatial Analysis Guofeng Cao http://www.spatial.ttu.edu Department of Geosciences Texas Tech University guofeng.cao@ttu.edu
Community Health Needs Assessment through Spatial Regression Modeling
 Community Health Needs Assessment through Spatial Regression Modeling Glen D. Johnson, PhD CUNY School of Public Health glen.johnson@lehman.cuny.edu Objectives: Assess community needs with respect to particular
GIST 4302/5302: Spatial Analysis and Modeling
 GIST 4302/5302: Spatial Analysis and Modeling Lecture 2: Review of Map Projections and Intro to Spatial Analysis Guofeng Cao http://thestarlab.github.io Department of Geosciences Texas Tech University
Spatial Analysis 2. Spatial Autocorrelation
 Spatial Analysis 2 Spatial Autocorrelation Spatial Autocorrelation a relationship between nearby spatial units of the same variable If, for every pair of subareas i and j in the study region, the drawings
Basics of Geographic Analysis in R
 Basics of Geographic Analysis in R Spatial Autocorrelation and Spatial Weights Yuri M. Zhukov GOV 2525: Political Geography February 25, 2013 Outline 1. Introduction 2. Spatial Data and Basic Visualization
Identification of Economic Clusters Using ArcGIS Spatial Statistics. Joseph Frizado Bruce Smith Michael Carroll
 Identification of Economic Clusters Using ArcGIS Spatial Statistics Joseph Frizado Bruce Smith Michael Carroll ABSTRACT Geographic proximity (co-location) is necessary for potential clustering activity.
CSISS Tools and Spatial Analysis Software
 CSISS Tools and Spatial Analysis Software June 5, 2006 Stephen A. Matthews Associate Professor of Sociology & Anthropology, Geography and Demography Director of the Geographic Information Analysis Core
ArcGIS Enterprise: What s New. Philip Heede Shannon Kalisky Melanie Summers Sam Williamson
 ArcGIS Enterprise: What s New Philip Heede Shannon Kalisky Melanie Summers Sam Williamson ArcGIS Enterprise is the new name for ArcGIS for Server What is ArcGIS Enterprise ArcGIS Enterprise is powerful
Lecture 8. Spatial Estimation
 Lecture 8 Spatial Estimation Lecture Outline Spatial Estimation Spatial Interpolation Spatial Prediction Sampling Spatial Interpolation Methods Spatial Prediction Methods Interpolating Raster Surfaces
Esri Production Mapping: Map Automation & Advanced Cartography MADHURA PHATERPEKAR JOE SHEFFIELD
 Esri Production Mapping: Map Automation & Advanced Cartography MADHURA PHATERPEKAR JOE SHEFFIELD Traditional Cartography What you really want Cartographic Workflow Output Cartographic Data Symbology Layout
Exploratory Spatial Data Analysis (And Navigating GeoDa)
") Exploratory Spatial Data Analysis (And Navigating GeoDa) June 9, 2006 Stephen A. Matthews Associate Professor of Sociology & Anthropology, Geography and Demography Director of the Geographic Information
Exploratory Spatial Data Analysis (And Navigating GeoDa) June 9, 2006 Stephen A. Matthews Associate Professor of Sociology & Anthropology, Geography and Demography Director of the Geographic Information
An Overview of Solving Spatial Problems Using ArcGIS
 Esri International User Conference San Diego, CA Technical Workshops An Overview of Solving Spatial Problems Using ArcGIS Linda Beale, Jian Lange July 12 th, 2011 Real World Example Using Spatial Analysis
The Geography of Social Change
 The Geography of Social Change Alessandra Fogli Stefania Marcassa VERY PRELIMINARY DRAFT Abstract We investigate how and when social change arises. We use data on the spatial diffusion of the fertility
Lecture 5 Geostatistics
 Lecture 5 Geostatistics Lecture Outline Spatial Estimation Spatial Interpolation Spatial Prediction Sampling Spatial Interpolation Methods Spatial Prediction Methods Interpolating Raster Surfaces with
Demographic Data in ArcGIS. Harry J. Moore IV
 Demographic Data in ArcGIS Harry J. Moore IV Outline What is demographic data? Esri Demographic data - Real world examples with GIS - Redistricting - Emergency Preparedness - Economic Development Next
Kernel Density Estimation (KDE) vs. Hot-Spot Analysis - Detecting Criminal Hot Spots in the City of San Francisco
 vs. Hot-Spot Analysis - Detecting Criminal Hot Spots in the City of San Francisco") Kernel Density Estimation (KDE) vs. Hot-Spot Analysis - Detecting Criminal Hot Spots in the City of San Francisco Maja Kalinic University of Augsburg/Department for Applied Geoinformatics Alter Postweg
Kernel Density Estimation (KDE) vs. Hot-Spot Analysis - Detecting Criminal Hot Spots in the City of San Francisco Maja Kalinic University of Augsburg/Department for Applied Geoinformatics Alter Postweg
Working Paper No Introduction to Spatial Econometric Modelling. William Mitchell 1. April 2013
 Working Paper No. 01-13 Introduction to Spatial Econometric Modelling William Mitchell 1 April 2013 Centre of Full Employment and Equity The University of Newcastle, Callaghan NSW 2308, Australia Home
GIS and Spatial Statistics: One World View or Two? Michael F. Goodchild University of California Santa Barbara
 GIS and Spatial Statistics: One World View or Two? Michael F. Goodchild University of California Santa Barbara Location as attribute The data table Census summary table What value is location as an explanatory
ArcGIS Platform For NSOs
 ArcGIS Platform For NSOs Applying GIS and Spatial Thinking to Official Statistics Esri UC 2014 Demo Theater Applying GIS at the NSO Generic Statistical Business Process Model (GSBPM) 1 Specify Needs 2
Testing for global spatial autocorrelation in Stata
 Testing for global spatial autocorrelation in Stata Keisuke Kondo March 31, 2018 (moransi: version 1.00) Abstract This paper introduces the new Stata command moransi, which computes Moran s I statistic