Sensitivity of estimates of travel distance and travel time to street network data quality
|
|
|
- Marcus Barton
- 5 years ago
- Views:
Transcription
1 Sensitivity of estimates of travel distance and travel time to street network data quality Paul Zandbergen Department of Geography University of New Mexico
2 Outline Street network quality Approaches to validation Study design Results Conclusions Future work

3 Study Objective
4 Street Network Quality Positional accuracy Completeness Connectivity Restrictions (one-way, turns) Speed limit Traffic conditions Traffic signals Lane representations Individual intersections

5 Intersections Source: Turner-Fairbank Highway Research Center Source: TTM Traffic Engineering Group

6 Typical Network Data (in US) Commercial providers TIGER from the US Census Bureau Local agencies (counties, cities)
7 Validation of Street Network Data Quality 1. Test individual network components E.g. measure positional accuracy, reliability of attributes, etc. 2. Test network analysis output E.g. compare network travel times to tracking data of vehicles 3. Compare network analysis output to gold standard E.g. use higher quality data
 55 GPS receivers /")


8 Microsoft Multiperson Location Survey (MSMLS) 55 GPS receivers / 226 subjects 12,418 trips / 95,000 miles Basis for Microsoft s Clearflow technology in maps.live.com Greater Seattle Seattle Downtown Close-up

9 Study Objective Determine the agreement in street network routing solutions between two network datasets of different quality
10 Street Network Datasets Two street networks of different quality for Travis County, Texas: 1. StreetMap USA 2005, a widely employed dataset that is provided with popular GIS software 2. Network derived from local street centerlines created by local authorities. For the purpose of this analysis the network derived from local street centerlines is considered the gold standard.
11
12 Analysis Methods Origins: 3,000 residential address locations (building centroids) Destinations: Hospitals (9) Emergency Medical Services (32) Elementary Schools (169) Network solutions: Shortest travel distance Shortest travel time Comparisons: Agreement in distance and time estimates Agreement in nearest facility Agreement in spatial accessibility measures
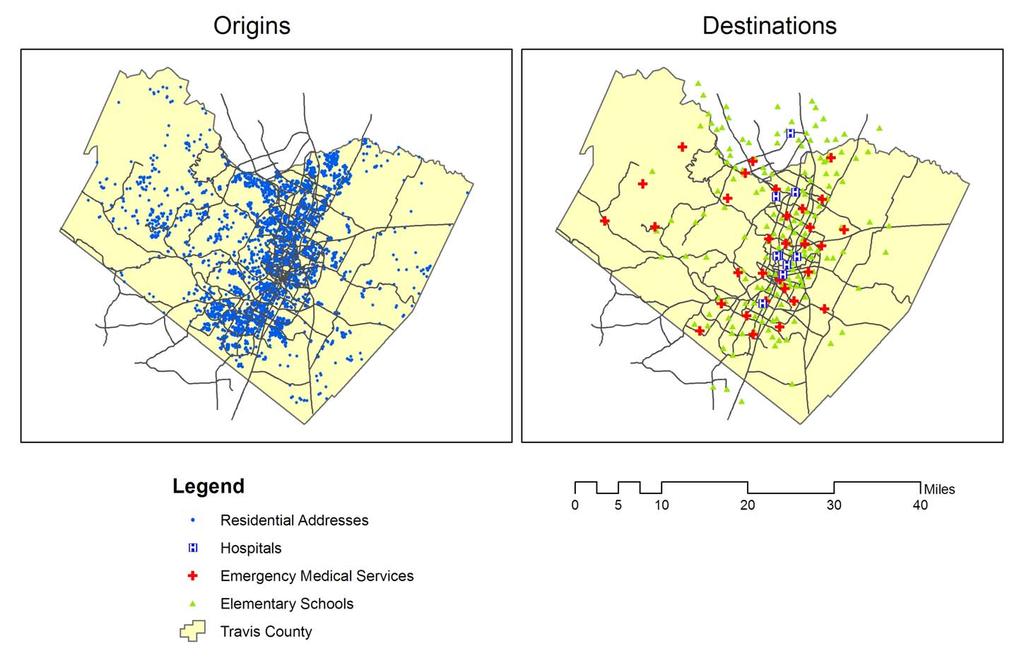
13 Spatial Distribution
14 Descriptive Statistics Median Average Max Min Time (minutes) Median Average Max Min StreetMap USA 2005 Gold Standard StreetMap USA 2005 Gold Standard StreetMap USA 2005 Gold Standard Distance (miles) Hospitals EMS Elementary Schools Metric
15 Correlation Example StreetMap USA travel time (min) y = x R 2 = Austin Network travel time (min)
16 Regression Results Facility Type Distance Time R-square Slope R-square Slope Elementary Schools EMS Hospitals Overestimate of travel time Agreement stronger for distance Agreement is stronger for greater distances/times
17 Addresses Routed to Incorrect Facility Facility Type Elementary Schools EMS Hospitals Distance 8.2 % 8.7 % 11.0 % Time 10.4 % 14.0 % 10.9 % Error larger for shortest travel time Error similar across different distance/time scales
18 Addresses Assigned Incorrectly to Travel Thresholds Facility Type Gold Standard StreetMap USA 2005 % Correct Positives % False Positives % False Negatives Elementary Schools - Minutes EMS - Minutes Hospital - Minutes
19 Conclusions Strong correlations for estimated travel distances/times between high and low quality network Substantial number of incorrectly routed addresses (~10%) Greater discrepancy in travel time estimates vs. distance estimates Resolution of low quality network ~ 1 to 2 minutes


20 Ongoing Work - Online Networks
21 Ongoing Work - Online Networks Functionality has increased dramatically Basic (from A to B) expanded to include multiple stops Routing options (time or distance, avoid highways) General data quality improvements Multi-modal networks (selective) Still limited in other aspects No complex routing solutions Limited origin-destination combinations No quality information published
22 Example Result Online Network (min) Austin Network (min)

23 Ongoing Work Car Navigation Systems


24 Ongoing Work Car Navigation Systems
Error propagation models dlto examine the effects of geocoding quality on spatial analysis of individual level datasets
 Error propagation models dlto examine the effects of geocoding quality on spatial analysis of individual level datasets P.A. Zandbergen 1, T.C. Hart 2, K.E. Lenzer 1 and M.E. Camponovo 1 1 Department tof
Mapping Accessibility Over Time
 Journal of Maps, 2006, 76-87 Mapping Accessibility Over Time AHMED EL-GENEIDY and DAVID LEVINSON University of Minnesota, 500 Pillsbury Drive S.E., Minneapolis, MN 55455, USA; geneidy@umn.edu (Received
GIS ANALYSIS METHODOLOGY
 GIS ANALYSIS METHODOLOGY No longer the exclusive domain of cartographers, computer-assisted drawing technicians, mainframes, and workstations, geographic information system (GIS) mapping has migrated to
GIS and Remote Sensing Support for Evacuation Analysis
 GIS and Remote Sensing Support for Evacuation Analysis Presented to GIS for Transportation Symposium Rapid City, South Dakota March 28-31, 2004 Demin Xiong Oak Ridge National Laboratory 2360 Cherahala
A critique of the National Standard for Spatial Data Accuracy. Paul Zandbergen Department of Geography University of New Mexico
 A critique of the National Standard for Spatial Data Accuracy Paul Zandbergen Department of Geography University of New Mexico Warning: Statistics Ahead! Spatial Data Quality Matters! Plane took off on
Neighborhood Locations and Amenities
 University of Maryland School of Architecture, Planning and Preservation Fall, 2014 Neighborhood Locations and Amenities Authors: Cole Greene Jacob Johnson Maha Tariq Under the Supervision of: Dr. Chao
WOODRUFF ROAD CORRIDOR ORIGIN-DESTINATION ANALYSIS
 2018 WOODRUFF ROAD CORRIDOR ORIGIN-DESTINATION ANALYSIS Introduction Woodruff Road is the main road to and through the commercial area in Greenville, South Carolina. Businesses along the corridor have
APPENDIX IV MODELLING
 APPENDIX IV MODELLING Kingston Transportation Master Plan Final Report, July 2004 Appendix IV: Modelling i TABLE OF CONTENTS Page 1.0 INTRODUCTION... 1 2.0 OBJECTIVE... 1 3.0 URBAN TRANSPORTATION MODELLING
Utilizing GIS Technology for Rockland County. Rockland County Planning Department Douglas Schuetz & Scott Lounsbury
 Utilizing GIS Technology for Rockland County Rockland County Planning Department Douglas Schuetz & Scott Lounsbury Presentation Agenda Introduction What is GIS What can GIS do GIS Efforts for BOE Resources
City of Saginaw Right of Way Division Snow and Ice Removal Policy January 18, 2016
 Snow and Ice Removal Policy January 18, 2016 It is the policy of the to provide snowplowing and ice removal services in order to: Provide safe traveling conditions for motorists and pedestrians Assist
Appendixx C Travel Demand Model Development and Forecasting Lubbock Outer Route Study June 2014
 Appendix C Travel Demand Model Development and Forecasting Lubbock Outer Route Study June 2014 CONTENTS List of Figures-... 3 List of Tables... 4 Introduction... 1 Application of the Lubbock Travel Demand
Understanding Land Use and Walk Behavior in Utah
 Understanding Land Use and Walk Behavior in Utah 15 th TRB National Transportation Planning Applications Conference Callie New GIS Analyst + Planner STUDY AREA STUDY AREA 11 statistical areas (2010 census)
Figure 8.2a Variation of suburban character, transit access and pedestrian accessibility by TAZ label in the study area
 Figure 8.2a Variation of suburban character, transit access and pedestrian accessibility by TAZ label in the study area Figure 8.2b Variation of suburban character, commercial residential balance and mix
Lecture 9: Geocoding & Network Analysis
 Massachusetts Institute of Technology - Department of Urban Studies and Planning 11.520: A Workshop on Geographic Information Systems 11.188: Urban Planning and Social Science Laboratory Lecture 9: Geocoding
GIS Analysis of Crenshaw/LAX Line
 PDD 631 Geographic Information Systems for Public Policy, Planning & Development GIS Analysis of Crenshaw/LAX Line Biying Zhao 6679361256 Professor Barry Waite and Bonnie Shrewsbury May 12 th, 2015 Introduction
CIV3703 Transport Engineering. Module 2 Transport Modelling
 CIV3703 Transport Engineering Module Transport Modelling Objectives Upon successful completion of this module you should be able to: carry out trip generation calculations using linear regression and category
BROOKINGS May
 Appendix 1. Technical Methodology This study combines detailed data on transit systems, demographics, and employment to determine the accessibility of jobs via transit within and across the country s 100
Travel Time Calculation With GIS in Rail Station Location Optimization
 Travel Time Calculation With GIS in Rail Station Location Optimization Topic Scope: Transit II: Bus and Rail Stop Information and Analysis Paper: # UC8 by Sutapa Samanta Doctoral Student Department of
Visitor Flows Model for Queensland a new approach
 Visitor Flows Model for Queensland a new approach Jason. van Paassen 1, Mark. Olsen 2 1 Parsons Brinckerhoff Australia Pty Ltd, Brisbane, QLD, Australia 2 Tourism Queensland, Brisbane, QLD, Australia 1
presents challenges related to utility infrastructure planning. Many of these challenges
 1 Introduction: - a. Purpose According to U.S. Census Bureau the population of stark county was 367,585 in 1990, and in 2000 it was increase to 378,098. Thus County is experiencing a growth that presents
SBCAG Travel Model Upgrade Project 3rd Model TAC Meeting. Jim Lam, Stewart Berry, Srini Sundaram, Caliper Corporation December.
 SBCAG Travel Model Upgrade Project 3rd Model TAC Meeting Jim Lam, Stewart Berry, Srini Sundaram, Caliper Corporation December. 7, 2011 1 Outline Model TAZs Highway and Transit Networks Land Use Database
VALIDATING THE RELATIONSHIP BETWEEN URBAN FORM AND TRAVEL BEHAVIOR WITH VEHICLE MILES TRAVELLED. A Thesis RAJANESH KAKUMANI
 VALIDATING THE RELATIONSHIP BETWEEN URBAN FORM AND TRAVEL BEHAVIOR WITH VEHICLE MILES TRAVELLED A Thesis by RAJANESH KAKUMANI Submitted to the Office of Graduate Studies of Texas A&M University in partial
why is a national or regional context important?
 The need Accessibility to opportunities, Efficient movement of people and goods, Environmental Health Strength and competitiveness of the economy, Availability and cost of energy, Safety and Security,
Typical information required from the data collection can be grouped into four categories, enumerated as below.
 Chapter 6 Data Collection 6.1 Overview The four-stage modeling, an important tool for forecasting future demand and performance of a transportation system, was developed for evaluating large-scale infrastructure
Outline. 15. Descriptive Summary, Design, and Inference. Descriptive summaries. Data mining. The centroid
 Outline 15. Descriptive Summary, Design, and Inference Geographic Information Systems and Science SECOND EDITION Paul A. Longley, Michael F. Goodchild, David J. Maguire, David W. Rhind 2005 John Wiley
2014 Certification Review Regional Data & Modeling
 2014 Certification Review Regional Data & Modeling July 22, 2014 Regional Data Census Program Coordination PAG works with and for member agencies to ensure full participation in all Census Bureau programs
Speakers: Jeff Price, Federal Transit Administration Linda Young, Center for Neighborhood Technology Sofia Becker, Center for Neighborhood Technology
 Speakers: Jeff Price, Federal Transit Administration Linda Young, Center for Neighborhood Technology Sofia Becker, Center for Neighborhood Technology Peter Haas, Center for Neighborhood Technology Craig
If you aren t familiar with Geographical Information Systems (GIS), you. GIS, when combined with a database that stores response information,
, you. GIS, when combined with a database that stores response information,") Geographical Information Systems in EMS By William E. Ott If you aren t familiar with Geographical Information Systems (GIS), you should take a look at what GIS can offer you as an EMS manager. GIS, when
Geographical Information Systems in EMS By William E. Ott If you aren t familiar with Geographical Information Systems (GIS), you should take a look at what GIS can offer you as an EMS manager. GIS, when
GIS for the Non-Expert
 GIS for the Non-Expert Ann Forsyth University of Minnesota February 2006 GIS for the Non-Expert 1. Definitions and problems 2. Measures being tested in Twin Cities Walking Study Basic approach, data, variables
Internet GIS Sites. 2 OakMapper webgis Application
 Internet GIS Sites # Name URL Description 1 City of Sugar Land http://www.sugarlandtx.gov/index.htm It is a city in Texas with 65,000 Residents. The City of Sugar Land, Texas, provides ArcIMS-based maps
Data Collection. Lecture Notes in Transportation Systems Engineering. Prof. Tom V. Mathew. 1 Overview 1
 Data Collection Lecture Notes in Transportation Systems Engineering Prof. Tom V. Mathew Contents 1 Overview 1 2 Survey design 2 2.1 Information needed................................. 2 2.2 Study area.....................................
Exploring Human Mobility with Multi-Source Data at Extremely Large Metropolitan Scales. ACM MobiCom 2014, Maui, HI
 Exploring Human Mobility with Multi-Source Data at Extremely Large Metropolitan Scales Desheng Zhang & Tian He University of Minnesota, USA Jun Huang, Ye Li, Fan Zhang, Chengzhong Xu Shenzhen Institute
URBAN TRANSPORTATION SYSTEM (ASSIGNMENT)
") BRANCH : CIVIL ENGINEERING SEMESTER : 6th Assignment-1 CHAPTER-1 URBANIZATION 1. What is Urbanization? Explain by drawing Urbanization cycle. 2. What is urban agglomeration? 3. Explain Urban Class Groups.
BRANCH : CIVIL ENGINEERING SEMESTER : 6th Assignment-1 CHAPTER-1 URBANIZATION 1. What is Urbanization? Explain by drawing Urbanization cycle. 2. What is urban agglomeration? 3. Explain Urban Class Groups.
By Abdulraheem M.Baabbad. Supervisor: Dr.Bager Al-Ramadan
 By Abdulraheem M.Baabbad Supervisor: Dr.Bager Al-Ramadan OUTLINE Health GIS Health GIS Application Emergency Vehicles Allocation: A case study Health GIS Innovative structureto access,integrate,visualize
Morgantown, West Virginia. Adaptive Control Evaluation, Deployment, & Management. Andrew P. Nichols, PhD, PE
 Morgantown, West Virginia Adaptive Control Evaluation, Deployment, & Management Andrew P. Nichols, PhD, PE Program Director of ITS Nick J. Rahall II, Appalachian Transportation Inst. Marshall University
Route Choice Analysis: Data, Models, Algorithms and Applications Emma Frejinger Thesis Supervisor: Michel Bierlaire
 p. 1/15 Emma Frejinger Thesis Supervisor: Michel Bierlaire p. 2/15 Which route would a given traveler take to go from one location to another in a transportation network? Car trips (uni-modal networks)
ArcGIS Online Routing and Network Analysis. Deelesh Mandloi Matt Crowder
 ArcGIS Online Routing and Network Analysis Deelesh Mandloi Matt Crowder Introductions Who are we? - Members of the Network Analyst development team Who are you? - Network Analyst users? - ArcGIS Online
Evaluating Travel Impedance Agreement among Online Road Network Data Providers
 Evaluating Travel Impedance Agreement among Online Road Network Data Providers Derek Marsh Eric Delmelle Coline Dony Department of Geography and Earth Sciences University of North Carolina at Charlotte
California Urban Infill Trip Generation Study. Jim Daisa, P.E.
 California Urban Infill Trip Generation Study Jim Daisa, P.E. What We Did in the Study Develop trip generation rates for land uses in urban areas of California Establish a California urban land use trip
Census Geography, Geographic Standards, and Geographic Information
 Census Geography, Geographic Standards, and Geographic Information Michael Ratcliffe Geography Division US Census Bureau New Mexico State Data Center Data Users Conference November 19, 2015 Today s Presentation
The effects of impact fees on urban form and congestion in Florida
 The effects of impact fees on urban form and congestion in Florida Principal Investigators: Andres G. Blanco Ruth Steiner Presenters: Hyungchul Chung Jeongseob Kim Urban and Regional Planning Contents
Flood Scenario Worksheet
 Flood Scenario Worksheet Scenario adapted from: http://www.epa.gov/watersecurity/tools/trainingcd/simple/source/scenario-8/ssc8-0.pdf Simple Tabletop Exercise, Interdependency Natural Disaster Scenario,
PlaceTypes. How the built environment is measured. Variables Measures Levels. AREA TYPE + DEVELOPMENT TYPE = PlaceType
 PlaceTypes In order to better understand land use and transportation interactions and to make more informed policy decisions, neighborhood characteristics can be analyzed by the role that they play in
Background of Project
 RELOCATION OF GRESHAM FIRE STATION #76 Mike Shelby Annie Scriven Andrea Consalus Background of Project Wanted to do a project that was meaningful Contacted Molly Vogt, GIS Manager at City of Gresham Informed
Indicator: Proportion of the rural population who live within 2 km of an all-season road
 Goal: 9 Build resilient infrastructure, promote inclusive and sustainable industrialization and foster innovation Target: 9.1 Develop quality, reliable, sustainable and resilient infrastructure, including
Assessing spatial distribution and variability of destinations in inner-city Sydney from travel diary and smartphone location data
 Assessing spatial distribution and variability of destinations in inner-city Sydney from travel diary and smartphone location data Richard B. Ellison 1, Adrian B. Ellison 1 and Stephen P. Greaves 1 1 Institute
Susan Clark NRS 509 Nov. 29, 2005
 Susan Clark NRS 509 Nov. 29, 2005 The original intent of this project was to look at the role of GIS in the inventory of bicycle and pedestrian facilities. The research, however, indicates a different
Service Area Analysis of Portland's METRO Bus System. Andy Smith-Petersen, University of Southern Maine -
 Andy Smith-Petersen, University of Southern Maine - andysp@usm.maine.edu METRO Background 8 routes serving Portland, South Portland, Falmouth and Westbrook 100,000+ passengers/month, +11% 1997-2005 (GPCOG/METRO,
Metrolinx Transit Accessibility/Connectivity Toolkit
 Metrolinx Transit Accessibility/Connectivity Toolkit Christopher Livett, MSc Transportation Planning Analyst Research and Planning Analytics Tweet about this presentation #TransitGIS OUTLINE 1. Who is
Expanding the GSATS Model Area into
 Appendix A Expanding the GSATS Model Area into North Carolina Jluy, 2011 Table of Contents LONG-RANGE TRANSPORTATION PLAN UPDATE 1. Introduction... 1 1.1 Background... 1 1.2 Existing Northern Extent of
Traffic Demand Forecast
 Chapter 5 Traffic Demand Forecast One of the important objectives of traffic demand forecast in a transportation master plan study is to examine the concepts and policies in proposed plans by numerically
NRS 509 Applications of GIS for Environmental Spatial Data Analysis Project. Fall 2005
 NRS 509 Applications of GIS for Environmental Spatial Data Analysis Project. Fall 2005 GIS in Urban and Regional Transportation Planning Alolade Campbell Department of Civil and Environmental Engineering
average rate of change
 average rate of change Module 2 : Investigation 5 MAT 170 Precalculus August 31, 2016 question 1 A car is driving away from a crosswalk. The distance d (in feet) of the car from the crosswalk t seconds
Transit Time Shed Analyzing Accessibility to Employment and Services
 Transit Time Shed Analyzing Accessibility to Employment and Services presented by Ammar Naji, Liz Thompson and Abdulnaser Arafat Shimberg Center for Housing Studies at the University of Florida www.shimberg.ufl.edu
Network Analysis Services in ArcGIS Enterprise. Deelesh Mandloi
 Network Analysis Services in ArcGIS Enterprise Deelesh Mandloi Slides from this demo theater http://esriurl.com/uc17nas Agenda Network Analyst concepts ArcGIS Enterprise publishing workflow - Geoprocessing
COMBINATION OF MACROSCOPIC AND MICROSCOPIC TRANSPORT SIMULATION MODELS: USE CASE IN CYPRUS
 International Journal for Traffic and Transport Engineering, 2014, 4(2): 220-233 DOI: http://dx.doi.org/10.7708/ijtte.2014.4(2).08 UDC: 656:519.87(564.3) COMBINATION OF MACROSCOPIC AND MICROSCOPIC TRANSPORT
Big Data Analysis to Measure Delays of Canadian Domestic and Cross-Border Truck Trips
 Big Data Analysis to Measure Delays of Canadian Domestic and Cross-Border Truck Trips Kevin Gingerich and Hanna Maoh University of Windsor Freight Day VI Symposium Hosted by the University of Toronto Transportation
The Cost of Hauling Timber: A Comparison of Raster- and Vector- Based Travel-Time Estimates in GIS
 Portland State University PDXScholar Geography Masters Research Papers Geography 2014 The Cost of Hauling Timber: A Comparison of Raster- and Vector- Based Travel-Time Estimates in GIS Sara M. Loreno Portland
Using GIS to Evaluate Rural Emergency Medical Services (EMS)
") Using GIS to Evaluate Rural Emergency Medical Services (EMS) Zhaoxiang He Graduate Research Assistant Xiao Qin Ph.D., P.E. Associate Professor Outline Introduction Literature Review Study Design Data Collection
Using GIS to Evaluate Rural Emergency Medical Services (EMS) Zhaoxiang He Graduate Research Assistant Xiao Qin Ph.D., P.E. Associate Professor Outline Introduction Literature Review Study Design Data Collection
STAR COMMUNITY RATING SYSTEM OBJECTIVE EE-4: EQUITABLE SERVICES & ACCESS COMMUNITY LEVEL OUTCOMES FOR KING COUNTY, WA
 STAR COMMUNITY RATING SYSTEM OBJECTIVE EE-4: EQUITABLE SERVICES & ACCESS COMMUNITY LEVEL OUTCOMES FOR KING COUNTY, WA OUTCOME I: EQUITABLE ACCESS AND PROXIMITY Background: This analysis has been developed
An online data and consulting resource of THE UNIVERSITY OF TOLEDO THE JACK FORD URBAN AFFAIRS CENTER
 An online data and consulting resource of THE JACK FORD URBAN AFFAIRS CENTER THE CENTER FOR GEOGRAPHIC INFORMATION SCIENCE AND APPLIED GEOGRAPHICS DEPARTMENT OF GEOGRAPHY AND PLANNING THE UNIVERSITY OF
Developing the Transit Demand Index (TDI) Gregory Newmark, Regional Transportation Authority Transport Chicago Presentation July 25, 2012
 Gregory Newmark, Regional Transportation Authority Transport Chicago Presentation July 25, 2012") Developing the Transit Demand Index (TDI) Gregory Newmark, Regional Transportation Authority Transport Chicago Presentation July 25, 2012 Outline Present RTA methodology Transit Demand Index (TDI) Demonstrate
Developing the Transit Demand Index (TDI) Gregory Newmark, Regional Transportation Authority Transport Chicago Presentation July 25, 2012 Outline Present RTA methodology Transit Demand Index (TDI) Demonstrate
Integrating GIS into Food Access Analysis
 GIS Day at Kansas University Integrating GIS into Food Access Analysis Daoqin Tong School of Geography and Development Outline Introduction Research questions Method Results Discussion Introduction Food
GIS SIMULATION AND VISUALIZATION OF COMMUNITY EVACUATION VULNERABILITY IN A CONNECTED GEOGRAPHIC NETWORK MODEL
 GIS SIMULATION AND VISUALIZATION OF COMMUNITY EVACUATION VULNERABILITY IN A CONNECTED GEOGRAPHIC NETWORK MODEL Tao Tang and Melissa Wannemacher Department of Geography and Planning Buffalo State College
INDOT Office of Traffic Safety
 Intro to GIS Spatial Analysis INDOT Office of Traffic Safety Intro to GIS Spatial Analysis INDOT Office of Traffic Safety Kevin Knoke Section 130 Program Manager Highway Engineer II Registered Professional
Integrated location-allocation of private car and public transport users Primary health care facility allocation in the Oulu Region of Finland
 Integrated location-allocation of private car and public transport users Primary health care facility allocation in the Oulu Region of Finland Ossi Kotavaara University of Oulu, Geography Research Unit,
FHWA/IN/JTRP-2008/1. Final Report. Jon D. Fricker Maria Martchouk
 FHWA/IN/JTRP-2008/1 Final Report ORIGIN-DESTINATION TOOLS FOR DISTRICT OFFICES Jon D. Fricker Maria Martchouk August 2009 Final Report FHWA/IN/JTRP-2008/1 Origin-Destination Tools for District Offices
APPENDIX I: Traffic Forecasting Model and Assumptions
 APPENDIX I: Traffic Forecasting Model and Assumptions Appendix I reports on the assumptions and traffic model specifications that were developed to support the Reaffirmation of the 2040 Long Range Plan.
SPATIAL ANALYSIS. Transformation. Cartogram Central. 14 & 15. Query, Measurement, Transformation, Descriptive Summary, Design, and Inference
 14 & 15. Query, Measurement, Transformation, Descriptive Summary, Design, and Inference Geographic Information Systems and Science SECOND EDITION Paul A. Longley, Michael F. Goodchild, David J. Maguire,
Optimizing Roadside Advertisement Dissemination in Vehicular CPS
 Optimizing Roadside Advertisement Dissemination in Vehicular CPS Huanyang Zheng and Jie Wu Computer and Information Sciences Temple University 1. Introduction Roadside Advertisement Dissemination Passengers,
of places Key stage 1 Key stage 2 describe places
 Unit 25 Geography and numbers ABOUT THE UNIT This continuous unit aims to show how geographical enquiry can provide a meaningful context for the teaching and reinforcement of many aspects of the framework
GIS-BASED VISUALIZATION FOR ESTIMATING LEVEL OF SERVICE Gozde BAKIOGLU 1 and Asli DOGRU 2
 Presented at the FIG Congress 2018, May 6-11, 2018 in Istanbul, Turkey GIS-BASED VISUALIZATION FOR ESTIMATING LEVEL OF SERVICE Gozde BAKIOGLU 1 and Asli DOGRU 2 1 Department of Transportation Engineering,
StanCOG Transportation Model Program. General Summary
 StanCOG Transportation Model Program Adopted By the StanCOG Policy Board March 17, 2010 What are Transportation Models? General Summary Transportation Models are technical planning and decision support
Spatial Thinking and Modeling of Network-Based Problems
 Spatial Thinking and Modeling of Network-Based Problems Presentation at the SPACE Workshop Columbus, Ohio, July 1, 25 Shih-Lung Shaw Professor Department of Geography University of Tennessee Knoxville,
Geospatial Analysis of Job-Housing Mismatch Using ArcGIS and Python
 Geospatial Analysis of Job-Housing Mismatch Using ArcGIS and Python 2016 ESRI User Conference June 29, 2016 San Diego, CA Jung Seo, Frank Wen, Simon Choi and Tom Vo, Research & Analysis Southern California
Updating the Urban Boundary and Functional Classification of New Jersey Roadways using 2010 Census data
 Updating the Urban Boundary and Functional Classification of New Jersey Roadways using 2010 Census data By: Glenn Locke, GISP, PMP 1 GIS-T May, 2013 Presentation Overview Purpose of Project Methodology
Census and USGS: Bringing Improved TIGER to The National Map. Jennie Karalewich-Census Andrea Johnson- Census Dick Vraga- USGS
 Census and USGS: Bringing Improved TIGER to The National Map Jennie Karalewich-Census Andrea Johnson- Census Dick Vraga- USGS USGS and the Census Bureau Since 1880 there has been a close working relationship
Encapsulating Urban Traffic Rhythms into Road Networks
 Encapsulating Urban Traffic Rhythms into Road Networks Junjie Wang +, Dong Wei +, Kun He, Hang Gong, Pu Wang * School of Traffic and Transportation Engineering, Central South University, Changsha, Hunan,
Chapter 6. Fundamentals of GIS-Based Data Analysis for Decision Support. Table 6.1. Spatial Data Transformations by Geospatial Data Types
 Chapter 6 Fundamentals of GIS-Based Data Analysis for Decision Support FROM: Points Lines Polygons Fields Table 6.1. Spatial Data Transformations by Geospatial Data Types TO: Points Lines Polygons Fields
Appendix BAL Baltimore, Maryland 2003 Annual Report on Freeway Mobility and Reliability
 (http://mobility.tamu.edu/mmp) Office of Operations, Federal Highway Administration Appendix BAL Baltimore, Maryland 2003 Annual Report on Freeway Mobility and Reliability This report is a supplement to:
Regional Transit Development Plan Strategic Corridors Analysis. Employment Access and Commuting Patterns Analysis. (Draft)
") Regional Transit Development Plan Strategic Corridors Analysis Employment Access and Commuting Patterns Analysis (Draft) April 2010 Contents 1.0 INTRODUCTION... 4 1.1 Overview and Data Sources... 4 1.2
Regional Transit Development Plan Strategic Corridors Analysis Employment Access and Commuting Patterns Analysis (Draft) April 2010 Contents 1.0 INTRODUCTION... 4 1.1 Overview and Data Sources... 4 1.2
Advancing Transportation Performance Management and Metrics with Census Data
 Advancing Transportation Performance Management and Metrics with Census Data Authors: Ivana Tasic, University of Utah, Department of Civil and Environmental Engineering, 110 Central Campus Drive, Salt
2015 Grand Forks East Grand Forks TDM
 GRAND FORKS EAST GRAND FORKS 2015 TRAVEL DEMAND MODEL UPDATE DRAFT REPORT To the Grand Forks East Grand Forks MPO October 2017 Diomo Motuba, PhD & Muhammad Asif Khan (PhD Candidate) Advanced Traffic Analysis
East Bay BRT. Planning for Bus Rapid Transit
 East Bay BRT Planning for Bus Rapid Transit Regional Vision Draper Prison The Bottleneck is a State-Level issue, Salt Lake County 2050 Population: 1.5M Draper Prison hopefully with some State-Level funding!
Developing and Validating Regional Travel Forecasting Models with CTPP Data: MAG Experience
 CTPP Webinar and Discussion Thursday, July 17, 1-3pm EDT Developing and Validating Regional Travel Forecasting Models with CTPP Data: MAG Experience Kyunghwi Jeon, MAG Petya Maneva, MAG Vladimir Livshits,
Leaving the Ivory Tower of a System Theory: From Geosimulation of Parking Search to Urban Parking Policy-Making
 Leaving the Ivory Tower of a System Theory: From Geosimulation of Parking Search to Urban Parking Policy-Making Itzhak Benenson 1, Nadav Levy 1, Karel Martens 2 1 Department of Geography and Human Environment,
2010 Census Data Release and Current Geographic Programs. Michaellyn Garcia Geographer Seattle Regional Census Center
 2010 Census Data Release and Current Geographic Programs Michaellyn Garcia Geographer Seattle Regional Census Center 2010 Center of Population Located approximately 2.7 miles northeast of Plato, Missouri
Trip Distribution Modeling Milos N. Mladenovic Assistant Professor Department of Built Environment
 Trip Distribution Modeling Milos N. Mladenovic Assistant Professor Department of Built Environment 25.04.2017 Course Outline Forecasting overview and data management Trip generation modeling Trip distribution
Urban Link Travel Time Estimation Using Large-scale Taxi Data with Partial Information
 Urban Link Travel Time Estimation Using Large-scale Taxi Data with Partial Information * Satish V. Ukkusuri * * Civil Engineering, Purdue University 24/04/2014 Outline Introduction Study Region Link Travel
Application of GIS in Public Transportation Case-study: Almada, Portugal
 Case-study: Almada, Portugal Doutor Jorge Ferreira 1 FSCH/UNL Av Berna 26 C 1069-061 Lisboa, Portugal +351 21 7908300 jr.ferreira@fcsh.unl.pt 2 FSCH/UNL Dra. FCSH/UNL +351 914693843, leite.ines@gmail.com
Varying Influences of the Built Environment on Household Travel in Fifteen Diverse Regions of the United states
 Varying Influences of the Built Environment on Household Travel in Fifteen Diverse Regions of the United states Ewing, R., G. Tian, J.P. Goates, M. Zhang, M. Greenwald, Lane Council of Governments, A.
INSTITUTE OF POLICY AND PLANNING SCIENCES. Discussion Paper Series
 INSTITUTE OF POLICY AND PLANNING SCIENCES Discussion Paper Series No. 1102 Modeling with GIS: OD Commuting Times by Car and Public Transit in Tokyo by Mizuki Kawabata, Akiko Takahashi December, 2004 UNIVERSITY
Reference: 4880(DOP.ADA)1136 Subject: Survey on the integration of geographic information systems into postal address development
1136 Subject: Survey on the integration of geographic information systems into postal address development") International Bureau Weltpoststrasse 4 P.O. Box 312 3000 BERNE 15 SWITZERLAND To: Union member countries Regulators Designated operators T +41 31 350 31 11 F +41 31 350 31 10 www.upu.int For information
International Bureau Weltpoststrasse 4 P.O. Box 312 3000 BERNE 15 SWITZERLAND To: Union member countries Regulators Designated operators T +41 31 350 31 11 F +41 31 350 31 10 www.upu.int For information
106 PURDUE ENGINEERING EXTENSION DEPARTMENT
 106 PURDUE ENGINEERING EXTENSION DEPARTMENT distribution by stations can best be studied by examining Figs. 3 and 4. Figure 4 shows the frequency distribution between stations, and Fig. 3 shows the actual
KINEMATICS WHERE ARE YOU? HOW FAST? VELOCITY OR SPEED WHEN YOU MOVE. Typical Cartesian Coordinate System. usually only the X and Y axis.
 KINEMATICS File:The Horse in Motion.jpg - Wikimedia Foundation 1 WHERE ARE YOU? Typical Cartesian Coordinate System usually only the X and Y axis meters File:3D coordinate system.svg - Wikimedia Foundation
Use of Spatial Interpolation to Estimate Interurban Traffic Flows from Traffic Counts
 Use of Spatial Interpolation to Estimate Interurban Traffic Flows from Traffic Counts NATMEC: Improving Traffic Data Collection, Analysis, and Use June 29 July 2, 2014 Swissôtel Chicago Chicago, Illinois
Varying Influences of the Built Environment on Household Travel in Fifteen Diverse Regions of the United states
 Varying Influences of the Built Environment on Household Travel in Fifteen Diverse Regions of the United states Ewing, R., G. Tian, J.P. Goates, M. Zhang, M. Greenwald, Lane Council of Governments, A.
Density and Walkable Communities
 Density and Walkable Communities Reid Ewing Professor & Chair City and Metropolitan Planning University of Utah ewing@arch.utah.edu Department of City & Metropolitan Planning, University of Utah MRC Research
Lecture 6: Transport Costs and Congestion Forces
 Lecture 6: Transport Costs and Congestion Forces WWS 538 Esteban Rossi-Hansberg Princeton University ERH (Princeton University ) Lecture 6: Transport Costs and Congestion Forces 1 / 43 Baum-Snow (2007)
Analysis and Design of Urban Transportation Network for Pyi Gyi Ta Gon Township PHOO PWINT ZAN 1, DR. NILAR AYE 2
 www.semargroup.org, www.ijsetr.com ISSN 2319-8885 Vol.03,Issue.10 May-2014, Pages:2058-2063 Analysis and Design of Urban Transportation Network for Pyi Gyi Ta Gon Township PHOO PWINT ZAN 1, DR. NILAR AYE