Using GIS to Evaluate Rural Emergency Medical Services (EMS)
|
|
|
- Emerald Shepherd
- 6 years ago
- Views:
Transcription
1 Using GIS to Evaluate Rural Emergency Medical Services (EMS) Zhaoxiang He Graduate Research Assistant Xiao Qin Ph.D., P.E. Associate Professor
2 Outline Introduction Literature Review Study Design Data Collection & Processing Methodology K Function Cross K Function Getis Ord G* Statistic Results Conclusions


3 Introduction Emergency Medical Service (EMS) is defined as the personnel, vehicles, equipment and facilities used to deliver medical services to those who need immediate care but outside a hospital; and therefore, it is considered as the vital expansion of emergency care from the emergency room to the community.
4 Introduction Wide disparity exists in the delivery of EMS in rural areas, compared with urban areas due to reasons such as geographic barriers, lack of professional and paraprofessional, inadequate financial resources, aging or inadequate equipment, absence of specialized EMS care and local medical facilities. The objective of the study is to assess the EMS station locations and recommend service improvements.
5 Literature Review In most studies, response time, the time interval from when an ambulance is en-route until it arrives at the scene, is used as the indicator to evaluate the EMS performance. Many researchers focus on the geographic distribution of 911 calls, but limited studies provide the spatial association between EMS stations and incident locations. Few studies investigated contributing factors to the EMS performance, probably due to the lack of data. A great amount of research deals with similar datasets (e.g. crime dataset, crash dataset) and spatial data analysis methods were developed and used.

6 Incident Data Point Shapefile K- Function Analysis Cluster Yes Getis- Ord G* Analysis High Incident Density Area Clustering Analysis Improper EMS Station Location at a State Level Cross K- Function Analysis No Cluster Yes Proper EMS Station Location at a State Level Spatial Relationship analysis EMS Station Point Shapefile Service Coverage Rate at a State Level Incident Data outside Converge Additional EMS Service Generate a Service Coverage Incident Data within& outside Coverage Incident Data within Converge Contributing Factor Analysis Contributing Factor Analysis Service Coverage Polygon Figure 2 Study Design Flow Chat Study design Provide Possible Department of Civil and Environmental contributing factor Engineering And Corresponding South Dakota Recommendation State University
7 Data Collection & Processing SD EMS data was collected through the National EMS Information System (NEMSIS) during Step Objective Criteria Data Percentage (%) Filtered Remained 1 Complete dataset N.A. 50, Response only with valid location coordinates Dispatch Type = 911 response Valid Location Coordinates 29, Filter missing or invalid odometer data Mile_Scene, Mile_Dest, Mile_In = 0 or blank 17, Filter missing or invalid time intervals ERTime, ERHTime, Total Time = 0, blank,or > 240 min 16, Filter missing or invalid distance data ERDistance, ERHDistance, Distance_Back = -, 0, or >400 miles 15, Filter invalid speed data ERSpeed, ERHSpeed >120 mph 14, EMS ambulance station data was found from the home page of South Dakota Emergency Medical Services and 125 stations in total.
8
9 Methodology K Function Ripley s K function is a spatial statistical method for point pattern analysis: whether the points appear to be clustered, dispersed, or randomly distributed. K(r)= λ 1 E( number of extra points within distance r of a randomly chosen point ) (1) L(r)= K(r)/π (2) Where λ= Observed density (number per unit area) of points; E ( ) = expected value;
10 Methodology Cross K Function Similar to K function, cross K function is to analyze the co-location pattern between two kinds of points, for example A ( a 1, a 2,, a i ) and B ( b 1, b 2,, b j ) : whether the two kind of points appear to be clustered, dispersed, or randomly distributed. K ba (r)= λ a 1 E( number of points A within distance r of a point b i in B ) (3) L ba (r)= K ba (r)/π (4) Where B are fixed locations; λ a =
11 Methodology Getis-Ord G* Getis-Ord G* statistic indicates locations surrounded by a cluster of high or low values, aka hot spots or cold spots. G i (d)= j=1 N w ij (d) x j x j=1 N w ij (d) /S N j=1 N w ij 2 (d) ( j=1 N w ij (d)) 2 /N 1 (5) Where x = j=1 N x j /N And S= j=1 N x j 2 /N ( x ) 2 ; x j = the attribute value for feature j; w ij =the spatial weight between feature i and j;
12 K Function Clustering Analysis K function was first applied to examine the point pattern for all the incidents in SD. The figure shows a significant clustering pattern at the 95% confidence interval. The corresponding r for summit of the observed curve indicates that incidents exhibit the most obvious clustering pattern at a distance of 3 mile. Figure 4 K Function expressed as L(r)-r for all incidents
13 Getis-Ord G* Clustering Analysis Incident points were aggregated to 5*5(mile) grids and the Getis-Ord G* analysis was conducted using the incident count. 22 clusters indicate 22 high incident density areas and they are used in the following analysis.
 at the 95% confidence interval.")
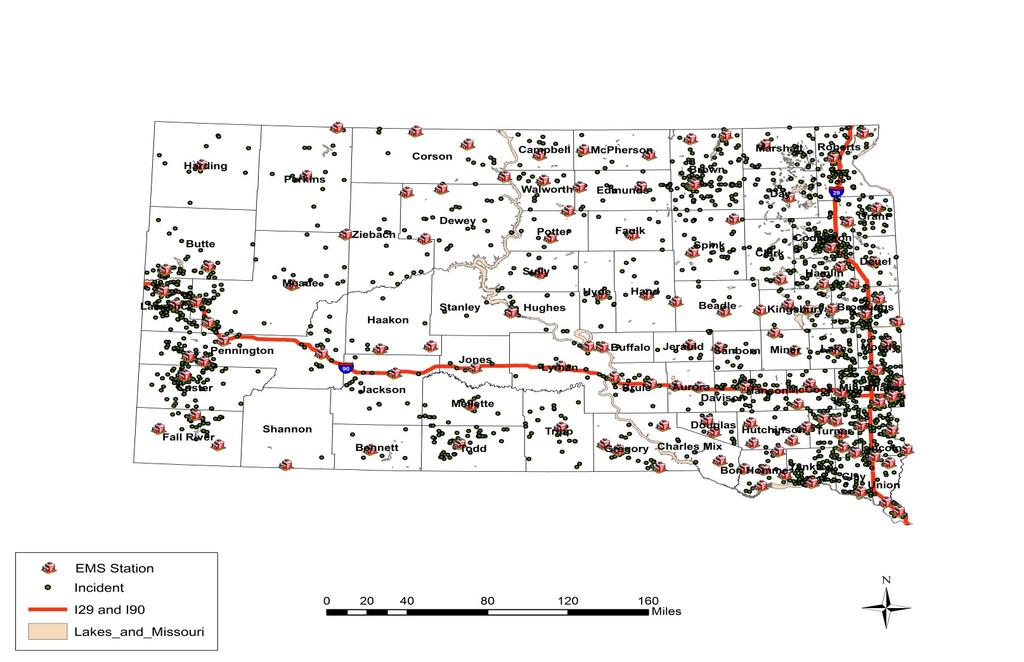
14 Spatial Relationship btw EMS Stations and Incidents Cross-K function was applied to examine colocation pattern of incidents and EMS stations. The Figure indicates incidents cluster around EMS stations at close distances(<25 mile) at the 95% confidence interval. This finding shows that the EMS station are reasonably well distributed at the state level.
 1710 and 90% of the 2012 incidents are")
15 Figure 7 Coverage Area of 8 min for each EMS Station Eight-minute response time was chosen as the service coverage time base on National Fire Protection Association (NFPA) 1710 and 90% of the 2012 incidents are covered.
16 Descriptive Analysis on Service performance Group 1 (9073 ) Group2 (4451) Statistics Response Time (min) Travel Distance (mile) Travel Speed (mph) Mean STD. Dev Median Range [1,178] [0.04,175] [0.67,120] Mean STD. Dev Median Range [1,88] [0.02,58] [0.17,120] (%)>10 min (%)>10 min Response Time (min)
17 Contributing Factors for Service Performance The incidents with the longest response time (top 2.5%) are min and min, respectively. Regress analysis shows that in high incident density areas, travel distance can explain most of the variation in the response time. Dispatch type and location type are also statistically significant. In low incident density areas, travel distance cannot be the main contributing factor, and also dispatch type shows statistically insignificant. Definition R Square Group 1 (298) Group 2 (210) Response Mode If Light& Sirens for the ambulance is on Dispatch Type Incident type when dispatching Location Type Location type such as residence Travel Distance Distance from EMS station to incident
18 Conclusions and Future Work State wide assessment for EMS station locations is conducted both qualitatively (co-location pattern) and quantitatively (service coverage). An overall good coverage rate of the SD EMS was found. However, longer response times corresponding to longer travel distance were found in high incident density areas within the coverage area. Why? In low density areas, none of the variables (e.g., travel distance, location type, dispatch type) seem to be relevant to the long response time cases. Why? Future work includes seeking answers for the whys and developing tactical plans for the deployment of EMS stations.
19 Questions?
Aristithes G. Doumouras BHSc 1, David Gomez MD 1, Barbara Haas MD 1, Donald M. Boyes PhD 2, Avery B. Nathens MD PhD FACS 1,3
 Aristithes G. Doumouras BHSc 1, David Gomez MD 1, Barbara Haas MD 1, Donald M. Boyes PhD 2, Avery B. Nathens MD PhD FACS 1,3 1 Keenan Research Center in the Li Ka Shing Knowledge Institute of St Michael
How GIS Can Help With Tribal Safety Planning
 How GIS Can Help With Tribal Safety Planning Thomas A. Horan, PhD Brian Hilton, PhD Arman Majidi, MAIS Center for Information Systems and Technology Claremont Graduate University Goals & Objectives This
Lecture 4. Spatial Statistics
 Lecture 4 Spatial Statistics Lecture 4 Outline Statistics in GIS Spatial Metrics Cell Statistics Neighborhood Functions Neighborhood and Zonal Statistics Mapping Density (Density surfaces) Hot Spot Analysis
GIS ANALYSIS METHODOLOGY
 GIS ANALYSIS METHODOLOGY No longer the exclusive domain of cartographers, computer-assisted drawing technicians, mainframes, and workstations, geographic information system (GIS) mapping has migrated to
LOCATION OF PREHOSPITAL CARE BASIS THROUGH COMBINED FUZZY AHP AND GIS METHOD
 ISAHP Article: Mu, Saaty/A Style Guide for Paper Proposals To Be Submitted to the LOCATION OF PREHOSPITAL CARE BASIS THROUGH COMBINED FUZZY AHP AND GIS METHOD Marco Tiznado Departamento de Ingeniería Industrial,
Key Steps for Assessing Mission Critical Data for An ebook by Geo-Comm, Inc.
 Key Steps for Assessing Mission Critical Data for 9-1-1 An ebook by Geo-Comm, Inc. If you re reading this, you probably understand transitioning to Next Generation 9-1-1 (NG9-1-1) means your Geographic
Dr Arulsivanathan Naidoo Statistics South Africa 18 October 2017
 ESRI User Conference 2017 Space Time Pattern Mining Analysis of Matric Pass Rates in Cape Town Schools Dr Arulsivanathan Naidoo Statistics South Africa 18 October 2017 Choose one of the following Leadership
Sensitivity of estimates of travel distance and travel time to street network data quality
 Sensitivity of estimates of travel distance and travel time to street network data quality Paul Zandbergen Department of Geography University of New Mexico Outline Street network quality Approaches to
Defining Statistically Significant Spatial Clusters of a Target Population using a Patient-Centered Approach within a GIS
 Defining Statistically Significant Spatial Clusters of a Target Population using a Patient-Centered Approach within a GIS Efforts to Improve Quality of Care Stephen Jones, PhD Bio-statistical Research
Designing Service Coverage and Measuring Accessibility and Serviceability of Rural and Small Urban Ambulance Systems
 Systems 2014, 2, 34-53; doi:10.3390/systems2010034 Article OPEN ACCESS systems ISSN 2079-8954 www.mdpi.com/journal/systems Designing Service Coverage and Measuring Accessibility and Serviceability of Rural
Policy Paper Alabama Primary Care Service Areas
 Aim and Purpose Policy Paper Alabama Primary Care Service Areas Produced by the Office for Family Health Education & Research, UAB School of Medicine To create primary care rational service areas (PCSA)
Texas A&M University
 Texas A&M University CVEN 658 Civil Engineering Applications of GIS Hotspot Analysis of Highway Accident Spatial Pattern Based on Network Spatial Weights Instructor: Dr. Francisco Olivera Author: Zachry
By Abdulraheem M.Baabbad. Supervisor: Dr.Bager Al-Ramadan
 By Abdulraheem M.Baabbad Supervisor: Dr.Bager Al-Ramadan OUTLINE Health GIS Health GIS Application Emergency Vehicles Allocation: A case study Health GIS Innovative structureto access,integrate,visualize
Transportation and Road Weather
 Portland State University PDXScholar TREC Friday Seminar Series Transportation Research and Education Center (TREC) 4-18-2014 Transportation and Road Weather Rhonda Young University of Wyoming Let us know
This report details analyses and methodologies used to examine and visualize the spatial and nonspatial
 Analysis Summary: Acute Myocardial Infarction and Social Determinants of Health Acute Myocardial Infarction Study Summary March 2014 Project Summary :: Purpose This report details analyses and methodologies
NEW YORK DEPARTMENT OF SANITATION. Spatial Analysis of Complaints
 NEW YORK DEPARTMENT OF SANITATION Spatial Analysis of Complaints Spatial Information Design Lab Columbia University Graduate School of Architecture, Planning and Preservation November 2007 Title New York
Geomapping Drive-Time Based Market Areas for DoD TRICARE Beneficiaries
 Geomapping Drive-Time Based Market Areas for DoD TRICARE Beneficiaries Richard R. Bannick, Ph.D. and Tyler Erickson, Ph. D.* Accompanied in the audience by James Laramie* & Amii Kress Oct 25, 2006 Office
Medical GIS: New Uses of Mapping Technology in Public Health. Peter Hayward, PhD Department of Geography SUNY College at Oneonta
 Medical GIS: New Uses of Mapping Technology in Public Health Peter Hayward, PhD Department of Geography SUNY College at Oneonta Invited research seminar presentation at Bassett Healthcare. Cooperstown,
GIS CONFERENCE MAKING PLACE MATTER Decoding Health Data with Spatial Statistics
 esri HEALTH AND HUMAN SERVICES GIS CONFERENCE MAKING PLACE MATTER Decoding Health Data with Spatial Statistics Flora Vale Jenora D Acosta Wait a minute Wait a minute Where is Lauren?? Wait a minute Where
The Road to Improving your GIS Data. An ebook by Geo-Comm, Inc.
 The Road to Improving your GIS Data An ebook by Geo-Comm, Inc. An individual observes another person that appears to be in need of emergency assistance and makes the decision to place a call to 9-1-1.
GeoHealth Applications Platform ESRI Health GIS Conference 2013
 GeoHealth Applications Platform ESRI Health GIS Conference 2013 Authors Thomas A. Horan, Ph.D. Professor, CISAT Director April Moreno Health GeoInformatics Ph.D. Student Brian N. Hilton, Ph.D. Clinical
Technical Memorandum #2 Future Conditions
 Technical Memorandum #2 Future Conditions To: Dan Farnsworth Transportation Planner Fargo-Moorhead Metro Council of Governments From: Rick Gunderson, PE Josh Hinds PE, PTOE Houston Engineering, Inc. Subject:
Inclusion of Non-Street Addresses in Cancer Cluster Analysis
 Inclusion of Non-Street Addresses in Cancer Cluster Analysis Sue-Min Lai, Zhimin Shen, Darin Banks Kansas Cancer Registry University of Kansas Medical Center KCR (Kansas Cancer Registry) KCR: population-based
Measuring Geographic Access to Primary Care Physicians
 Measuring Geographic Access to Primary Care Physicians The New Mexico Health Policy Commission and the University of New Mexico s Division of Government Research have been working cooperatively to collect
University of Oklahoma Emergency Response Plan for INSERT EVENT NAME HERE.
 University of Oklahoma Emergency Response Plan for INSERT EVENT NAME HERE. Time/Date of Event: INSERT BOTH START & END TIME/DATE HERE. Location of Event: LIST ALL LOCATIONS HERE OF EVENT, INCLUDING ADDRESS.
DEVELOPING DECISION SUPPORT TOOLS FOR THE IMPLEMENTATION OF BICYCLE AND PEDESTRIAN SAFETY STRATEGIES
 DEVELOPING DECISION SUPPORT TOOLS FOR THE IMPLEMENTATION OF BICYCLE AND PEDESTRIAN SAFETY STRATEGIES Deo Chimba, PhD., P.E., PTOE Associate Professor Civil Engineering Department Tennessee State University
ArcGIS Online Analytics. Mike Flanagan
 ArcGIS Online Analytics Mike Flanagan MFlanagan@esri.com Agenda Introduction to ArcGIS Online Spatial Analysis ArcGIS Online Spatial Analysis Workflow Demos and Examples Wrap-up Q&A ArcGIS A complete web
Background of Project
 RELOCATION OF GRESHAM FIRE STATION #76 Mike Shelby Annie Scriven Andrea Consalus Background of Project Wanted to do a project that was meaningful Contacted Molly Vogt, GIS Manager at City of Gresham Informed
Spatial Analysis I. Spatial data analysis Spatial analysis and inference
 Spatial Analysis I Spatial data analysis Spatial analysis and inference Roadmap Outline: What is spatial analysis? Spatial Joins Step 1: Analysis of attributes Step 2: Preparing for analyses: working with
BROOKINGS May
 Appendix 1. Technical Methodology This study combines detailed data on transit systems, demographics, and employment to determine the accessibility of jobs via transit within and across the country s 100
NETWORK ANALYSIS FOR URBAN EMERGENCY SERVICES IN SOLAPUR CITY, INDIA: A GEOINFORMATIC APPROACH
 NETWORK ANALYSIS FOR URBAN EMERGENCY SERVICES IN SOLAPUR CITY, INDIA: A GEOINFORMATIC APPROACH Sagar P. Mali * & Yogesh A. Mane ** * Research Student, Department of Geography, Shivaji University, Kolhapur,
Advanced Algorithms for Geographic Information Systems CPSC 695
 Advanced Algorithms for Geographic Information Systems CPSC 695 Think about Geography What is Geography The 3 W s of Geography What is where Why is it there Why do I care Data - Data - Data We all got
Modeling Incident Density with Contours in ArcGIS Pro
 Modeling Incident Density with Contours in ArcGIS Pro By Mike Price, Entrada/San Juan, Inc. What you will need ArcGIS Pro 1.4 license or later ArcGIS Spatial Analyst license ArcGIS Online for organizational
Encapsulating Urban Traffic Rhythms into Road Networks
 Encapsulating Urban Traffic Rhythms into Road Networks Junjie Wang +, Dong Wei +, Kun He, Hang Gong, Pu Wang * School of Traffic and Transportation Engineering, Central South University, Changsha, Hunan,
Analyzing the Geospatial Rates of the Primary Care Physician Labor Supply in the Contiguous United States
 Analyzing the Geospatial Rates of the Primary Care Physician Labor Supply in the Contiguous United States By Russ Frith Advisor: Dr. Raid Amin University of W. Florida Capstone Project in Statistics April,
GREEN SHEET. California Department of Forestry and Fire Protection (CAL FIRE)
") GREEN SHEET California Department of Forestry and Fire Protection (CAL FIRE) Informational Summary Report of Serious CAL FIRE Injuries, Illnesses, Accidents and Near Serious Accidents Fire Engine Rollover
GREEN SHEET California Department of Forestry and Fire Protection (CAL FIRE) Informational Summary Report of Serious CAL FIRE Injuries, Illnesses, Accidents and Near Serious Accidents Fire Engine Rollover
Cost-Benefit Analysis of the Pooled- Fund Maintenance Decision Support System: Case Study
 Cost-Benefit Analysis of the Pooled- Fund Maintenance Decision Support System: Case Study Zhirui Ye (WTI) Xianming Shi (WTI) Christopher K. Strong (City of Oshkosh) 12 th AASHTO-TRB TRB Maintenance Management
Performance Evaluation of Tehran-Qom Highway Emergency Medical Service System Using Hypercube Queuing Model
 Western New England University From the SelectedWorks of Mohammadsadegh Mobin Summer May 2, 2015 Performance Evaluation of Tehran-Qom Highway Emergency Medical Service System Using Hypercube Queuing Model
Finding Hot Spots in ArcGIS Online: Minimizing the Subjectivity of Visual Analysis. Nicholas M. Giner Esri Parrish S.
 Finding Hot Spots in ArcGIS Online: Minimizing the Subjectivity of Visual Analysis Nicholas M. Giner Esri Parrish S. Henderson - FBI Agenda The subjectivity of maps What is Hot Spot Analysis? What is Outlier
Hennepin GIS. Tree Planting Priority Areas - Analysis Methodology. GIS Services April 2018 GOAL:
 Hennepin GIS GIS Services April 2018 Tree Planting Priority Areas - Analysis Methodology GOAL: To create a GIS data layer that will aid Hennepin County Environment & Energy staff in determining where to
Course Description. Illicit Drug Labs A Safe Response for Public Safety Personnel. International Association of Fire Fighters
 Illicit Drug Labs A Safe Response for Public Safety Personnel Course Duration: 8 hours (1 day). Learning Objectives: Given an 8-hour course on illicit drug labs, students will be able to describe illicit
Introduction to ArcGIS GeoAnalytics Server. Sarah Ambrose & Noah Slocum
 Introduction to ArcGIS GeoAnalytics Server Sarah Ambrose & Noah Slocum Agenda Overview Analysis Capabilities + Demo Deployment and Configuration Questions ArcGIS GeoAnalytics Server uses the power of distributed
Finding Hot Spots in ArcGIS Online: Minimizing the Subjectivity of Visual Analysis. Nicholas M. Giner Esri Parrish S.
 Finding Hot Spots in ArcGIS Online: Minimizing the Subjectivity of Visual Analysis Nicholas M. Giner Esri Parrish S. Henderson FBI Agenda The subjectivity of maps What is Hot Spot Analysis? Why do Hot
GIS Spatial Statistics for Public Opinion Survey Response Rates
 GIS Spatial Statistics for Public Opinion Survey Response Rates July 22, 2015 Timothy Michalowski Senior Statistical GIS Analyst Abt SRBI - New York, NY t.michalowski@srbi.com www.srbi.com Introduction
Map your way to deeper insights
 Map your way to deeper insights Target, forecast and plan by geographic region Highlights Apply your data to pre-installed map templates and customize to meet your needs. Select from included map files
Travel Time Calculation With GIS in Rail Station Location Optimization
 Travel Time Calculation With GIS in Rail Station Location Optimization Topic Scope: Transit II: Bus and Rail Stop Information and Analysis Paper: # UC8 by Sutapa Samanta Doctoral Student Department of
John Laznik 273 Delaplane Ave Newark, DE (302)
") Office Address: John Laznik 273 Delaplane Ave Newark, DE 19711 (302) 831-0479 Center for Applied Demography and Survey Research College of Human Services, Education and Public Policy University of Delaware
Office Address: John Laznik 273 Delaplane Ave Newark, DE 19711 (302) 831-0479 Center for Applied Demography and Survey Research College of Human Services, Education and Public Policy University of Delaware
May 31, Flood Response Overview
 May 31, 2013 Flood Response Overview Suppression 867 Personnel on three (3) shifts 289 Red Shift (A) 289 Blue Shift (B) 289 Green Shift (C) Department Overview Department Overview EMS: 40,934 False Alarm:
Educational Objectives
 MDSS and Anti-Icing: How to Anti-Ice with Confidence Wilf Nixon, Ph.D., P.E. IIHR Hydroscience and Engineering University of Iowa Iowa City And Asset Insight Technologies, LLC Educational Objectives At
Monsuru Adepeju 1 and Andy Evans 2. School of Geography, University of Leeds, LS21 1HB 1
 Investigating the impacts of training data set length (T) and the aggregation unit size (M) on the accuracy of the self-exciting point process (SEPP) hotspot method Monsuru Adepeju 1 and Andy Evans 2 1,
Chapter 1 Overview of Maps
 Chapter 1 Overview of Maps In this chapter you will learn about: Key points when working with maps General types of maps Incident specific maps Map legend and symbols Map sources A map is a navigational
STORM COWBOY. FANNIN COUNTY A.R.E.S. and R.A.C.E.S. Reference Manual SKYWARN MISSION
 FANNIN COUNTY A.R.E.S. and R.A.C.E.S. STORM COWBOY Reference Manual SKYWARN MISSION TO LOCATE POSSIBLE THREATS TO LIFE AND PROPERTY AND PROVIDE INFORMATION FROM WHICH WARNINGS CAN ISSUED TABLE OF CONTENTS
Southeast and Northeast Region After Action Report April 22, 2010 Severe Weather Events
 Southeast and Northeast Region After Action Report April 22, 2010 Severe Weather Events Bent County ISSUE: Utilizing Webeoc on fast-paced incidents in a rural setting. DISCUSSION: National weather service
Application of the Getis-Ord Gi* statistic (Hot Spot Analysis) to seafloor organisms
 to seafloor organisms") Application of the Getis-Ord Gi* statistic (Hot Spot Analysis) to seafloor organisms Diana Watters Research Fisheries Biologist Habitat Ecology Team Santa Cruz, CA Southwest Fisheries Science Center Fisheries
Application of the Getis-Ord Gi* statistic (Hot Spot Analysis) to seafloor organisms Diana Watters Research Fisheries Biologist Habitat Ecology Team Santa Cruz, CA Southwest Fisheries Science Center Fisheries
GIS and Business Location Analytics
 UNT s course evaluation system (SPOT - Student Perceptions of Teaching) opened on Monday, April 16 and runs through Thursday, May 3. You should have received an email on April 16 providing guidance on
ARIC Manuscript Proposal # PC Reviewed: _9/_25_/06 Status: A Priority: _2 SC Reviewed: _9/_25_/06 Status: A Priority: _2
 ARIC Manuscript Proposal # 1186 PC Reviewed: _9/_25_/06 Status: A Priority: _2 SC Reviewed: _9/_25_/06 Status: A Priority: _2 1.a. Full Title: Comparing Methods of Incorporating Spatial Correlation in
Modeling evacuation plan problems
 Chapter 7 Modeling evacuation plan problems In Section 3.1 we reviewed the recommendations that the UNESCO presented in [30] to develop volcanic emergency plans. In [18] is presented the state of art of
SPATIAL ANALYSIS. Transformation. Cartogram Central. 14 & 15. Query, Measurement, Transformation, Descriptive Summary, Design, and Inference
 14 & 15. Query, Measurement, Transformation, Descriptive Summary, Design, and Inference Geographic Information Systems and Science SECOND EDITION Paul A. Longley, Michael F. Goodchild, David J. Maguire,
Data Driven Approaches to Crime and Traffic Safety
 Data Driven Approaches to Crime and Traffic Safety Baltimore County Police Department Traffic Safety is Public Safety Baltimore County Police Department Population: 801,000 Square Miles: 610 Sworn Personnel:
What is 511? Need for 511 Services. Development & Deployment of Regional Road and Weather Information Supporting 511 Traveler Services
 Development & Deployment of Regional Road and Weather Information Supporting 511 Traveler Services Leon F. Osborne University of North Dakota Regional Weather Information Center Grand Forks, ND David L.
FANNIN COUNTY A.R.E.S. and R.A.C.E.S. Reference Manual SKYWARN MISSION TO LOCATE POSSIBLE THREATS TO LIFE AND PROPERTY. And
 FANNIN COUNTY A.R.E.S. and R.A.C.E.S. STORM COWBOY Reference Manual SKYWARN MISSION TO LOCATE POSSIBLE THREATS TO LIFE AND PROPERTY And PROVIDE INFORMATION FROM WHICH WARNINGS CAN ISSUED TABLE OF CONTENTS
Purpose Study conducted to determine the needs of the health care workforce related to GIS use, incorporation and training.
 GIS and Health Care: Educational Needs Assessment Cindy Gotz, MPH, CHES Janice Frates, Ph.D. Suzanne Wechsler, Ph.D. Departments of Health Care Administration & Geography California State University Long
Mathematics. Student Workbook. Book 8. 40x Number Knowledge Worksheets 40x Curriculum Strand Worksheets
 Written in NZ for NZ Mathematics Student Workbook Book 8 40x Number Knowledge Worksheets 40x Curriculum Strand Worksheets This resource covers Level 5 achievement objec ves as outlined in the Mathema cs
A Comparison of Tornado Warning Lead Times with and without NEXRAD Doppler Radar
 MARCH 1996 B I E R I N G E R A N D R A Y 47 A Comparison of Tornado Warning Lead Times with and without NEXRAD Doppler Radar PAUL BIERINGER AND PETER S. RAY Department of Meteorology, The Florida State
LandScan Global Population Database
 LandScan Global Population Database The World s Finest Population Distribution Data Uncommon information. Extraordinary places. LandScan Global Population Database East View Cartographic is now offering
A Geo-Statistical Approach for Crime hot spot Prediction
 A Geo-Statistical Approach for Crime hot spot Prediction Sumanta Das 1 Malini Roy Choudhury 2 Abstract Crime hot spot prediction is a challenging task in present time. Effective models are needed which
Where to Invest Affordable Housing Dollars in Polk County?: A Spatial Analysis of Opportunity Areas
 Resilient Neighborhoods Technical Reports and White Papers Resilient Neighborhoods Initiative 6-2014 Where to Invest Affordable Housing Dollars in Polk County?: A Spatial Analysis of Opportunity Areas
What Explains the Effectiveness of Hot Spots Policing And What New Strategies Should we Employ?
 What Explains the Effectiveness of Hot Spots Policing And What New Strategies Should we Employ? David Weisburd Executive Director Center for Evidence-Based Crime Policy George Mason 1 The Effectiveness
AN INVESTIGATION INTO THE IMPACT OF RAINFALL ON FREEWAY TRAFFIC FLOW
 AN INVESTIGATION INTO THE IMPACT OF RAINFALL ON FREEWAY TRAFFIC FLOW Brian L. Smith Assistant Professor Department of Civil Engineering University of Virginia PO Box 400742 Charlottesville, VA 22904-4742
CITY OF RIVERSIDE USING HAZUS TO CREATE A EARTHQUAKE PLANNING GUIDE FOR A UNIFIED FIELD RESPONSE
 CITY OF RIVERSIDE USING HAZUS TO CREATE A EARTHQUAKE PLANNING GUIDE FOR A UNIFIED FIELD RESPONSE Presented by the Phil McCormick City of Riverside Office of Emergency Management HISTORY The City had several
GREEN SHEET. California Department of Forestry and Fire Protection (CAL FIRE)
") GREEN SHEET California Department of Forestry and Fire Protection (CAL FIRE) Informational Summary Report of Serious CAL FIRE Injuries, Illnesses, Accidents and Near-Miss Incidents Electrical Shock Downed
GREEN SHEET California Department of Forestry and Fire Protection (CAL FIRE) Informational Summary Report of Serious CAL FIRE Injuries, Illnesses, Accidents and Near-Miss Incidents Electrical Shock Downed
Spatial-Temporal Analytics with Students Data to recommend optimum regions to stay
 Spatial-Temporal Analytics with Students Data to recommend optimum regions to stay By ARUN KUMAR BALASUBRAMANIAN (A0163264H) DEVI VIJAYAKUMAR (A0163403R) RAGHU ADITYA (A0163260N) SHARVINA PAWASKAR (A0163302W)
Measuring Poverty. Introduction
 Measuring Poverty Introduction To measure something, we need to provide answers to the following basic questions: 1. What are we going to measure? Poverty? So, what is poverty? 2. Who wants to measure
The Leader in Landscape Solutions
 The Leader in Landscape Solutions Emergency Action Plan Hurricane Preparedness Go To Mainscape.com For More Information! Purpose: To provide the Federation at Kings Point and their residents an informative
EXAMINATION OF THE SAFETY IMPACTS OF VARYING FOG DENSITIES: A CASE STUDY OF I-77 IN VIRGINIA
 0 0 0 EXAMINATION OF THE SAFETY IMPACTS OF VARYING FOG DENSITIES: A CASE STUDY OF I- IN VIRGINIA Katie McCann Graduate Research Assistant University of Virginia 0 Edgemont Road Charlottesville, VA 0 --
Emergency Action Guidelines for NH 4-H Animal Events
 Emergency Action Guidelines for NH 4-H Animal Events Purpose: This plan outlines guidelines designed to help ensure NH 4-H Animal Events and Shows are prepared for emergencies and severe weather conditions.
GIS-Based Analysis of the Commuting Behavior and the Relationship between Commuting and Urban Form
 GIS-Based Analysis of the Commuting Behavior and the Relationship between Commuting and Urban Form 1. Abstract A prevailing view in the commuting is that commuting would reconstruct the urban form. By
Using GIS to Identify Pedestrian- Vehicle Crash Hot Spots and Unsafe Bus Stops
 Using GIS to Identify Pedestrian-Vehicle Crash Hot Spots and Unsafe Bus Stops Using GIS to Identify Pedestrian- Vehicle Crash Hot Spots and Unsafe Bus Stops Long Tien Truong and Sekhar V. C. Somenahalli
Frontier and Remote (FAR) Area Codes: A Preliminary View of Upcoming Changes John Cromartie Economic Research Service, USDA
 Area Codes: A Preliminary View of Upcoming Changes John Cromartie Economic Research Service, USDA") National Center for Frontier Communities webinar, January 27, 2015 Frontier and Remote (FAR) Area Codes: A Preliminary View of Upcoming Changes John Cromartie Economic Research Service, USDA The views
National Center for Frontier Communities webinar, January 27, 2015 Frontier and Remote (FAR) Area Codes: A Preliminary View of Upcoming Changes John Cromartie Economic Research Service, USDA The views
Exploring the Impact of Ambient Population Measures on Crime Hotspots
 Exploring the Impact of Ambient Population Measures on Crime Hotspots Nick Malleson School of Geography, University of Leeds http://nickmalleson.co.uk/ N.S.Malleson@leeds.ac.uk Martin Andresen Institute
Approaching Thunderstorm/Lightening. Severe Storm, Windstorm or Tornado
 Emergency/Crisis Management Plan Lake Cumberland 4-H Educational Center Through communication with local Emergency Management Directors, the potential major hazards that may need to be managed for at the
Using Geospatial Methods with Other Health and Environmental Data to Identify Populations
 Using Geospatial Methods with Other Health and Environmental Data to Identify Populations Ellen K. Cromley, PhD Consultant, Health Geographer ellen.cromley@gmail.com Purpose and Outline To illustrate the
Initial Report. North Central Texas Initial Attack. Hildreth Road Dozer Accident. February 9, 2006
 6.152 February 17, 2006 Initial Report North Central Texas Initial Attack Hildreth Road Dozer Accident February 9, 2006 This report is intended to inform interested parties, for a safety and training tool,
Outline. 15. Descriptive Summary, Design, and Inference. Descriptive summaries. Data mining. The centroid
 Outline 15. Descriptive Summary, Design, and Inference Geographic Information Systems and Science SECOND EDITION Paul A. Longley, Michael F. Goodchild, David J. Maguire, David W. Rhind 2005 John Wiley
Visualizing Census Data in GIS. Andrew Rowan, Ph.D. Director, NJ Office of GIS
 Visualizing Census Data in GIS Andrew Rowan, Ph.D. Director, NJ Office of GIS Outline VERY accelerated cartography primer Software choices Demos/how-to ArcGIS Desktop (formerly ArcView) ArcGIS Online Notes
EVALUATION OF SAFETY PERFORMANCES ON FREEWAY DIVERGE AREA AND FREEWAY EXIT RAMPS. Transportation Seminar February 16 th, 2009
 EVALUATION OF SAFETY PERFORMANCES ON FREEWAY DIVERGE AREA AND FREEWAY EXIT RAMPS Transportation Seminar February 16 th, 2009 By: Hongyun Chen Graduate Research Assistant 1 Outline Introduction Problem
Summary Description Municipality of Anchorage. Anchorage Coastal Resource Atlas Project
 Summary Description Municipality of Anchorage Anchorage Coastal Resource Atlas Project By: Thede Tobish, MOA Planner; and Charlie Barnwell, MOA GIS Manager Introduction Local governments often struggle
ENV208/ENV508 Applied GIS. Week 1: What is GIS?
 ENV208/ENV508 Applied GIS Week 1: What is GIS? 1 WHAT IS GIS? A GIS integrates hardware, software, and data for capturing, managing, analyzing, and displaying all forms of geographically referenced information.
Using Of Remote Sensing Data and Geographical Information System To Determine The Optimum Paths For Health Services
 Using Of Remote Sensing Data and Geographical Information System To Determine The Optimum Paths For Health Services Rayan Ghazi Thannoun 1, Sabah Hussein Ali 2, Raya Thamer Mustafa 3 1,2 : Remote Sensing
Aid to Critical Infrastructure and Key Resources During a Disaster. Pete Grandgeorge MidAmerican Energy Company
 Aid to Critical Infrastructure and Key Resources During a Disaster Pete Grandgeorge MidAmerican Energy Company MidAmerican Energy Company Approximately 3,000 employees and 100 staffed facilities 1.4 million
EMS Hot Spot Analysis:
 EMS Hot Spot Analysis: 2014-2016 James Moy, Nika Ofori-Atta, Holly Simmons, Samantha Sperber Under the supervision of Professor Chao Liu URSP 688L: Planning Technologies The University of Maryland College
ArcGIS for Planning and Data Management at Interior Health Authority. Brent Harris, GIS Analyst Information Management
 ArcGIS for Planning and Data Management at Interior Health Authority Brent Harris, GIS Analyst Information Management About Interior Health 1 of 5 geographically-based Health Authorities in B.C. ~215,000
Creating a Geographic Health Information System to Analyze Spatial and Social Patterns of Emergency Department Usage in Olmsted County, Minnesota, USA
 Creating a Geographic Health Information System to Analyze Spatial and Social Patterns of Emergency Department Usage in Olmsted County, Minnesota, USA Joshua J. Pankratz 1,2 1 Department of Resource Analysis,
GIS and Remote Sensing Support for Evacuation Analysis
 GIS and Remote Sensing Support for Evacuation Analysis Presented to GIS for Transportation Symposium Rapid City, South Dakota March 28-31, 2004 Demin Xiong Oak Ridge National Laboratory 2360 Cherahala
Dr.Ismail Bulent GUNDOGDU
 A NEW APPROACH FOR GEOGRAPHICAL INFORMATION SYSTEM-SUPPORTED MAPPING OF TRAFFIC ACCIDENT DATA Dr.Ismail Bulent GUNDOGDU Selcuk University, Engineering and Architecture Faculty Geodesy and Photogrammetry
Geoprocessing Tools at ArcGIS 9.2 Desktop
 Geoprocessing Tools at ArcGIS 9.2 Desktop Analysis Tools Analysis Tools \ Extract Clip Analysis Tools \ Extract Select Analysis Tools \ Extract Split Analysis Tools \ Extract Table Select Analysis Tools
The value of retrospective spatial trends of crime for predictive crime mapping
 The value of retrospective spatial trends of crime for predictive crime mapping Spencer Chainey @SpencerChainey Director of Geographic Information Science University College London Established in 2001
Trip Generation Characteristics of Super Convenience Market Gasoline Pump Stores
 Trip Generation Characteristics of Super Convenience Market Gasoline Pump Stores This article presents the findings of a study that investigated trip generation characteristics of a particular chain of
Your web browser (Safari 7) is out of date. For more security, comfort and. the best experience on this site: Update your browser Ignore
 is out of date. For more security, comfort and. the best experience on this site: Update your browser Ignore") Your web browser (Safari 7) is out of date. For more security, comfort and Activityengage the best experience on this site: Update your browser Ignore Introduction to GIS What is a geographic information
Your web browser (Safari 7) is out of date. For more security, comfort and Activityengage the best experience on this site: Update your browser Ignore Introduction to GIS What is a geographic information
Application of Indirect Race/ Ethnicity Data in Quality Metric Analyses
 Background The fifteen wholly-owned health plans under WellPoint, Inc. (WellPoint) historically did not collect data in regard to the race/ethnicity of it members. In order to overcome this lack of data