Inclusion of Non-Street Addresses in Cancer Cluster Analysis
|
|
|
- Marvin Moore
- 5 years ago
- Views:
Transcription
1 Inclusion of Non-Street Addresses in Cancer Cluster Analysis Sue-Min Lai, Zhimin Shen, Darin Banks Kansas Cancer Registry University of Kansas Medical Center
2 KCR (Kansas Cancer Registry) KCR: population-based central registry for cancer incidence information in Kansas Kansas residents diagnosed or treated with cancer in other states, such as MO, NE, CO, OK, TX, are also registered in the KCR database through data exchange. Approximately 13,000 cancer cases collected annually About 16%-18% with no standard street address
3 Address Types Street address: 1200 Main St, Kansas City, KS Non-Street address: PO BOX 32, city name, KS RR 2 BOX 269, city name, KS RFD 4 BOX 15, city name, KS HC 69 BOX 17, city name, KS 12345
4 Purpose Use datasets (cancer dataset from KCR, population dataset, GIS files) : To identify the address characteristics for the prostate cancer patients collected in Kansas To examine the effect of the non-street addresses on the results of cluster analysis To test the viability of using ZCTAs as the areal units for cluster analysis
5 ZCTA ZCTA(ZIP Code Tabulation Area), an entity developed by the U.S. Census Bureau for tabulating summary statistics Initially designed to overcome difficulties in defining the land area covered by each USPS ZIP Code Each ZCTA aggregates the census blocks that have the same predominant ZIP code associated with the residential mailing addresses in the Census Bureau s Master Address File
6 Data Used Cancer Cases: 9,356 prostate cancer cases diagnosed between 1995 and 1999 for Kansas residents Population: U.S. Census 2000 Summary File, classified by gender and by eighteen age groups Roads file for geocoding reference: US Census TIGER/Line 2000 program, converted to ESRI coverage and shapefile formats County/ZCTA boundary files: Provided by the Kansas State Data Access and Support Center (DASC), projected to the reference system of Lambert Conformal Conic, with the map unit of meter
7 Counties:105
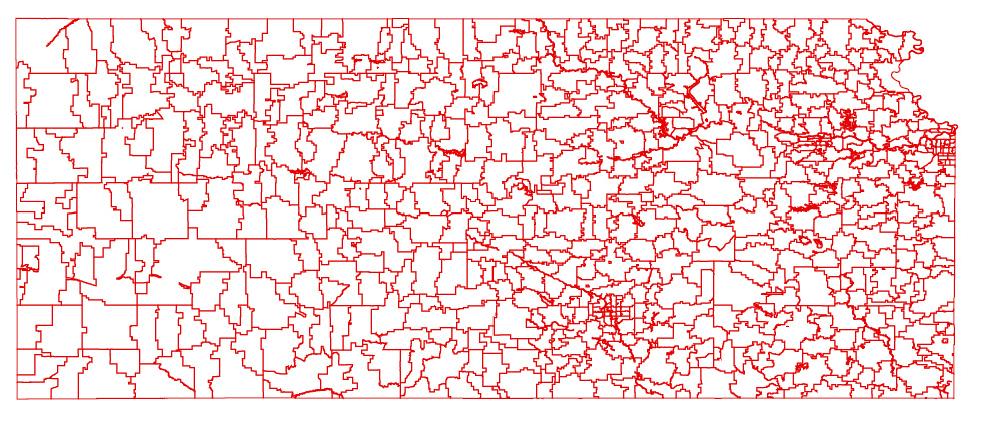
8 Census Tracts:727
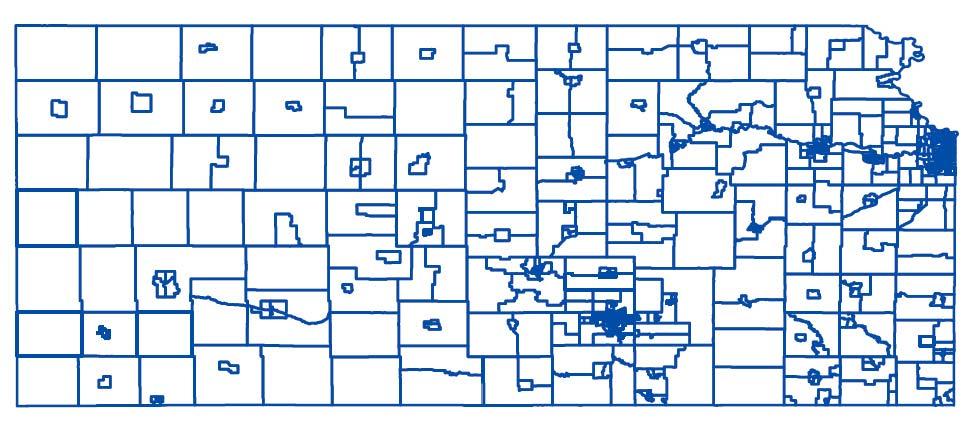
9 ZCTAs:721
10 Beale Codes Beale Codes: measure the rurality degree From the USDA Economic Research Service, also named ERS Rural-Urban Continuum Codes Divided into metropolitan counties, and non-metropolitan counties Metropolitan counties: 3 sub metro groupings by the population size of their metro area >=1 million, 250,000-1 million, <=250,000 Non-metropolitan counties:6 non-metro groupings by degree of urbanization and adjacency to a metro areas, >=20,000, 2, , <2,500, adjacency or not Beale code 1 through 9: 105 Kansas Counties, 6, 4, 7, 3, 8, 11, 23, 4, 39
11 Geocoding ArcInfo 8.3 desktop, match score set at 80 for both automatic and interactive process, side offset was set at 5 meters Cases with street addresses were geocoded to the points along the street segments, and then spatially joined to the ZCTA/county polygons Cases with or without street addresses were also geocoded directly to ZCTAs by patient mailing ZIP codes
12 Geocoding Continued USPS online address lookup: zip codes Yahoo online map: missing street number range in the reference files Zabasearch: patient identifiers TIGER/Line files and cases by individual counties for interactive geocoding, (237mb for shapefile, 156 mb for DBF table, slow in query, selection, sorting)
13 SaTScan To test both the presence of clustering and the general location of the clusters Circular window, Likelihood Ratio, simulation by Monte Carlo randomization, ranking, p value Assume that the count of prostate cancers in each polygon follows the Poisson distribution Null hypothesis that within any age group, the risk of getting prostate cancer is the same across the ZCTA or county polygons
14 SaTScan Input 1. Coordinates table: ZCTA/County FIPS Code (Federal Information Processing Standards), X coordinate, and Y coordinate. ZCTA X, Y: centroid coordinates of the ZCTA polygons County X, Y: centroid coordinates of the largest incorporated place 2. Case table: ZCTA/County FIPS Code, 18 age groups, and prostate cancer case counts 3. Population table: ZCTA/County FIPS Code, 18 age groups, population size, time (null variable) 4. Other parameters setting: purely spatial, scanning high rates only, 999 Monte Carlo replications, Cartesian coordinates, 50% population at risk for maximum spatial cluster size.
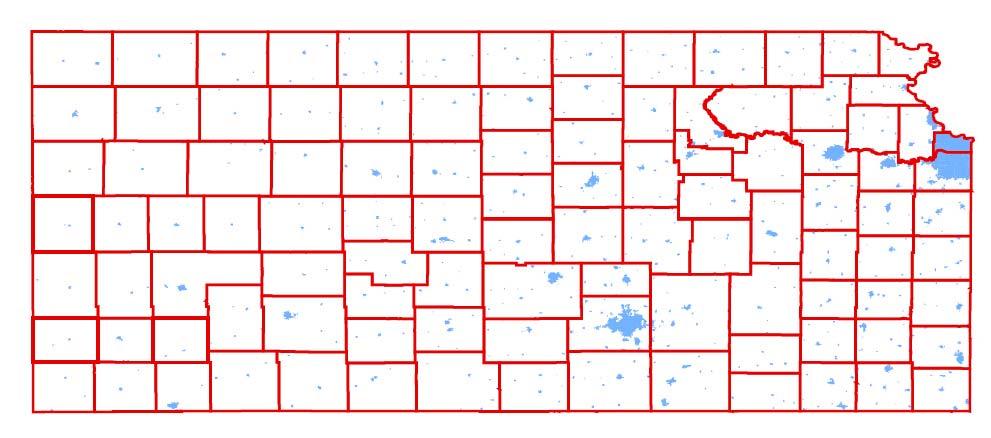
15 Distribution of Cases with No Street Addresses Beale Code* Problematic Cases Total Cases Percentage (%) * Higher Beale score indicates lower urbanization level
16 In Kansas, prostate cancer cases with no standard street addresses were more likely to be collected in the rural areas than in the urban areas.
17 Counties: 84 % vs. 100 % Cases
18 Without including the non-street addresses, the polygons in urban areas could appear as significant cluster.
19 ZCTAs: 84% Cancer Cases
20 ZCTAs : 100% Cancer Cases

21 Single Race Only: White
22 10 Counties/164 ZCTAs around Wichita
23 Conclusions: When analysis only includes the cases with street addresses, insignificant cancer clusters could appear significant statistically, which is more likely to happen in the urban areas in Kansas, and the identified clusters often appears with higher SMR. After adjusting for the covariates of underlying population density and age with real-world case dataset, ZCTAs produced a meaningful results, similar to counties or census tracts in both the presence of the significant clustering and the general location of the clusters. After considering race and urbanization factors, the clustering presence and cluster location remain by ZCTAs, worthy of further field investigation
24 Conclusion Continued: With the limit of boundary instability, there is the potential to conduct cluster analysis with cancer registry data using the aggregated units of ZCTAs 1. simplify the time-consuming geocoding operation in comparison to Census Tracts 2. utilize the geographically based census statistics in comparison to USPS ZIP codes 3. produce a geographic pattern with a finer resolution in comparison to counties
25 THANK YOU!
Acknowledgments xiii Preface xv. GIS Tutorial 1 Introducing GIS and health applications 1. What is GIS? 2
 Acknowledgments xiii Preface xv GIS Tutorial 1 Introducing GIS and health applications 1 What is GIS? 2 Spatial data 2 Digital map infrastructure 4 Unique capabilities of GIS 5 Installing ArcView and the
Census Geography, Geographic Standards, and Geographic Information
 Census Geography, Geographic Standards, and Geographic Information Michael Ratcliffe Geography Division US Census Bureau New Mexico State Data Center Data Users Conference November 19, 2015 Today s Presentation
Visualization of Origin- Destination Commuter Flow Using CTPP Data and ArcGIS
 Visualization of Origin- Destination Commuter Flow Using CTPP Data and ArcGIS Research & Analysis Department Southern California Association of Governments 2015 ESRI User Conference l July 23, 2015 l San
Utilizing Data from American FactFinder with TIGER/Line Shapefiles in ArcGIS
 Utilizing Data from American FactFinder with TIGER/Line Shapefiles in ArcGIS Web Adams, GISP Data Dissemination Specialist U.S. Census Bureau New York Regional Office 1 What We Do Decennial Census Every
Tracey Farrigan Research Geographer USDA-Economic Research Service
 Rural Poverty Symposium Federal Reserve Bank of Atlanta December 2-3, 2013 Tracey Farrigan Research Geographer USDA-Economic Research Service Justification Increasing demand for sub-county analysis Policy
ZIP Code Tabulation Areas For Census 2000
 ZIP Code Tabulation Areas For Census 2000 NCHS, CDC Andrew Flora June 13, 2000 TIGER Operations Branch Geography Division U S C E N S U S B U R E A U Helping You Make Informed Decisions ZIP Code Tabulations
FleXScan User Guide. for version 3.1. Kunihiko Takahashi Tetsuji Yokoyama Toshiro Tango. National Institute of Public Health
 FleXScan User Guide for version 3.1 Kunihiko Takahashi Tetsuji Yokoyama Toshiro Tango National Institute of Public Health October 2010 http://www.niph.go.jp/soshiki/gijutsu/index_e.html User Guide version
BROOKINGS May
 Appendix 1. Technical Methodology This study combines detailed data on transit systems, demographics, and employment to determine the accessibility of jobs via transit within and across the country s 100
Long Island Breast Cancer Study and the GIS-H (Health)
") Long Island Breast Cancer Study and the GIS-H (Health) Edward J. Trapido, Sc.D. Associate Director Epidemiology and Genetics Research Program, DCCPS/NCI COMPREHENSIVE APPROACHES TO CANCER CONTROL September,
Long Island Breast Cancer Study and the GIS-H (Health) Edward J. Trapido, Sc.D. Associate Director Epidemiology and Genetics Research Program, DCCPS/NCI COMPREHENSIVE APPROACHES TO CANCER CONTROL September,
GEOCODING SELF-REPORTED ADDRESSES: LESSONS LEARNED. Karyn Backus CT Department of Public Health
 GEOCODING SELF-REPORTED ADDRESSES: LESSONS LEARNED Karyn Backus CT Department of Public Health GEOCODING ADDRESSES The process of assigning a location to an address Collect the address information Use
Modeling Urban Sprawl: from Raw TIGER Data with GIS
 Modeling Urban Sprawl: from Raw TIGER Data with GIS Brady Foust University of Wisconsin-Eau Claire Lisa Theo University of Wisconsin-Stevens Point Modeling Urban Sprawl 1 Problem How to model & predict
Visualization of Commuter Flow Using CTPP Data and GIS
 Visualization of Commuter Flow Using CTPP Data and GIS Research & Analysis Department Southern California Association of Governments 2015 ESRI User Conference l July 23, 2015 l San Diego, CA Jung Seo,
Spatial Organization of Data and Data Extraction from Maptitude
 Spatial Organization of Data and Data Extraction from Maptitude N. P. Taliceo Geospatial Information Sciences The University of Texas at Dallas UT Dallas GIS Workshop Richardson, TX March 30 31, 2018 1/
Defining Statistically Significant Spatial Clusters of a Target Population using a Patient-Centered Approach within a GIS
 Defining Statistically Significant Spatial Clusters of a Target Population using a Patient-Centered Approach within a GIS Efforts to Improve Quality of Care Stephen Jones, PhD Bio-statistical Research
Neighborhood social characteristics and chronic disease outcomes: does the geographic scale of neighborhood matter? Malia Jones
 Neighborhood social characteristics and chronic disease outcomes: does the geographic scale of neighborhood matter? Malia Jones Prepared for consideration for PAA 2013 Short Abstract Empirical research
Areal Interpolation Methods using Land Cover and Street Data. Jeff Bourdier GIS Master s s Project Summer 2006
 Areal Interpolation Methods using Land Cover and Street Data Jeff Bourdier GIS Master s s Project Summer 2006 Objective The areal interpolation problem Some variable (here, population) is known in a given
Appendix B: Data Sources. In this exercise you will: Find data sources Download needed data
 In this exercise you will: Find data sources Download needed data California data Consult your instructor regarding California data sources. Page 2 National Park Service data Consult your instructor regarding
Rural Alabama. Jennifer Zanoni. Geography Division U.S. Census Bureau. Alabama State Data Center 2018 Data Conference Tuscaloosa, Alabama
 Rural Alabama Jennifer Zanoni Geography Division U.S. Census Bureau Alabama State Data Center 2018 Data Conference Tuscaloosa, Alabama May 17, 2018 Agenda Census Geography Urban/Rural Definitions County-based
GIS Level 2. MIT GIS Services
 GIS Level 2 MIT GIS Services http://libraries.mit.edu/gis Email: gishelp@mit.edu TOOLS IN THIS WORKSHOP - Definition Queries - Create a new field in the attribute table - Field Calculator - Add XY Data
Bayesian Hierarchical Models
 Bayesian Hierarchical Models Gavin Shaddick, Millie Green, Matthew Thomas University of Bath 6 th - 9 th December 2016 1/ 34 APPLICATIONS OF BAYESIAN HIERARCHICAL MODELS 2/ 34 OUTLINE Spatial epidemiology
Demographic Data. How to get it and how to use it (with caution) By Amber Keller
 By Amber Keller") Demographic Data How to get it and how to use it (with caution) By Amber Keller 101 Where does it come from? o The American Community Survey o Socio-economic characteristics of a population o Administered
Demographic Data How to get it and how to use it (with caution) By Amber Keller 101 Where does it come from? o The American Community Survey o Socio-economic characteristics of a population o Administered
Census 2000 ZCTAs ZIP Code Tabulation Areas Technical Documentation 2000
 Census 2000 ZCTAs ZIP Code Tabulation Areas Technical Documentation 2000 U S C E NSU SBUR E A U Helping You Make Informed Decisions Part 1: Technical Description The ZCTA technical documentation consists
2010 Census Data Release and Current Geographic Programs. Michaellyn Garcia Geographer Seattle Regional Census Center
 2010 Census Data Release and Current Geographic Programs Michaellyn Garcia Geographer Seattle Regional Census Center 2010 Center of Population Located approximately 2.7 miles northeast of Plato, Missouri
Working with Census 2000 Data from MassGIS
 Tufts University GIS Tutorial Working with Census 2000 Data from MassGIS Revised September 26, 2007 Overview In this tutorial, you will use pre-processed census data from Massachusetts to create maps of
GIS 520 Data Cardinality. Joining Tabular Data to Spatial Data in ArcGIS
 GIS 520 Data Cardinality Joining Tabular Data to Spatial Data in ArcGIS Joining Tabular Data to Spatial Data in ArcGIS Outline Working with Zip Code Data Data Cardinality Issues Exploring Data Format Requirements
Geographic Products and Data. Improvements in Spatial Accuracy and Accessing Data
 Geographic Products and Data Improvements in Spatial Accuracy and Accessing Data How it Began TIGER was internally developed to support the 1990 Decennial Census operations Used data sources such as USGS
The History Behind Census Geography
 The History Behind Census Geography Michael Ratcliffe Geography Division US Census Bureau Tennessee State Data Center August 8, 2017 Today s Presentation A brief look at the history behind some of the
Exercise on Using Census Data UCSB, July 2006
 Exercise on Using Census Data UCSB, July 2006 Purpose The purpose of this lab is to become familiar with Census Bureau data. Second, we will learn how to join tables which allows you to add data to the
Analyzing the Geospatial Rates of the Primary Care Physician Labor Supply in the Contiguous United States
 Analyzing the Geospatial Rates of the Primary Care Physician Labor Supply in the Contiguous United States By Russ Frith Advisor: Dr. Raid Amin University of W. Florida Capstone Project in Statistics April,
Updating the Urban Boundary and Functional Classification of New Jersey Roadways using 2010 Census data
 Updating the Urban Boundary and Functional Classification of New Jersey Roadways using 2010 Census data By: Glenn Locke, GISP, PMP 1 GIS-T May, 2013 Presentation Overview Purpose of Project Methodology
Frontier and Remote (FAR) Area Codes: A Preliminary View of Upcoming Changes John Cromartie Economic Research Service, USDA
 Area Codes: A Preliminary View of Upcoming Changes John Cromartie Economic Research Service, USDA") National Center for Frontier Communities webinar, January 27, 2015 Frontier and Remote (FAR) Area Codes: A Preliminary View of Upcoming Changes John Cromartie Economic Research Service, USDA The views
National Center for Frontier Communities webinar, January 27, 2015 Frontier and Remote (FAR) Area Codes: A Preliminary View of Upcoming Changes John Cromartie Economic Research Service, USDA The views
Tax Jurisdiction Sourcing Data Bases
 Tax Jurisdiction Sourcing Data Bases Reducing Cost and Improving Tax Determination via quality data base information Bob Meador Director, GeoTAX Product Management Group 1 Software Agenda Tax issues Tax
Targeted LiDAR use in Support of In-Office Address Canvassing (IOAC) March 13, 2017 MAPPS, Silver Spring MD
 March 13, 2017 MAPPS, Silver Spring MD") Targeted LiDAR use in Support of In-Office Address Canvassing (IOAC) March 13, 2017 MAPPS, Silver Spring MD Imagery, LiDAR, and Blocks In 2011, the GEO commissioned independent subject matter experts (Jensen,
Targeted LiDAR use in Support of In-Office Address Canvassing (IOAC) March 13, 2017 MAPPS, Silver Spring MD Imagery, LiDAR, and Blocks In 2011, the GEO commissioned independent subject matter experts (Jensen,
WlLPEN L. GORR KRISTEN S. KURLAND. Universitats- und Landesbibliothek. Bibliothek Architektur und Stadtebau ESRI
 hj WlLPEN L. GORR KRISTEN S. KURLAND Universitats- und Landesbibliothek Darmstadt Bibliothek Architektur und Stadtebau ESRI Contents Acknowledgments Preface xvii XV GIS Tutorial 1 Introduction Launch ArcMap
Colm O Muircheartaigh
 THERE AND BACK AGAIN: DEMOGRAPHIC SURVEY SAMPLING IN THE 21 ST CENTURY Colm O Muircheartaigh, University of Chicago Page 1 OVERVIEW History of Demographic Survey Sampling 20 th Century Sample Design New
The Road to Data in Baltimore
 Creating a parcel level database from high resolution imagery By Austin Troy and Weiqi Zhou University of Vermont, Rubenstein School of Natural Resources State and local planning agencies are increasingly
A Comprehensive Method for Identifying Optimal Areas for Supermarket Development. TRF Policy Solutions April 28, 2011
 A Comprehensive Method for Identifying Optimal Areas for Supermarket Development TRF Policy Solutions April 28, 2011 Profile of TRF The Reinvestment Fund builds wealth and opportunity for lowwealth communities
Cluster Analysis using SaTScan
 Cluster Analysis using SaTScan Summary 1. Statistical methods for spatial epidemiology 2. Cluster Detection What is a cluster? Few issues 3. Spatial and spatio-temporal Scan Statistic Methods Probability
GIS Lecture 5: Spatial Data
 GIS Lecture 5: Spatial Data GIS 1 Outline Vector Data Formats Raster Data Formats Map Projections Coordinate Systems US Census geographic files US Census data files GIS Data Sources GIS 2 Vector Data Formats
The History Behind Census Geography
 The History Behind Census Geography Michael Ratcliffe Geography Division US Census Bureau Kentucky State Data Center Affiliate Meeting August 5, 2016 Today s Presentation A brief look at the history behind
SaTScan TM. User Guide. for version 7.0. By Martin Kulldorff. August
 SaTScan TM User Guide for version 7.0 By Martin Kulldorff August 2006 http://www.satscan.org/ Contents Introduction... 4 The SaTScan Software... 4 Download and Installation... 5 Test Run... 5 Sample Data
John Laznik 273 Delaplane Ave Newark, DE (302)
") Office Address: John Laznik 273 Delaplane Ave Newark, DE 19711 (302) 831-0479 Center for Applied Demography and Survey Research College of Human Services, Education and Public Policy University of Delaware
Office Address: John Laznik 273 Delaplane Ave Newark, DE 19711 (302) 831-0479 Center for Applied Demography and Survey Research College of Human Services, Education and Public Policy University of Delaware
Cluster Analysis using SaTScan. Patrick DeLuca, M.A. APHEO 2007 Conference, Ottawa October 16 th, 2007
 Cluster Analysis using SaTScan Patrick DeLuca, M.A. APHEO 2007 Conference, Ottawa October 16 th, 2007 Outline Clusters & Cluster Detection Spatial Scan Statistic Case Study 28 September 2007 APHEO Conference
GIS for Actuaries Part 1 CAS RPM Garrett Bradford March 15, 2016
 GIS for Actuaries Part 1 CAS RPM 2016 Garrett Bradford March 15, 2016 GIS for Actuaries Workshop Outline I. Introduction to GIS: the basics II. Geocoding, Uncertainty, and GIS Data Sources III. Spatial
Rural Pennsylvania: Where Is It Anyway? A Compendium of the Definitions of Rural and Rationale for Their Use
 Rural Pennsylvania: Where Is It Anyway? A Compendium of the Definitions of Rural and Rationale for Their Use Pennsylvania Office of Rural Health 310 Nursing Sciences Building University Park, PA 16802
The Joys of Geocoding (from a Spatial Statistician s Perspective)
") The Joys of Geocoding (from a Spatial Statistician s Perspective) Dale L. Zimmerman University of Iowa October 21, 2010 2 Geocoding context Applications of spatial statistics to public health and social
The Joys of Geocoding (from a Spatial Statistician s Perspective) Dale L. Zimmerman University of Iowa October 21, 2010 2 Geocoding context Applications of spatial statistics to public health and social
Dan Goldberg GIS Research Laboratory Department of Computer Science University of Southern California https://webgis.usc.edu
 Presented to: CSCI 548 Information Integration on the Web 04-20-2009 Dan Goldberg GIS Research Laboratory Department of Computer Science University of Southern California https://webgis.usc.edu 1 (Very)
Railway suicide clusters: how common are they and what predicts them? Lay San Too Jane Pirkis Allison Milner Lyndal Bugeja Matthew J.
 Railway suicide clusters: how common are they and what predicts them? Lay San Too Jane Pirkis Allison Milner Lyndal Bugeja Matthew J. Spittal Overview Background Aims Significance Methods Results Conclusions
Spatial Clusters of Rates
 Spatial Clusters of Rates Luc Anselin http://spatial.uchicago.edu concepts EBI local Moran scan statistics Concepts Rates as Risk from counts (spatially extensive) to rates (spatially intensive) rate =
USING CLUSTERING SOFTWARE FOR EXPLORING SPATIAL AND TEMPORAL PATTERNS IN NON-COMMUNICABLE DISEASES
 USING CLUSTERING SOFTWARE FOR EXPLORING SPATIAL AND TEMPORAL PATTERNS IN NON-COMMUNICABLE DISEASES Mariana Nagy "Aurel Vlaicu" University of Arad Romania Department of Mathematics and Computer Science
Hennepin GIS. Tree Planting Priority Areas - Analysis Methodology. GIS Services April 2018 GOAL:
 Hennepin GIS GIS Services April 2018 Tree Planting Priority Areas - Analysis Methodology GOAL: To create a GIS data layer that will aid Hennepin County Environment & Energy staff in determining where to
Institutional Research with Public Data and Open Source Software
 2017 Institutional Research with Public Data and Open Source Software DUE1304591, 1644409, 1700496 Opinions expressed are those of the authors and not necessarily those of the National Science Foundation.
Luc Anselin Spatial Analysis Laboratory Dept. Agricultural and Consumer Economics University of Illinois, Urbana-Champaign
 GIS and Spatial Analysis Luc Anselin Spatial Analysis Laboratory Dept. Agricultural and Consumer Economics University of Illinois, Urbana-Champaign http://sal.agecon.uiuc.edu Outline GIS and Spatial Analysis
Valdosta State University Strategic Research & Analysis
 Christopher Neasbitt, Programmer Analyst Associate (cjneasbi@valdosta.edu) Kristina M. Cragg, Ph.D., Assistant to the President for Strategic Research & Analysis (kmcragg@valdosta.edu) Amir Atabekov, Student
NSF CNH-Ex # Political Fragmentation Indicator Database (Version 3.01)
") NSF CNH-Ex #1114931 Political Fragmentation Indicator Database (Version 3.01) February 2014 NSF CNH-Ex #1114931 Project Team Jae Hong Kim (jaehk6@uci.edu) Timothy Keane (whisker@ksu.edu) 1 Introduction
NSF CNH-Ex #1114931 Political Fragmentation Indicator Database (Version 3.01) February 2014 NSF CNH-Ex #1114931 Project Team Jae Hong Kim (jaehk6@uci.edu) Timothy Keane (whisker@ksu.edu) 1 Introduction
GIS Lecture 4: Data. GIS Tutorial, Third Edition GIS 1
 GIS Lecture 4: Data GIS 1 Outline Data Types, Tables, and Formats Geodatabase Tabular Joins Spatial Joins Field Calculator ArcCatalog Functions GIS 2 Data Types, Tables, Formats GIS 3 Directly Loadable
Dasymetric Mapping Using High Resolution Address Point Datasets
 : 5 27 Research Article Dasymetric Mapping Using High Resolution Address Point Datasets Paul A Zandbergen Department of Geography University of New Mexico Abstract Mismatching sets of boundaries present
Urban Growth and Development Using SLEUTH: Philadelphia Metropolitan Region
 Urban Growth and Development Using SLEUTH: Philadelphia Metropolitan Region ALYSSA LYND CODY HITT GUS FREDERICK 1.0 INTRODUCTION The metropolitan and suburban regions of Philadelphia and its surrounding
A spatial scan statistic for multinomial data
 A spatial scan statistic for multinomial data Inkyung Jung 1,, Martin Kulldorff 2 and Otukei John Richard 3 1 Department of Epidemiology and Biostatistics University of Texas Health Science Center at San
Using Geographic Information Systems for Exposure Assessment
 Using Geographic Information Systems for Exposure Assessment Ravi K. Sharma, PhD Department of Behavioral & Community Health Sciences, Graduate School of Public Health, University of Pittsburgh, Pittsburgh,
Improving TIGER, Hidden Costs: The Uncertain Correspondence of 1990 and 2010 U.S. Census Geography
 Improving TIGER, Hidden Costs: The Uncertain Correspondence of 1990 and 2010 U.S. Census Geography Jonathan P. Schroeder ABSTRACT: The U.S. Census Bureau supplies GIS-compatible definitions of census geographic
Techniques for Science Teachers: Using GIS in Science Classrooms.
 Techniques for Science Teachers: Using GIS in Science Classrooms. After ESRI, 2008 GIS A Geographic Information System A collection of computer hardware, software, and geographic data used together for
Using American Factfinder
 Using American Factfinder What is American Factfinder? American Factfinder is a search engine that provides access to the population, housing and economic data collected by the U.S. Census Bureau. It can
These modules are covered with a brief information and practical in ArcGIS Software and open source software also like QGIS, ILWIS.
 Online GIS Training and training modules covered are: 1. ArcGIS, Analysis, Fundamentals and Implementation 2. ArcGIS Web Data Sharing 3. ArcGIS for Desktop 4. ArcGIS for Server These modules are covered
Housing Action Illinois Membership Coverage and Recommended New Office Location
 Housing Action Illinois Membership Coverage and Recommended New Office Location Housing Action Illinois GEO 242: GIS II Dr. Hwang March 10, 2011 Alex Bordens Jeffrey Lind Sergio Mendoza Brad Nosan Mercedes
1Department of Demography and Organization Studies, University of Texas at San Antonio, One UTSA Circle, San Antonio, TX
 Well, it depends on where you're born: A practical application of geographically weighted regression to the study of infant mortality in the U.S. P. Johnelle Sparks and Corey S. Sparks 1 Introduction Infant
An Introduction to SaTScan
 An Introduction to SaTScan Software to measure spatial, temporal or space-time clusters using a spatial scan approach Marilyn O Hara University of Illinois moruiz@illinois.edu Lecture for the Pre-conference
Are You Maximizing The Value Of All Your Data?
 Are You Maximizing The Value Of All Your Data? Using The SAS Bridge for ESRI With ArcGIS Business Analyst In A Retail Market Analysis SAS and ESRI: Bringing GIS Mapping and SAS Data Together Presented
Data Aggregation with InfraWorks and ArcGIS for Visualization, Analysis, and Planning
 Data Aggregation with InfraWorks and ArcGIS for Visualization, Analysis, and Planning Stephen Brockwell President, Brockwell IT Consulting, Inc. Join the conversation #AU2017 KEYWORD Class Summary Silos
Medical GIS: New Uses of Mapping Technology in Public Health. Peter Hayward, PhD Department of Geography SUNY College at Oneonta
 Medical GIS: New Uses of Mapping Technology in Public Health Peter Hayward, PhD Department of Geography SUNY College at Oneonta Invited research seminar presentation at Bassett Healthcare. Cooperstown,
CWPP_Wildland_Urban_Interface_Boundaries
 Page 1 of 7 CWPP_Wildland_Urban_Interface_Boundaries Data format: Shapefile File or table name: CWPP_Wildland_Urban_Interface_Boundaries Coordinate system: Lambert Conformal Conic Theme keywords: Wildland
GIS for the Non-Expert
 GIS for the Non-Expert Ann Forsyth University of Minnesota February 2006 GIS for the Non-Expert 1. Definitions and problems 2. Measures being tested in Twin Cities Walking Study Basic approach, data, variables
Outline. Practical Point Pattern Analysis. David Harvey s Critiques. Peter Gould s Critiques. Global vs. Local. Problems of PPA in Real World
 Outline Practical Point Pattern Analysis Critiques of Spatial Statistical Methods Point pattern analysis versus cluster detection Cluster detection techniques Extensions to point pattern measures Multiple
Catalogue No. 92F0146GIE. Dissemination Area Reference Maps 2001 Census Reference Guide
 Catalogue No. 92F0146GIE Dissemination Area Reference Maps 2001 Census Reference Guide How to obtain more information For information on the wide range of data available from Statistics Canada, you can
Background of Project
 RELOCATION OF GRESHAM FIRE STATION #76 Mike Shelby Annie Scriven Andrea Consalus Background of Project Wanted to do a project that was meaningful Contacted Molly Vogt, GIS Manager at City of Gresham Informed
Analysis of Bank Branches in the Greater Los Angeles Region
 Analysis of Bank Branches in the Greater Los Angeles Region Brian Moore Introduction The Community Reinvestment Act, passed by Congress in 1977, was written to address redlining by financial institutions.
Using ArcGIS Server to Bring Geospatial Analysis
 Using ArcGIS Server to Bring Geospatial Analysis and Mapping to non-gis Analysts ESRI Health User Conference September 22, 2009 Jim Laramie, Altarum Institute Sam Wang, Altarum Institute Agenda Agenda
Outline. ArcGIS? ArcMap? I Understanding ArcMap. ArcMap GIS & GWR GEOGRAPHICALLY WEIGHTED REGRESSION. (Brief) Overview of ArcMap
 Overview of ArcMap") GEOGRAPHICALLY WEIGHTED REGRESSION Outline GWR 3.0 Software for GWR (Brief) Overview of ArcMap Displaying GWR results in ArcMap stewart.fotheringham@nuim.ie http://ncg.nuim.ie ncg.nuim.ie/gwr/ ArcGIS?
GEOGRAPHICALLY WEIGHTED REGRESSION Outline GWR 3.0 Software for GWR (Brief) Overview of ArcMap Displaying GWR results in ArcMap stewart.fotheringham@nuim.ie http://ncg.nuim.ie ncg.nuim.ie/gwr/ ArcGIS?
Lecture 9: Geocoding & Network Analysis
 Massachusetts Institute of Technology - Department of Urban Studies and Planning 11.520: A Workshop on Geographic Information Systems 11.188: Urban Planning and Social Science Laboratory Lecture 9: Geocoding
Geospatial Analysis of Job-Housing Mismatch Using ArcGIS and Python
 Geospatial Analysis of Job-Housing Mismatch Using ArcGIS and Python 2016 ESRI User Conference June 29, 2016 San Diego, CA Jung Seo, Frank Wen, Simon Choi and Tom Vo, Research & Analysis Southern California
GIS Spatial Statistics for Public Opinion Survey Response Rates
 GIS Spatial Statistics for Public Opinion Survey Response Rates July 22, 2015 Timothy Michalowski Senior Statistical GIS Analyst Abt SRBI - New York, NY t.michalowski@srbi.com www.srbi.com Introduction
Developing Spatial Data to Support Statistical Analysis of Education
 Developing Spatial Data to Support Statistical Analysis of Education Doug Geverdt National Center for Education Statistics Education Demographic and Geographic Estimates (EDGE) Program 2016 ESRI User Conference
The Building Blocks of the City: Points, Lines and Polygons
 The Building Blocks of the City: Points, Lines and Polygons Andrew Crooks Centre For Advanced Spatial Analysis andrew.crooks@ucl.ac.uk www.gisagents.blogspot.com Introduction Why use ABM for Residential
DRAFT RURAL-URBAN POPULATION CHANGE IN PUERTO RICO, 1990 TO 2000
 DRAFT RURAL-URBAN POPULATION CHANGE IN PUERTO RICO, 1990 TO 2000 Mei-Ling Freeman Geographic Standards and Criteria Branch Geography Division US Census Bureau For presentation at the Western Regional Science
Outline. Chapter 1. A history of products. What is ArcGIS? What is GIS? Some GIS applications Introducing the ArcGIS products How does GIS work?
 Outline Chapter 1 Introducing ArcGIS What is GIS? Some GIS applications Introducing the ArcGIS products How does GIS work? Basic data formats The ArcCatalog interface 1-1 1-2 A history of products Arc/Info
Demographic characteristics of the School of International Studies 9 th Grade class and their success their first semester.
 Project Tutorial 1. Topic Demographic characteristics of the School of International Studies 9 th Grade class and their success their first semester. 2. Research Question/Problem For the 9 th Grade class
College Of Science Engineering Health: GIS at UWF
 College Of Science Engineering Health: GIS at UWF GIS here on campus GeoData Center, Nathan McKinney + student lab assistants GIS Certificate, Dr. Zhiyong Hu, GA s helping with courses GIS Online Director,
Presented by Mark Coding & Rohan Richards National Spatial Data Management Division, Jamaica Esri User Conference 2014
 Presented by Mark Coding & Rohan Richards National Spatial Data Management Division, Jamaica Esri User Conference 2014 Children continue to account for a large percentage of missing persons in Jamaica.
Popular Mechanics, 1954
 Introduction to GIS Popular Mechanics, 1954 1986 $2,599 1 MB of RAM 2017, $750, 128 GB memory, 2 GB of RAM Computing power has increased exponentially over the past 30 years, Allowing the existence of
Keywords: Air Quality, Environmental Justice, Vehicle Emissions, Public Health, Monitoring Network
 NOTICE: this is the author s version of a work that was accepted for publication in Transportation Research Part D: Transport and Environment. Changes resulting from the publishing process, such as peer
Changes in Transportation Infrastructure and Commuting Patterns in U.S. Metropolitan Areas,
 Changes in Transportation Infrastructure and Commuting Patterns in U.S. Metropolitan Areas, 1960-2000 Nathaniel Baum-Snow Department of Economics Box B Brown University Providence, RI 02912 Nathaniel_Baum-Snow@brown.edu
Introducing GIS analysis
 1 Introducing GIS analysis GIS analysis lets you see patterns and relationships in your geographic data. The results of your analysis will give you insight into a place, help you focus your actions, or
Big-Geo-Data EHR Infrastructure Development for On-Demand Analytics
 Big-Geo-Data EHR Infrastructure Development for On-Demand Analytics Sohayla Pruitt, MA Senior Geospatial Scientist Duke Medicine DUHS DHTS EIM HIRS Page 1 Institute of Medicine, World Health Organization,
Policy Paper Alabama Primary Care Service Areas
 Aim and Purpose Policy Paper Alabama Primary Care Service Areas Produced by the Office for Family Health Education & Research, UAB School of Medicine To create primary care rational service areas (PCSA)
Census Transportation Planning Products (CTPP)
") Census Transportation Planning Products (CTPP) Penelope Weinberger CTPP Program Manager - AASHTO September 15, 2010 1 What is the CTPP Program Today? The CTPP is an umbrella program of data products, custom
Census Transportation Planning Products (CTPP) Penelope Weinberger CTPP Program Manager - AASHTO September 15, 2010 1 What is the CTPP Program Today? The CTPP is an umbrella program of data products, custom
Deriving Population Exposure Fatality Rate Estimates for Tornado Outbreaks Using Geographic Information Systems (GIS)
") Deriving Population Exposure Fatality Rate Estimates for Tornado Outbreaks Using Geographic Information Systems (GIS) Amber R. Cannon 1, 2, K. Klockow 3, R. Peppler 4, H. Brooks 5 1 National Weather Center
Deriving Population Exposure Fatality Rate Estimates for Tornado Outbreaks Using Geographic Information Systems (GIS) Amber R. Cannon 1, 2, K. Klockow 3, R. Peppler 4, H. Brooks 5 1 National Weather Center
Sidestepping the box: Designing a supplemental poverty indicator for school neighborhoods
 Sidestepping the box: Designing a supplemental poverty indicator for school neighborhoods Doug Geverdt National Center for Education Statistics Laura Nixon U.S. Census Bureau 2018 Annual meeting of the
Geodatabase for Sustainable Urban Development. Presented By Rhonda Maronn Maurice Johns Daniel Ashney Jack Anliker
 Geodatabase for Sustainable Urban Development Presented By Rhonda Maronn Maurice Johns Daniel Ashney Jack Anliker Objective Build a Geodatabase that will enable urban planners to create and assess the
1 ST High Level Forum on United Nations Global Geoespatial Information Management GEOGRAPHIC REFERENCING OF ECONOMIC UNITS. México
 1 ST High Level Forum on United Nations Global Geoespatial Information Management Thematic Seminar 27 October, Korea 2011. GEOGRAPHIC REFERENCING OF ECONOMIC UNITS México CONTENTS Introduction Census Cartography
Neighborhood Locations and Amenities
 University of Maryland School of Architecture, Planning and Preservation Fall, 2014 Neighborhood Locations and Amenities Authors: Cole Greene Jacob Johnson Maha Tariq Under the Supervision of: Dr. Chao