DEVELOPING DECISION SUPPORT TOOLS FOR THE IMPLEMENTATION OF BICYCLE AND PEDESTRIAN SAFETY STRATEGIES
|
|
|
- Alan Walsh
- 5 years ago
- Views:
Transcription


1 DEVELOPING DECISION SUPPORT TOOLS FOR THE IMPLEMENTATION OF BICYCLE AND PEDESTRIAN SAFETY STRATEGIES Deo Chimba, PhD., P.E., PTOE Associate Professor Civil Engineering Department Tennessee State University 3500 John A. Merritt Blvd, Nashville, TN Phone:
2 STATEMENT OF THE PROBLEM Tennessee Department of Transportation (TDOT) has an extensive road safety audit program which uses criteria based on the ratio of crashes to average daily traffic but does not target locations with a high number of bike/pedestrians crashes since there are no bicycle and pedestrian counts. A robust methodology is not currently available to identify bicycle and pedestrian high-crash locations in Tennessee. The challenge is allocating funds, from TDOT s Highway Safety Improvement Program (HSIP), equitably among rural and urban areas in a way that is most effective at reducing bicycle and pedestrian fatalities and incapacitating injuries.
3 Research Questions? Are there spatial variations in pedestrian and bicycle crashes? How do spatial variations in pedestrian and bicycle crashes associate with socioeconomic and demographic factors? What framework can be adopted to implement bicycle and pedestrian safety strategies?
4 Develop Data-Driven Policy Framework Develop criteria and conditions for the systematic identification of bicycle and pedestrian high-crash locations in the state. These criteria will rate each crash-prone location based on injuries and fatalities, coupled with exposure. Develop a systematic framework and rating system for future years so that the analysis can be replicated in the future with less effort. Prioritize funding for improvements. To support the development of a data-driven draft policy for prioritizing and maximizing the effectiveness of HSIP fund allocation. The policy framework will be developed with the support of TDOT staff. This policy framework will direct current and future decision makers at TDOT and other agencies in the prioritization of funding.
5 Study Approach Developed a framework to identify bicycle and pedestrian high crash locations for safety improvement prioritization focusing on Population, Demographic and Socioeconomic Spectra in Tennessee Research approach comprised in-depth analysis using a combination of existing data, literature review, GIS, cluster analysis, and advanced statistical modeling to examine and identify bicycle and pedestrian high-crash locations. Relevant data from each of the selected study locations was integrated into a Geographic Information System (GIS). The data included crashes, roadway geometry, population, demographics and economic, and traffic. The study used the gathered data and information to develop safety performance functions (SPF) to identify magnitude and characteristics of variables associated with pedestrian and bicycle safety hazardous locations (black spots). From the SPF, the research developed tool to evaluate the expected number of crashes at block and county levels for given set of population, demographics and socioeconomic data in Tennessee
6 Data Three types of data were used; Crash data Socioeconomic data Demographic data
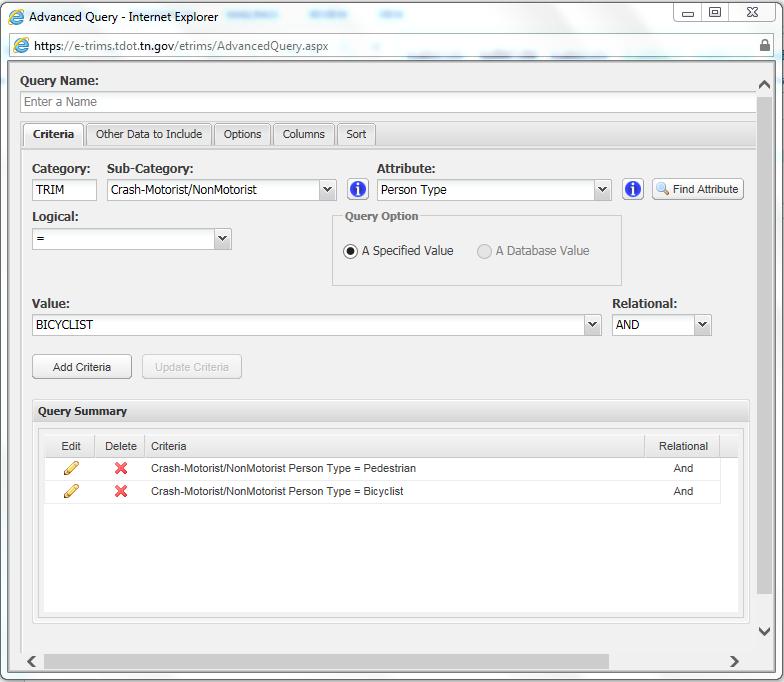
7 TDOT Crash Database-TRIMS
8 Socioeconomic and Demographic data TIGER Products ( Topologically Integrated Geographic Encoding and Referencing)
9 Data Crash data Socioeconomic data Demographic data Obtained from TDOT traffic crash database 5 years data: 5,845 pedestrian crash records 5 years data: 2,185 bicycle crash records US census bureau, America Community Survey Block group data for Tennessee Income, Car ownership, poverty status, Transport mode to work US census bureau, America Community Survey Block group data for Tennessee Population counts, age, race

10 Type of Crash Pedestrian Bicyclist Fatal Incapacitating Injury Non- Incapacitating Injury Prop Damage (over) Prop Damage (under) Grand Total Year of Crash Pedestrian Bicyclist Grand Total Crash Data Statistics
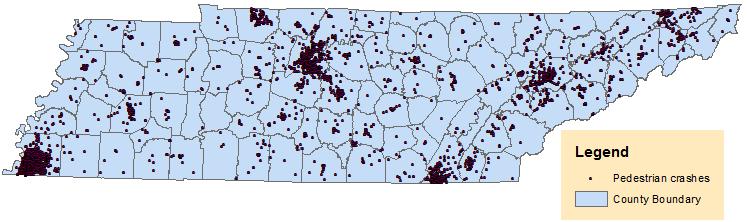

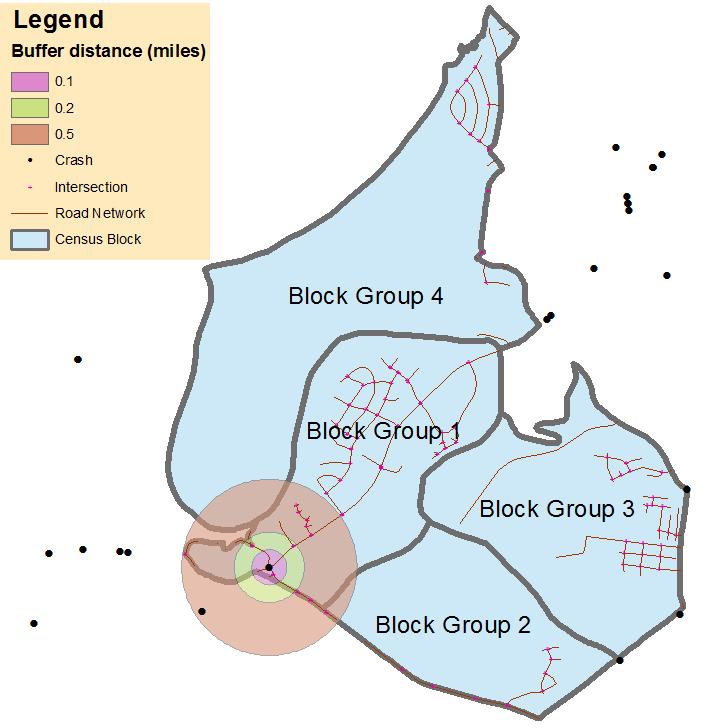
11 Spatial distribution of crashes
12 Variable Mean Std. Dev. Min Max Population density (1000 per sq. Mile) Population below 15 years of age (%) Population from 15 to 64 years of age (%) Population commuting to work by private cars (%) Population commuting to work by walking (%) Median household income ("000" $) Housing units with no vehicles (%)

13 Cluster Analysis


14 Cluster Analysis

15 Where are high risk census block groups?

16 High crash census block groups High crash census block groups

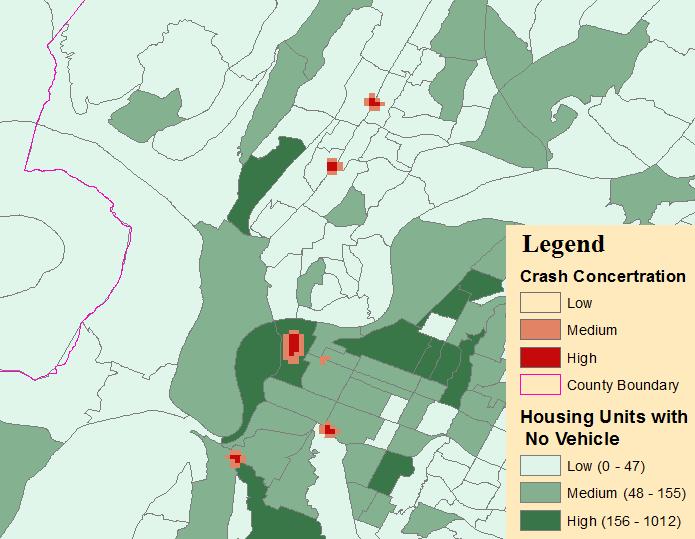


17 Where are these clusters?
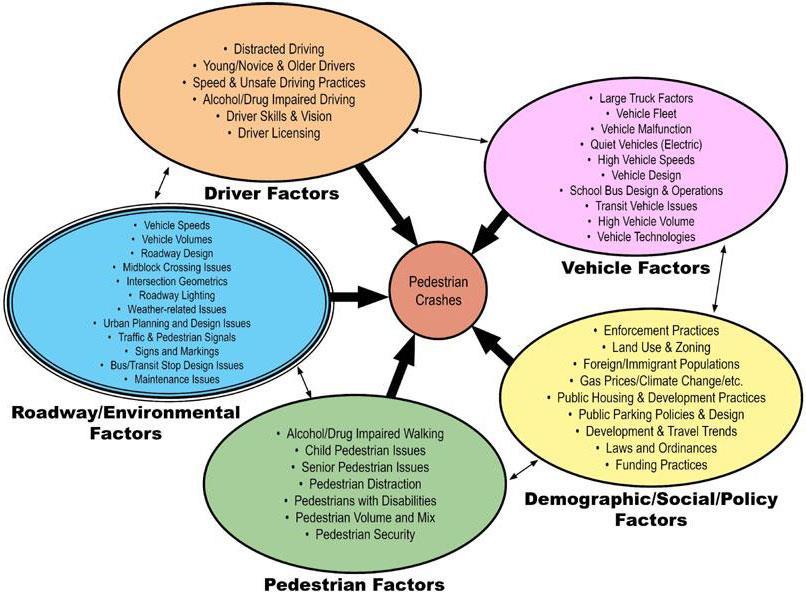
18 The process of Pedestrian/Bicycle-vehicle crashes

19
20 Developing Safety Performance Functions (SPFs) y i number of crashes occurring in a certain period at a site i λ i is the Poisson parameter for site i, which is equal to site expected number of crashes at a period, E (y i ). Poisson assumes the mean =Variance Poisson Negative Binomial For crash data the mean Variance VAR (y i ) > E (y i ) Overdispersion α is the overdispersion factor µ is the mean of crashes
21 What are the associated factors-block Group? Variable Coefficient Z p-value Population density (1000 per sq. mile) Population below 15 years of age (%) Population from 15 to 64 years of age (%) Population commuting to work by private cars (%) Population commuting to work by walking (%) Median household income ("000" $) Housing units with no vehicles (%) Constant Population Exposure alpha 1.586
22 What are the associated factors-county? Variable Coefficient z P-value Population below 15 years of age (%) Population from 15 to 64 years of age (%) Population of White (%) Population of African American (%) Population of Hispanic (%) Population commuting to work by private cars (%) Population commuting to work by walking (%) Median household income ("000" $) Housing units with no vehicles (%) Constant Population Exposure alpha 0.11
23 Developed Crash Prediction Model (SPF)

24 Prediction accuracy
25 Integrating SPFs with Access Database User friendly: Unlike crash prediction models that are expressed in form of complicated equations and time consuming; this tool simplifies this process. It is built in form of a database: With huge amounts of data now available, local and national agencies are now building their database. It helps users to gain more insight into the relationships between crashes and sociodemographic factors by varying the values of contributing factors.
26 Flow Chart of the Decision Support Tool

27 Interface of Decision Support system

28
29 Let s look at it..\tool\decision Support Tool.accdb Applications?
30 Deliverables Conference proceedings and presentations 1. Musinguzi, A and Chimba, D. Spatial variation in local road pedestrian and bicycle crashes. Presented and published in proceedings of ESRI International User annual Conference, San Diego, CA, 7/21/ Musinguzi, A and Chimba, D. Using Spatial Statistical Tools to correlate Bicycle and Pedestrian Crashes with Socio- demographics. Presented at TSU 37 th Annual University-Wide Research Symposium, 2015; 4/2/ Musinguzi, A and Chimba, D. Bayesian logistic regression analysis of socioeconomic and demographic factors and pedestrian crash counts. Presented at Southern District ITE Annual Meeting, MS, 4/19/ Kidando, E, Musinguzi, A and Chimba, D. Bayesian hierarchical analysis of pedestrian crashes and sociodemographic factors Presented at the 2 nd Summer Conference on Livable Communities, Kalamazoo, MI, 7/23/2015. Award of best Student poster presentation 5. Musinguzi, A and Chimba, D. An Access-Based Decision Support Tool for Assessing Bicycle and Pedestrian Safety. Presented at TSU 38 th Annual University-Wide Research Symposium, 2016 Papers under peer review 7. Musinguzi, A and Chimba D. Using kernel density to evaluate dependence of pedestrian crashes on demographic and socioeconomic factors. 8. Musinguzi, A and Chimba, D Adaptive neuro-fuzzy inference system (ANFIS) approach for pedestrian injury analysis. 9. Musinguzi, A, Chimba, D and Kidando, E. A Regression-Bayesian network hybrid approach for pedestrian injury analysis.
Spatial Variation in Local Road Pedestrian and Bicycle Crashes
 2015 Esri International User Conference July 20 24, 2015 San Diego, California Spatial Variation in Local Road Pedestrian and Bicycle Crashes Musinguzi, Abram, Graduate Research Assistant Chimba,Deo, PhD.,
Development of Decision Support Tools to Assess Pedestrian and Bicycle Safety: Focus on Population, Demographic and Socioeconomic FINAL REPORT
 TRCLC 14-07 June 30, 2016 Development of Decision Support Tools to Assess Pedestrian and Bicycle Safety: Focus on Population, Demographic and Socioeconomic Spectra FINAL REPORT Deo Chimba, PhD, PE., PTOE
Spatial variation in local road pedestrian and bicycle crashes
 Spatial variation in local road pedestrian and bicycle crashes *Abram Musinguzi Graduate Research Assistant Department of Civil Engineering Tennessee State University 3500 John A Merritt Blvd Nashville,
Geospatial Big Data Analytics for Road Network Safety Management
 Proceedings of the 2018 World Transport Convention Beijing, China, June 18-21, 2018 Geospatial Big Data Analytics for Road Network Safety Management ABSTRACT Wei Liu GHD Level 1, 103 Tristram Street, Hamilton,
ENHANCING ROAD SAFETY MANAGEMENT WITH GIS MAPPING AND GEOSPATIAL DATABASE
 Abstract ENHANCING ROAD SAFETY MANAGEMENT WITH GIS MAPPING AND GEOSPATIAL DATABASE Dr Wei Liu GHD Reliable and accurate data are needed in each stage of road safety management in order to correctly identify
MACRO-LEVEL ANALYSIS OF THE IMPACTS OF URBAN FACTORS ON TAFFIC CRASHES: A CASE STUDY OF CENTRAL OHIO
 Paper presented at the 52nd Annual Meeting of the Western Regional Science Association, Santa Barbara, February 24-27, 2013. MACRO-LEVEL ANALYSIS OF THE IMPACTS OF URBAN FACTORS ON TAFFIC CRASHES: A CASE
Developing Built Environment Indicators for Urban Oregon. Dan Rubado, MPH EPHT Epidemiologist Oregon Public Health Division
 Developing Built Environment Indicators for Urban Oregon Dan Rubado, MPH EPHT Epidemiologist Oregon Public Health Division What is the built environment? The built environment encompasses spaces and places
Comparative Analysis of Zonal Systems for Macro-level Crash Modeling: Census Tracts, Traffic Analysis Zones, and Traffic Analysis Districts
 Comparative Analysis of Zonal Systems for Macro-level Crash Modeling: Census Tracts, Traffic Analysis Zones, and Traffic Analysis Districts Qing Cai* Mohamed Abdel-Aty Jaeyoung Lee Naveen Eluru Department
Assessing Social Vulnerability to Biophysical Hazards. Dr. Jasmine Waddell
 Assessing Social Vulnerability to Biophysical Hazards Dr. Jasmine Waddell About the Project Built on a need to understand: The pre-disposition of the populations in the SE to adverse impacts from disaster
Advancing Transportation Performance Management and Metrics with Census Data
 Advancing Transportation Performance Management and Metrics with Census Data Authors: Ivana Tasic, University of Utah, Department of Civil and Environmental Engineering, 110 Central Campus Drive, Salt
Local Calibration Factors for Implementing the Highway Safety Manual in Maine
 Local Calibration Factors for Implementing the Highway Safety Manual in Maine 2017 Northeast Transportation Safety Conference Cromwell, Connecticut October 24-25, 2017 MAINE Darryl Belz, P.E. Maine Department
How GIS Can Help With Tribal Safety Planning
 How GIS Can Help With Tribal Safety Planning Thomas A. Horan, PhD Brian Hilton, PhD Arman Majidi, MAIS Center for Information Systems and Technology Claremont Graduate University Goals & Objectives This
NJDOT Pedestrian Safety Analysis Tool 2015 GIS T Conference
 NJDOT Pedestrian Safety Analysis Tool 2015 GIS T Conference NJDOT Pedestrian Safety Analysis Tool Justin Furch GIT Department Manager Michael Baker International Pedestrian Safety in NJ: Has the highest
Environmental Analysis, Chapter 4 Consequences, and Mitigation
 Environmental Analysis, Chapter 4 4.17 Environmental Justice This section summarizes the potential impacts described in Chapter 3, Transportation Impacts and Mitigation, and other sections of Chapter 4,
Demographic Data in ArcGIS. Harry J. Moore IV
 Demographic Data in ArcGIS Harry J. Moore IV Outline What is demographic data? Esri Demographic data - Real world examples with GIS - Redistricting - Emergency Preparedness - Economic Development Next
FHWA Planning Data Resources: Census Data Planning Products (CTPP) HEPGIS Interactive Mapping Portal
 HEPGIS Interactive Mapping Portal") FHWA Planning Data Resources: Census Data Planning Products (CTPP) HEPGIS Interactive Mapping Portal Jeremy Raw, P.E. FHWA, Office of Planning, Systems Planning and Analysis August 2017 Outline Census
FHWA Planning Data Resources: Census Data Planning Products (CTPP) HEPGIS Interactive Mapping Portal Jeremy Raw, P.E. FHWA, Office of Planning, Systems Planning and Analysis August 2017 Outline Census
Impact of Metropolitan-level Built Environment on Travel Behavior
 Impact of Metropolitan-level Built Environment on Travel Behavior Arefeh Nasri 1 and Lei Zhang 2,* 1. Graduate Research Assistant; 2. Assistant Professor (*Corresponding Author) Department of Civil and
Medical GIS: New Uses of Mapping Technology in Public Health. Peter Hayward, PhD Department of Geography SUNY College at Oneonta
 Medical GIS: New Uses of Mapping Technology in Public Health Peter Hayward, PhD Department of Geography SUNY College at Oneonta Invited research seminar presentation at Bassett Healthcare. Cooperstown,
Spatiotemporal Analysis of Urban Traffic Accidents: A Case Study of Tehran City, Iran
 Spatiotemporal Analysis of Urban Traffic Accidents: A Case Study of Tehran City, Iran January 2018 Niloofar HAJI MIRZA AGHASI Spatiotemporal Analysis of Urban Traffic Accidents: A Case Study of Tehran
Environmental Justice Analysis
 Environmental Justice Analysis October 2013 Transportation Department Environmental Justice Analysis Background The U.S. Environmental Protection Agency (EPA) defines environmental justice as the fair
MACRO-LEVEL MODELING OF URBAN TRANSPORTATION SAFETY: CASE-STUDY OF MASHHAD (IRAN)
") Transport and Telecommunication Vol. 18, no. 4, 217 Transport and Telecommunication, 217, volume 18, no. 4, 282 288 Transport and Telecommunication Institute, Lomonosova 1, Riga, LV-119, Latvia DOI 1.1515/ttj-217-25
Transport and Telecommunication Vol. 18, no. 4, 217 Transport and Telecommunication, 217, volume 18, no. 4, 282 288 Transport and Telecommunication Institute, Lomonosova 1, Riga, LV-119, Latvia DOI 1.1515/ttj-217-25
Economic and Social Urban Indicators: A Spatial Decision Support System for Chicago Area Transportation Planning
 Economic and Social Urban Indicators: A Spatial Decision Support System for Chicago Area Transportation Planning Piyushimita Thakuriah (Vonu), P.S. Sriraj, Paul Metaxatos, Inshu Minocha & Tanushri Swarup
Social Vulnerability Index. Susan L. Cutter Department of Geography, University of South Carolina
 Social Vulnerability Index Susan L. Cutter Department of Geography, University of South Carolina scutter@sc.edu Great Lakes and St. Lawrence Cities Initiative Webinar December 3, 2014 Vulnerability The
John Laznik 273 Delaplane Ave Newark, DE (302)
") Office Address: John Laznik 273 Delaplane Ave Newark, DE 19711 (302) 831-0479 Center for Applied Demography and Survey Research College of Human Services, Education and Public Policy University of Delaware
Office Address: John Laznik 273 Delaplane Ave Newark, DE 19711 (302) 831-0479 Center for Applied Demography and Survey Research College of Human Services, Education and Public Policy University of Delaware
Spatial analysis of pedestrian accidents
 University of South Florida Scholar Commons Graduate Theses and Dissertations Graduate School 2005 Spatial analysis of pedestrian accidents Tomoyuki Hashimoto University of South Florida Follow this and
A Joint Econometric Framework for Modeling Crash Counts by Severity
 A Joint Econometric Framework for Modeling Crash Counts by Severity Shamsunnahar Yasmin Postdoctoral Associate Department of Civil, Environmental & Construction Engineering University of Central Florida
An Internet-Based Integrated Resource Management System (IRMS)
") An Internet-Based Integrated Resource Management System (IRMS) Third Quarter Report, Year II 4/1/2000 6/30/2000 Prepared for Missouri Department of Natural Resources Missouri Department of Conservation
An Internet-Based Integrated Resource Management System (IRMS) Third Quarter Report, Year II 4/1/2000 6/30/2000 Prepared for Missouri Department of Natural Resources Missouri Department of Conservation
Spatiotemporal Analysis of Commuting Patterns: Using ArcGIS and Big Data
 Spatiotemporal Analysis of Commuting Patterns: Using ArcGIS and Big Data 2017 ESRI User Conference July 13, 2017 San Diego, VA Jung Seo, Tom Vo, Frank Wen and Simon Choi Research & Analysis Southern California
Using GIS to Identify Pedestrian- Vehicle Crash Hot Spots and Unsafe Bus Stops
 Using GIS to Identify Pedestrian-Vehicle Crash Hot Spots and Unsafe Bus Stops Using GIS to Identify Pedestrian- Vehicle Crash Hot Spots and Unsafe Bus Stops Long Tien Truong and Sekhar V. C. Somenahalli
Implication of GIS Technology in Accident Research in Bangladesh
 Journal of Bangladesh Institute of Planners ISSN 2075-9363 Vol. 8, 2015 (Printed in December 2016), pp. 159-166, Bangladesh Institute of Planners Implication of GIS Technology in Accident Research in Bangladesh
Extraction of Accidents Prediction Maps Modeling Hot Spots in Geospatial Information System
 Extraction of Accidents Prediction Maps Modeling Hot Spots in Geospatial Information System R.Shad a, *, A. Mesgar b, R. Moghimi b a Rouzbeh Shad, Assistant professor, Civil Department, Ferdowsi University
StanCOG Transportation Model Program. General Summary
 StanCOG Transportation Model Program Adopted By the StanCOG Policy Board March 17, 2010 What are Transportation Models? General Summary Transportation Models are technical planning and decision support
Comparison of spatial methods for measuring road accident hotspots : a case study of London
 Journal of Maps ISSN: (Print) 1744-5647 (Online) Journal homepage: http://www.tandfonline.com/loi/tjom20 Comparison of spatial methods for measuring road accident hotspots : a case study of London Tessa
Weather Information for Surface Transportation (WIST): Update on Weather Impacts and WIST Progress
: Update on Weather Impacts and WIST Progress") Weather Information for Surface Transportation (WIST): Update on Weather Impacts and WIST Progress Samuel P. Williamson Office of the Federal Coordinator for Meteorological Services and Supporting Research
Weather Information for Surface Transportation (WIST): Update on Weather Impacts and WIST Progress Samuel P. Williamson Office of the Federal Coordinator for Meteorological Services and Supporting Research
STATISTICAL ANALYSIS OF LAW ENFORCEMENT SURVEILLANCE IMPACT ON SAMPLE CONSTRUCTION ZONES IN MISSISSIPPI (Part 1: DESCRIPTIVE)
") STATISTICAL ANALYSIS OF LAW ENFORCEMENT SURVEILLANCE IMPACT ON SAMPLE CONSTRUCTION ZONES IN MISSISSIPPI (Part 1: DESCRIPTIVE) Tulio Sulbaran, Ph.D 1, David Marchman 2 Abstract It is estimated that every
STATISTICAL ANALYSIS OF LAW ENFORCEMENT SURVEILLANCE IMPACT ON SAMPLE CONSTRUCTION ZONES IN MISSISSIPPI (Part 1: DESCRIPTIVE) Tulio Sulbaran, Ph.D 1, David Marchman 2 Abstract It is estimated that every
DIFFERENT INFLUENCES OF SOCIOECONOMIC FACTORS ON THE HUNTING AND FISHING LICENSE SALES IN COOK COUNTY, IL
 DIFFERENT INFLUENCES OF SOCIOECONOMIC FACTORS ON THE HUNTING AND FISHING LICENSE SALES IN COOK COUNTY, IL Xiaohan Zhang and Craig Miller Illinois Natural History Survey University of Illinois at Urbana
Susan Clark NRS 509 Nov. 29, 2005
 Susan Clark NRS 509 Nov. 29, 2005 The original intent of this project was to look at the role of GIS in the inventory of bicycle and pedestrian facilities. The research, however, indicates a different
Maggie M. Kovach. Department of Geography University of North Carolina at Chapel Hill
 Maggie M. Kovach Department of Geography University of North Carolina at Chapel Hill Rationale What is heat-related illness? Why is it important? Who is at risk for heat-related illness and death? Urban
Assessment of Models to Estimate Bus-Stop Level Transit Ridership using Spatial Modeling Methods
 Assessment of Models to Estimate Bus-Stop Level Transit Ridership using Spatial Modeling Methods Assessment of Models to Estimate Bus-Stop Level Transit Ridership using Spatial Modeling Methods Srinivas
Technical Memorandum #2 Future Conditions
 Technical Memorandum #2 Future Conditions To: Dan Farnsworth Transportation Planner Fargo-Moorhead Metro Council of Governments From: Rick Gunderson, PE Josh Hinds PE, PTOE Houston Engineering, Inc. Subject:
Regional Performance Measures
 G Performance Measures Regional Performance Measures Introduction This appendix highlights the performance of the MTP/SCS for 2035. The performance of the Revenue Constrained network also is compared to
ARIC Manuscript Proposal # PC Reviewed: _9/_25_/06 Status: A Priority: _2 SC Reviewed: _9/_25_/06 Status: A Priority: _2
 ARIC Manuscript Proposal # 1186 PC Reviewed: _9/_25_/06 Status: A Priority: _2 SC Reviewed: _9/_25_/06 Status: A Priority: _2 1.a. Full Title: Comparing Methods of Incorporating Spatial Correlation in
Geospatial Analysis of Job-Housing Mismatch Using ArcGIS and Python
 Geospatial Analysis of Job-Housing Mismatch Using ArcGIS and Python 2016 ESRI User Conference June 29, 2016 San Diego, CA Jung Seo, Frank Wen, Simon Choi and Tom Vo, Research & Analysis Southern California
1Department of Demography and Organization Studies, University of Texas at San Antonio, One UTSA Circle, San Antonio, TX
 Well, it depends on where you're born: A practical application of geographically weighted regression to the study of infant mortality in the U.S. P. Johnelle Sparks and Corey S. Sparks 1 Introduction Infant
Regional Performance Measures
 G Performance Measures Regional Performance Measures Introduction This appendix highlights the performance of the MTP/SCS for 2035. The performance of the Revenue Constrained network also is compared to
Keywords: Air Quality, Environmental Justice, Vehicle Emissions, Public Health, Monitoring Network
 NOTICE: this is the author s version of a work that was accepted for publication in Transportation Research Part D: Transport and Environment. Changes resulting from the publishing process, such as peer
Integrating the macroscopic and microscopic traffic safety analysis using hierarchical models
 University of Central Florida Electronic Theses and Dissertations Doctoral Dissertation (Open Access) Integrating the macroscopic and microscopic traffic safety analysis using hierarchical models 2017
Using Tourism-Based Travel Demand Model to Estimate Traffic Volumes on Low-Volume Roads
 International Journal of Traffic and Transportation Engineering 2018, 7(4): 71-77 DOI: 10.5923/j.ijtte.20180704.01 Using Tourism-Based Travel Demand Model to Estimate Traffic Volumes on Low-Volume Roads
Environmental Justice Analysis FOR THE MINNESOTA STATEWIDE FREIGHT SYSTEM PLAN
 Environmental Justice Analysis FOR THE MINNESOTA STATEWIDE FREIGHT SYSTEM PLAN Presentation Overview Minnesota Freight Plan Summary Environmental Justice (EJ) Background Freight Plan EJ Analysis Methodology
Neighborhood social characteristics and chronic disease outcomes: does the geographic scale of neighborhood matter? Malia Jones
 Neighborhood social characteristics and chronic disease outcomes: does the geographic scale of neighborhood matter? Malia Jones Prepared for consideration for PAA 2013 Short Abstract Empirical research
APPENDIX C-3 Equitable Target Areas (ETA) Technical Analysis Methodology
 Technical Analysis Methodology") APPENDIX C-3 Equitable Target Areas (ETA) Technical Analysis Methodology Contents Introduction... 1 ETA Index Methodology... 1 ETA Index Development... 1 Other EJ Measures... 4 The Limited English Proficiency
APPENDIX C-3 Equitable Target Areas (ETA) Technical Analysis Methodology Contents Introduction... 1 ETA Index Methodology... 1 ETA Index Development... 1 Other EJ Measures... 4 The Limited English Proficiency
Spatial and Socioeconomic Analysis of Commuting Patterns in Southern California Using LODES, CTPP, and ACS PUMS
 Spatial and Socioeconomic Analysis of Commuting Patterns in Southern California Using LODES, CTPP, and ACS PUMS Census for Transportation Planning Subcommittee meeting TRB 95th Annual Meeting January 11,
Transportation and Road Weather
 Portland State University PDXScholar TREC Friday Seminar Series Transportation Research and Education Center (TREC) 4-18-2014 Transportation and Road Weather Rhonda Young University of Wyoming Let us know
Development of Criteria to Identify Pedestrian High Crash Locations in Nevada
 NDOT Research Report Report No: RDT04-048 Development of Criteria to Identify Pedestrian High Crash Locations in Nevada August 2004 Prepared by Research Division Nevada Department of Transportation 1263
2010 Census Data Release and Current Geographic Programs. Michaellyn Garcia Geographer Seattle Regional Census Center
 2010 Census Data Release and Current Geographic Programs Michaellyn Garcia Geographer Seattle Regional Census Center 2010 Center of Population Located approximately 2.7 miles northeast of Plato, Missouri
THE DEVELOPMENT OF ROAD ACCIDENT DATABASE MANAGEMENT SYSTEM FOR ROAD SAFETY ANALYSES AND IMPROVEMENT
 THE DEVELOPMENT OF ROAD ACCIDENT DATABASE MANAGEMENT SYSTEM FOR ROAD SAFETY ANALYSES AND IMPROVEMENT By T. H. Law Radin Umar R. S. (Road Safety Research Center, Faculty of Engineering, University Putra
HSIP FUNDING APPLICATION
 Page 1 Lucas County - Sylvania Ave at Centennial Rd DATE 5/1/2013 Project Information: COUNTY Lucas County LOCATION TYPE PROJECT SERVICE LIFE 20 years SEGMENT INFORMATION ROUTE BEGIN SLM END SLM PRESENT
FHWA GIS Outreach Activities. Loveland, Colorado April 17, 2012
 FHWA GIS Outreach Activities Loveland, Colorado April 17, 2012 GIS for Improved Decision Making FHWA believes that geographic information systems and other geospatial technologies (remote sensing and GPS)
Understanding Land Use and Walk Behavior in Utah
 Understanding Land Use and Walk Behavior in Utah 15 th TRB National Transportation Planning Applications Conference Callie New GIS Analyst + Planner STUDY AREA STUDY AREA 11 statistical areas (2010 census)
Presented at ESRI Education User Conference, July 6-8, 2001, San Diego, CA
 Presented at ESRI Education User Conference, July 6-8, 2001, San Diego, CA Irina V. Sharkova, Ph.D., Research Assistant Professor Richard Lycan, Ph.D., Senior Research Associate Population Research Center
Introduction to Ohio Landslide Hazard Rating System and Landslide Risk Management. By Prof. Robert Liang
 Introduction to Ohio Landslide Hazard Rating System and Landslide Risk Management By Prof. Robert Liang Background Landslides cause public risk (accident: injury/loss of life). Impact on regional economy
Analyzing Suitability of Land for Affordable Housing
 Analyzing Suitability of Land for Affordable Housing Vern C. Svatos Jarrod S. Doucette Abstract: This paper explains the use of a geographic information system (GIS) to distinguish areas that might have
A COMPARATIVE STUDY OF THE APPLICATION OF THE STANDARD KERNEL DENSITY ESTIMATION AND NETWORK KERNEL DENSITY ESTIMATION IN CRASH HOTSPOT IDENTIFICATION
 A COMPARATIVE STUDY OF THE APPLICATION OF THE STANDARD KERNEL DENSITY ESTIMATION AND NETWORK KERNEL DENSITY ESTIMATION IN CRASH HOTSPOT IDENTIFICATION Yue Tang Graduate Research Assistant Department of
DEVELOPMENT OF CRASH PREDICTION MODEL USING MULTIPLE REGRESSION ANALYSIS Harshit Gupta 1, Dr. Siddhartha Rokade 2 1
 DEVELOPMENT OF CRASH PREDICTION MODEL USING MULTIPLE REGRESSION ANALYSIS Harshit Gupta 1, Dr. Siddhartha Rokade 2 1 PG Student, 2 Assistant Professor, Department of Civil Engineering, Maulana Azad National
Second High Level Forum on GGIM Seminar on Regional Cooperation in Geospatial Information Management Doha, Qatar, 7 February 2013
 Second High Level Forum on GGIM Seminar on Regional Cooperation in Geospatial Information Management Doha, Qatar, 7 February 2013 Overview on Geospatial Activities in Egypt BY : Eng.Nahla Seddik Mohamed
Travel behavior of low-income residents: Studying two contrasting locations in the city of Chennai, India
 Travel behavior of low-income residents: Studying two contrasting locations in the city of Chennai, India Sumeeta Srinivasan Peter Rogers TRB Annual Meet, Washington D.C. January 2003 Environmental Systems,
Modeling Urban Sprawl: from Raw TIGER Data with GIS
 Modeling Urban Sprawl: from Raw TIGER Data with GIS Brady Foust University of Wisconsin-Eau Claire Lisa Theo University of Wisconsin-Stevens Point Modeling Urban Sprawl 1 Problem How to model & predict
Economic consequences of floods: impacts in urban areas
 Economic consequences of floods: impacts in urban areas SWITCH Paris Conference Paris, 24 th 26 th January 2011 Economic consequences of floods: impacts in urban areas Institutions: Authors Vanessa Cançado
Appendixx C Travel Demand Model Development and Forecasting Lubbock Outer Route Study June 2014
 Appendix C Travel Demand Model Development and Forecasting Lubbock Outer Route Study June 2014 CONTENTS List of Figures-... 3 List of Tables... 4 Introduction... 1 Application of the Lubbock Travel Demand
Spatiotemporal Analysis of Commuting Patterns in Southern California Using ACS PUMS, CTPP and LODES
 Spatiotemporal Analysis of Commuting Patterns in Southern California Using ACS PUMS, CTPP and LODES 2017 ACS Data Users Conference May 11-12, 2017 Alexandria, VA Jung Seo, Tom Vo, Frank Wen and Simon Choi
Can Public Transport Infrastructure Relieve Spatial Mismatch?
 Can Public Transport Infrastructure Relieve Spatial Mismatch? Evidence from Recent Light Rail Extensions Kilian Heilmann University of California San Diego April 20, 2015 Motivation Paradox: Even though
ANALYSIS OF INTRINSIC FACTORS CONTRIBUTING TO URBAN ROAD CRASHES
 S. Raicu, et al., Int. J. of Safety and Security Eng., Vol. 7, No. 1 (2017) 1 9 ANALYSIS OF INTRINSIC FACTORS CONTRIBUTING TO URBAN ROAD CRASHES S. RAICU, D. COSTESCU & S. BURCIU Politehnica University
HORIZON 2030: Land Use & Transportation November 2005
 PROJECTS Land Use An important component of the Horizon transportation planning process involved reviewing the area s comprehensive land use plans to ensure consistency between them and the longrange transportation
An online data and consulting resource of THE UNIVERSITY OF TOLEDO THE JACK FORD URBAN AFFAIRS CENTER
 An online data and consulting resource of THE JACK FORD URBAN AFFAIRS CENTER THE CENTER FOR GEOGRAPHIC INFORMATION SCIENCE AND APPLIED GEOGRAPHICS DEPARTMENT OF GEOGRAPHY AND PLANNING THE UNIVERSITY OF
The impact of residential density on vehicle usage and fuel consumption*
 The impact of residential density on vehicle usage and fuel consumption* Jinwon Kim and David Brownstone Dept. of Economics 3151 SSPA University of California Irvine, CA 92697-5100 Email: dbrownst@uci.edu
Population Research Center (PRC) Oregon Population Forecast Program
 Oregon Population Forecast Program") Population Research Center (PRC) Oregon Population Forecast Program 2013 Oregon League of Cities Conference Risa S. Proehl Jason R. Jurjevich, Ph.D. Population Research Center (PRC) Population Research
Population Research Center (PRC) Oregon Population Forecast Program 2013 Oregon League of Cities Conference Risa S. Proehl Jason R. Jurjevich, Ph.D. Population Research Center (PRC) Population Research
Community Health Needs Assessment through Spatial Regression Modeling
 Community Health Needs Assessment through Spatial Regression Modeling Glen D. Johnson, PhD CUNY School of Public Health glen.johnson@lehman.cuny.edu Objectives: Assess community needs with respect to particular
Using a K-Means Clustering Algorithm to Examine Patterns of Pedestrian Involved Crashes in Honolulu, Hawaii
 Journal of Advanced Transportation, Vol. 41, No. 1, pp. 69-89 www.advanced-transport.com Using a K-Means Clustering Algorithm to Examine Patterns of Pedestrian Involved Crashes in Honolulu, Hawaii Karl
GIS Analysis of Crenshaw/LAX Line
 PDD 631 Geographic Information Systems for Public Policy, Planning & Development GIS Analysis of Crenshaw/LAX Line Biying Zhao 6679361256 Professor Barry Waite and Bonnie Shrewsbury May 12 th, 2015 Introduction
Speakers: Jeff Price, Federal Transit Administration Linda Young, Center for Neighborhood Technology Sofia Becker, Center for Neighborhood Technology
 Speakers: Jeff Price, Federal Transit Administration Linda Young, Center for Neighborhood Technology Sofia Becker, Center for Neighborhood Technology Peter Haas, Center for Neighborhood Technology Craig
NEW YORK DEPARTMENT OF SANITATION. Spatial Analysis of Complaints
 NEW YORK DEPARTMENT OF SANITATION Spatial Analysis of Complaints Spatial Information Design Lab Columbia University Graduate School of Architecture, Planning and Preservation November 2007 Title New York
Assessing the Vulnerability of Tennessee Transportation Assets to Extreme Weather
 Assessing the Vulnerability of Tennessee Transportation Assets to Extreme Weather Dr. Mark Abkowitz, Vanderbilt University 8 th Annual Intermodal Conference Memphis TN October 7, 2014 Requires states to
CRP 608 Winter 10 Class presentation February 04, Senior Research Associate Kirwan Institute for the Study of Race and Ethnicity
 CRP 608 Winter 10 Class presentation February 04, 2010 SAMIR GAMBHIR SAMIR GAMBHIR Senior Research Associate Kirwan Institute for the Study of Race and Ethnicity Background Kirwan Institute Our work Using
Spatial Organization of Data and Data Extraction from Maptitude
 Spatial Organization of Data and Data Extraction from Maptitude N. P. Taliceo Geospatial Information Sciences The University of Texas at Dallas UT Dallas GIS Workshop Richardson, TX March 30 31, 2018 1/
Accident predictive system in Benue State using artificial neural network
 ISSN 1746-7659, England, UK Journal of Information and Computing Science Vol. 12, No. 1, 2017, pp. 033-040 Accident predictive system in Benue State using artificial neural network A. Amuche 1, B.M. Esiefarienrhe
Encapsulating Urban Traffic Rhythms into Road Networks
 Encapsulating Urban Traffic Rhythms into Road Networks Junjie Wang +, Dong Wei +, Kun He, Hang Gong, Pu Wang * School of Traffic and Transportation Engineering, Central South University, Changsha, Hunan,
Planning Level Regression Models for Crash Prediction on Interchange and Non-Interchange Segments of Urban Freeways
 Planning Level Regression Models for Crash Prediction on Interchange and Non-Interchange Segments of Urban Freeways Arun Chatterjee, Professor Department of Civil and Environmental Engineering The University
KENTUCKY HAZARD MITIGATION PLAN RISK ASSESSMENT
 KENTUCKY HAZARD MITIGATION PLAN RISK ASSESSMENT Presentation Outline Development of the 2013 State Hazard Mitigation Plan Risk Assessment Determining risk assessment scale Census Data Aggregation Levels
Jun Tu. Department of Geography and Anthropology Kennesaw State University
 Examining Spatially Varying Relationships between Preterm Births and Ambient Air Pollution in Georgia using Geographically Weighted Logistic Regression Jun Tu Department of Geography and Anthropology Kennesaw
Developing Spatial Data to Support Statistical Analysis of Education
 Developing Spatial Data to Support Statistical Analysis of Education Doug Geverdt National Center for Education Statistics Education Demographic and Geographic Estimates (EDGE) Program 2016 ESRI User Conference
Safety Performance Functions for Partial Cloverleaf On-Ramp Loops for Michigan
 1 1 1 1 1 1 1 1 0 1 0 1 0 Safety Performance Functions for Partial Cloverleaf On-Ramp Loops for Michigan Elisha Jackson Wankogere Department of Civil and Construction Engineering Western Michigan University
VALIDATING THE RELATIONSHIP BETWEEN URBAN FORM AND TRAVEL BEHAVIOR WITH VEHICLE MILES TRAVELLED. A Thesis RAJANESH KAKUMANI
 VALIDATING THE RELATIONSHIP BETWEEN URBAN FORM AND TRAVEL BEHAVIOR WITH VEHICLE MILES TRAVELLED A Thesis by RAJANESH KAKUMANI Submitted to the Office of Graduate Studies of Texas A&M University in partial
Do the Causes of Poverty Vary by Neighborhood Type?
 Do the Causes of Poverty Vary by Neighborhood Type? Suburbs and the 2010 Census Conference Uday Kandula 1 and Brian Mikelbank 2 1 Ph.D. Candidate, Maxine Levin College of Urban Affairs Cleveland State
CALOTS Upgrade for Performance Monitoring
 CALOTS Upgrade for Performance Monitoring A project of the Southern California Association of Governments supported by the UCLA Lewis Center for Regional Policy Studies Agenda 1. Revisit Project Overview
INDOT Office of Traffic Safety
 Intro to GIS Spatial Analysis INDOT Office of Traffic Safety Intro to GIS Spatial Analysis INDOT Office of Traffic Safety Kevin Knoke Section 130 Program Manager Highway Engineer II Registered Professional
Data Collection. Lecture Notes in Transportation Systems Engineering. Prof. Tom V. Mathew. 1 Overview 1
 Data Collection Lecture Notes in Transportation Systems Engineering Prof. Tom V. Mathew Contents 1 Overview 1 2 Survey design 2 2.1 Information needed................................. 2 2.2 Study area.....................................
Proposed Scope of Work Village of Farmingdale Downtown Farmingdale BOA Step 2 BOA Nomination Study / Draft Generic Environmental Impact Statement
 Proposed Scope of Work Village of Farmingdale Downtown Farmingdale BOA Step 2 BOA Nomination Study / Draft Generic Environmental Impact Statement The scope of work that follows incorporates and covers
Understanding China Census Data with GIS By Shuming Bao and Susan Haynie China Data Center, University of Michigan
 Understanding China Census Data with GIS By Shuming Bao and Susan Haynie China Data Center, University of Michigan The Census data for China provides comprehensive demographic and business information
Spatial Disparities in the Distribution of Parks and Green Spaces in the United States
 March 11 th, 2012 Active Living Research Conference Spatial Disparities in the Distribution of Parks and Green Spaces in the United States Ming Wen, Ph.D., University of Utah Xingyou Zhang, Ph.D., CDC
SUPPORTS SUSTAINABLE GROWTH
 DDSS BBUUN NDDLLEE G E O S P AT I A L G O V E R N A N C E P A C K A G E SUPPORTS SUSTAINABLE GROWTH www.digitalglobe.com BRISBANE, AUSTRALIA WORLDVIEW-3 30 CM International Civil Government Programs US