Economic consequences of floods: impacts in urban areas
|
|
|
- Oscar Willis
- 6 years ago
- Views:
Transcription
1 Economic consequences of floods: impacts in urban areas SWITCH Paris Conference Paris, 24 th 26 th January 2011

2 Economic consequences of floods: impacts in urban areas Institutions: Authors Vanessa Cançado Nilo Nascimento Ricardo Ruiz Aknowledgements Leise Kelli de Oliveira Farney Alcântara Brenner Maia-Rodrigues Matheus Jung
3 METHODOLOGY The model focuses on the households and their economic relations within the city (consumption, work) Floods will affect these relations


4 METHODOLOGY Urban system A. River system B. Household system C. Production-distribution system D. Transport system
5 METHODOLOGY The city is represented by 4 integrated systems: 1. river system: flood modelling (return period, depth, velocity and duration) 2. household system: agent based model and network analysis (socio-economic characteristics of residents, their consumption practices and household assets) 3. production-distribution system: agent based model and network analysis (characteristics of firms and the labor demand) 4. transport system: simulation model (time and distance of displacement)
6 METHODOLOGY Everyday situation flood Direct damage models (susceptibility and vulnerability factors) Breakpoints (roads, people, homes affected, service, commerce, industry, etc) Socioeconomic data Economic model (behavioral changes) Traffic allocation model (change of travel routes) Model of economic impact of flooding Socioeconomic impacts
7 METHODOLOGY A prototype was created to simulate the economic relations between families and firms It is a hybrid model: virtual city + real socio-economic information's census (Belo Horizonte) Aggregating the information of all agents of each system, the model should be able to show the behavior of the municipal income, the stock of household assets and the value added to the economy
8 THE PROTOTYPE (model: Netlogo) Others (divided into 74 regions) Surrounding Impacted area

9 THE PROTOTYPE (model: Netlogo)
10 THE PROTOTYPE Region of direct impact and surroundings: 14,315 households ( workers) 5,050 firms average income: 1,546 Euro/month Others regions of the city: 74 regions: clusters of firms and 164,379 households 19,084 firms. average income: 1,544 Euro/month Equilibrium of the model : Labors supply = Labor demand Others (divided into 74 regions) Surrounding Impacted area Salaries = income = expenditure
11 METHODOLOGY: spatial distribution of households and fims Households distributed according to Belo Horizonte census Firms distributed according to different data bases and 11 criteria: Commerce, services and industries: Municipal data base (GIS) Hospitals and schools (up to high school): GIS Universities, museums, libraries: phone directory
12 METHODOLOGY Socioeconomic data: household matrix 12 types of families 82 variables: Dwelling characteristics (e.g.: location, dwelling area, build characteristics) Family income Types of expenditures (59 types) Dwelling content (TV, cars, furniture, etc) Census data (IBGE, 2000, 2003)
13 METHODOLOGY Socioeconomic data: family members matrix 58 variables Physical characteristics (e.g.: age, gender, health conditions, mobility) Functions in the household (e.g.: occupation code, work hours, etc) Education Income Census data
14 METHODOLOGY Socioeconomic data: firm matrix 88 types of activities: Types of offer: 3 types of spatial distribution (e.g.: bakery, hospital) 3 types of good characteristics: essential, necessary, luxurious Frequency of consumption: daily, weekly, monthly, rare Number of employees Census data, business data
15 METHODOLOGY Relationship between agents (matrixes) Work and study allocations: Random selection of the firm by workers working in the firm field limit: number of employees per firm Closest fundamental school, plus random selection of school for higher level other criteria: domain of studies, school capacity Household Firm Consumption Work 1 Household Work 2 Education etc
16 METHODOLOGY Relationship between agents (matrixes) Expenditure allocation decision: The agent choose the firm according to those that are able to furnish the good X (1-59 options) Distance accepted by the agent to travel in order to buy the good X (depends on good characteristics and on spatial distribution of firms) Household Firm Consumption Work 1 Household Work 2 Education etc
17 METHODOLOGY The river system Rainfall-runoff simulation: HEC-HMS Hydraulic simulation: HEC-RAS unsteady flow, 1-D Risk scenarios: T=5 y, 25 y, 100 y Floodplain mapping: ArcGis 9.2 Rainfall duration: 2 hours (flash flood characteristics) Hydrograph base time: at about 8 hours
18 METHODOLOGY Traffic simulation Modelling only the impacted and surrounding area Model Integration 5.1 Road capacity: 700 vehicles/hour.line -HCM Highway Capacity Manual (TRB, 2000). Velocity limits: 60km/h (main roads); 40km/h (local roads) Road length: 49,71 km (55 links) Flood occurring in two different moments: 10h and 17h
19 % de veículos METHODOLOGY Traffic simulation Vehicles flow according to Belo Horizonte Municipal data (traffic authority) in areas similar to those in the model Vehicles flow time distribution according to Belo Horizonte Municipal data 8% 7% 6% 5% 4% 3% 2% 1% 0% 0:00 2:24 4:48 7:12 9:36 12:00 14:24 16:48 19:12 21:36 0:00 Hora do dia
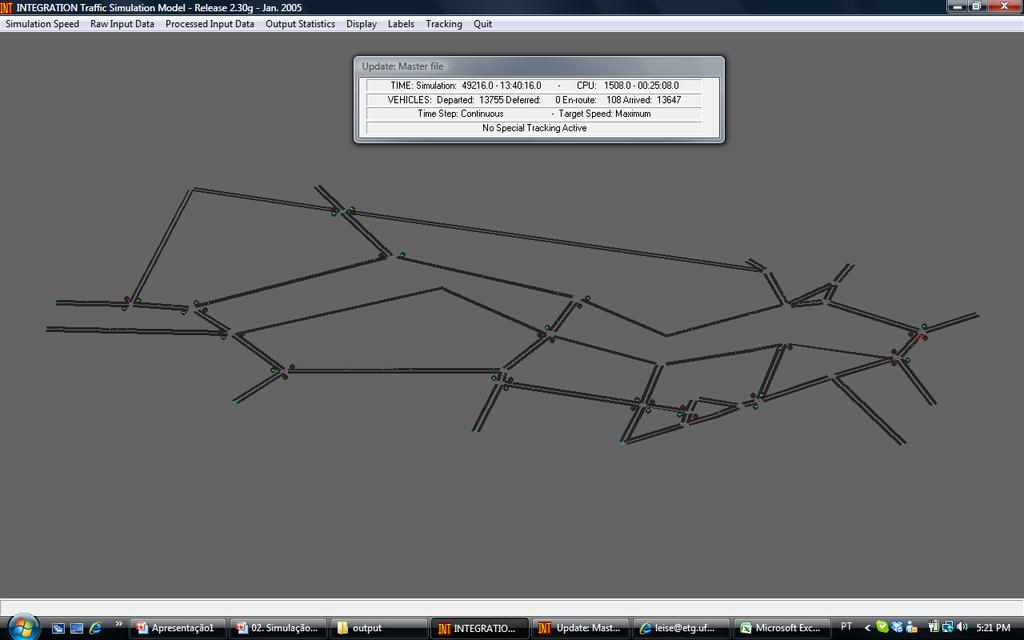
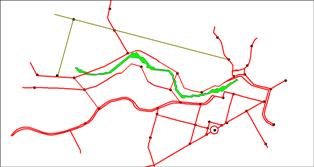
20 METHODOLOGY Traffic simulation
21 EXPECTED RESULTS Expecting to observe changes over time on: household income consumption and displacement patterns before, during and after flooding Assessment of flood economic impacts and the time for recovering

22 RESULTS Flood modelling
23 RESULTS Direct impacts T = 5 y T = 25 y T = 100 y Flooded households 980 1,252 1,919 Flood inhabitants 3,332 4,256 6,525 Flooded firms ,288 Road system (flooded links)
24 RESULTS Direct impacts Risk scenario Household mean income Direct damage (average) Recovery time - years (median) T = 5 y 628 5, T = 25 y 641 6, T = 100 y 641 5,


25 RESULTS Household recovering time T = 5 years T = 100 years
26 RESULTS Spatial distribution of impacts: variation on sales
27 RESULTS Firm indirect losses
28 RESULTS Traffic impact
29 RESULTS Traffic impact (T = 100 years, flood at 5 pm) Variable Current scenario Flooding scenario Traffic jam dissipation time - 3h 40 min Average velocity km/h 9.07 km/h Fuel consumption 0.32 l/km l/km CO 2 emissions g/min g/min HC emissions g/min g/min NO x emissions g/min g/min Average additional time min
30 RESULTS Traffic impact: costs (Euro) for T = 100 y Time Fuel Pollutants Current scenario T = 100 y 100,573 25, (0%) 357,558 (256%) 52,516 (106%) 125 (46%)
31 Researches on floods at UFMG: Conclusions Conclusions: Improving knowledge of flood impacts on households and on the economic system: Direct damages to households Disturbance on expenditures and income fluxes Disturbances to traffic Losses on value added by firms Time and space simulation of flood impacts Perspectives of application for other environmental studies

32 Perspectives Perspectives: Providing elements for improving decision making on flood management Developing indicators of flood vulnerability Contributing to promote public participation on flood management
Encapsulating Urban Traffic Rhythms into Road Networks
 Encapsulating Urban Traffic Rhythms into Road Networks Junjie Wang +, Dong Wei +, Kun He, Hang Gong, Pu Wang * School of Traffic and Transportation Engineering, Central South University, Changsha, Hunan,
Simulating Mobility in Cities: A System Dynamics Approach to Explore Feedback Structures in Transportation Modelling
 Simulating Mobility in Cities: A System Dynamics Approach to Explore Feedback Structures in Transportation Modelling Dipl.-Ing. Alexander Moser [amoser@student.tugraz.at] IVT Tagung 2013 - Kloster Kappel
Traffic Demand Forecast
 Chapter 5 Traffic Demand Forecast One of the important objectives of traffic demand forecast in a transportation master plan study is to examine the concepts and policies in proposed plans by numerically
BUILDING SOUND AND COMPARABLE METRICS FOR SDGS: THE CONTRIBUTION OF THE OECD DATA AND TOOLS FOR CITIES AND REGIONS
 BUILDING SOUND AND COMPARABLE METRICS FOR SDGS: THE CONTRIBUTION OF THE OECD DATA AND TOOLS FOR CITIES AND REGIONS STATISTICAL CAPACITY BUILDING FOR MONITORING OF SUSTAINABLE DEVELOPMENT GOALS Lukas Kleine-Rueschkamp
HORIZON 2030: Land Use & Transportation November 2005
 PROJECTS Land Use An important component of the Horizon transportation planning process involved reviewing the area s comprehensive land use plans to ensure consistency between them and the longrange transportation
Geospatial Technologies for Resources Planning & Management
 Geospatial Technologies for Resources Planning & Management Lal Samarakoon, PhD Director, Geoinformatics Center Asian Institute of Technology, Thailand Content Geoinformatics for SDG Information Integration
Assessing Social Vulnerability to Biophysical Hazards. Dr. Jasmine Waddell
 Assessing Social Vulnerability to Biophysical Hazards Dr. Jasmine Waddell About the Project Built on a need to understand: The pre-disposition of the populations in the SE to adverse impacts from disaster
Opportunities and challenges of HCMC in the process of development
 Opportunities and challenges of HCMC in the process of development Lê Văn Thành HIDS HCMC, Sept. 16-17, 2009 Contents The city starting point Achievement and difficulties Development perspective and goals
Hennepin GIS. Tree Planting Priority Areas - Analysis Methodology. GIS Services April 2018 GOAL:
 Hennepin GIS GIS Services April 2018 Tree Planting Priority Areas - Analysis Methodology GOAL: To create a GIS data layer that will aid Hennepin County Environment & Energy staff in determining where to
Urban Economics City Size
 Urban Economics City Size Utility and City Size Question: Why do cities differ in size and scope? While NYC has a population of more 18 million, the smallest urban area in the U.S. has only 13,000. A well
SPACE-TIME ACCESSIBILITY MEASURES FOR EVALUATING MOBILITY-RELATED SOCIAL EXCLUSION OF THE ELDERLY
 SPACE-TIME ACCESSIBILITY MEASURES FOR EVALUATING MOBILITY-RELATED SOCIAL EXCLUSION OF THE ELDERLY Izumiyama, Hiroshi Institute of Environmental Studies, The University of Tokyo, Tokyo, Japan Email: izumiyama@ut.t.u-tokyo.ac.jp
Leveraging Urban Mobility Strategies to Improve Accessibility and Productivity of Cities
 Leveraging Urban Mobility Strategies to Improve Accessibility and Productivity of Cities Aiga Stokenberga World Bank GPSC African Regional Workshop May 15, 2018 Roadmap 1. Africa s urbanization and its
MOR CO Analysis of future residential and mobility costs for private households in Munich Region
 MOR CO Analysis of future residential and mobility costs for private households in Munich Region The amount of the household budget spent on mobility is rising dramatically. While residential costs can
CERTIFIED RESOLUTION. introduction: and dated May 29, 2017, as attached, as appropriate
 15322 Buena Vista Avenue, White Rock BC, Canada V4B 1Y6 www.whiterockcity.ca City of White Rock P: 604.541.22121 F: 604.541.9348 /2tC% City Clerk s Office IT E ROC K June 13,2017 Stephanie Lam, Deputy
Employment Decentralization and Commuting in U.S. Metropolitan Areas. Symposium on the Work of Leon Moses
 Employment Decentralization and Commuting in U.S. Metropolitan Areas Alex Anas Professor of Economics University at Buffalo Symposium on the Work of Leon Moses February 7, 2014 9:30-11:15am, and 2:30-4:30pm
Dimantha I De Silva (corresponding), HBA Specto Incorporated
, HBA Specto Incorporated") Paper Author (s) Dimantha I De Silva (corresponding), HBA Specto Incorporated (dds@hbaspecto.com) Daniel Flyte, San Diego Association of Governments (SANDAG) (Daniel.Flyte@sandag.org) Matthew Keating,
Paper Author (s) Dimantha I De Silva (corresponding), HBA Specto Incorporated (dds@hbaspecto.com) Daniel Flyte, San Diego Association of Governments (SANDAG) (Daniel.Flyte@sandag.org) Matthew Keating,
THE FUTURE OF FORECASTING AT METROPOLITAN COUNCIL. CTS Research Conference May 23, 2012
 THE FUTURE OF FORECASTING AT METROPOLITAN COUNCIL CTS Research Conference May 23, 2012 Metropolitan Council forecasts Regional planning agency and MPO for Twin Cities metropolitan area Operates regional
DEVELOPING DECISION SUPPORT TOOLS FOR THE IMPLEMENTATION OF BICYCLE AND PEDESTRIAN SAFETY STRATEGIES
 DEVELOPING DECISION SUPPORT TOOLS FOR THE IMPLEMENTATION OF BICYCLE AND PEDESTRIAN SAFETY STRATEGIES Deo Chimba, PhD., P.E., PTOE Associate Professor Civil Engineering Department Tennessee State University
Trip Distribution Model for Flood Disaster Evacuation Operation
 Trip Distribution Model for Flood Disaster Evacuation Operation The devastating consequences of disasters in both developed and developing countries indicate significant lack or absence of disaster management
Analysis of travel-to-work patterns and the identification and classification of REDZs
 Analysis of travel-to-work patterns and the identification and classification of REDZs Dr David Meredith, Teagasc, Spatial Analysis Unit, Rural Economy Development Programme, Ashtown, Dublin 15. david.meredith@teagasc.ie
Demographic Data in ArcGIS. Harry J. Moore IV
 Demographic Data in ArcGIS Harry J. Moore IV Outline What is demographic data? Esri Demographic data - Real world examples with GIS - Redistricting - Emergency Preparedness - Economic Development Next
Estimating Transportation Demand, Part 2
 Transportation Decision-making Principles of Project Evaluation and Programming Estimating Transportation Demand, Part 2 K. C. Sinha and S. Labi Purdue University School of Civil Engineering 1 Estimating
Land Accounts - The Canadian Experience
 Land Accounts - The Canadian Experience Development of a Geospatial database to measure the effect of human activity on the environment Who is doing Land Accounts Statistics Canada (national) Component
INTRODUCTION TO TRANSPORTATION SYSTEMS
 INTRODUCTION TO TRANSPORTATION SYSTEMS Lectures 5/6: Modeling/Equilibrium/Demand 1 OUTLINE 1. Conceptual view of TSA 2. Models: different roles and different types 3. Equilibrium 4. Demand Modeling References:
Trip Generation Model Development for Albany
 Trip Generation Model Development for Albany Hui (Clare) Yu Department for Planning and Infrastructure Email: hui.yu@dpi.wa.gov.au and Peter Lawrence Department for Planning and Infrastructure Email: lawrence.peter@dpi.wa.gov.au
Lecture 19: Common property resources
 Lecture 19: Common property resources Economics 336 Economics 336 (Toronto) Lecture 19: Common property resources 1 / 19 Introduction Common property resource: A resource for which no agent has full property
Leaving the Ivory Tower of a System Theory: From Geosimulation of Parking Search to Urban Parking Policy-Making
 Leaving the Ivory Tower of a System Theory: From Geosimulation of Parking Search to Urban Parking Policy-Making Itzhak Benenson 1, Nadav Levy 1, Karel Martens 2 1 Department of Geography and Human Environment,
BROOKINGS May
 Appendix 1. Technical Methodology This study combines detailed data on transit systems, demographics, and employment to determine the accessibility of jobs via transit within and across the country s 100
Spatial multicriteria analysis for home buyers
 Spatial multicriteria analysis for home buyers Xavier Albacete University of Eastern Finland, Department of Environmental Science, Research Group of Environmental Informatics, Yliopistoranta 1 E, P.O.
Demand modelling by combining disaggregate and aggregate data: an application to a displacement scenario for the Mount Vesuvius area
 Sustainable Development and Planning II, Vol. 2 871 Demand modelling by combining disaggregate and aggregate data: an application to a displacement scenario for the Mount Vesuvius area S. de Luca Department
Changes in the Spatial Distribution of Mobile Source Emissions due to the Interactions between Land-use and Regional Transportation Systems
 Changes in the Spatial Distribution of Mobile Source Emissions due to the Interactions between Land-use and Regional Transportation Systems A Framework for Analysis Urban Transportation Center University
Megacity Research Project TP. Ho Chi Minh Adaptation to Global Climate Change in Vietnam: Integrative Urban and Environmental Planning Framework
 1. Organization 2. Global Warming 3. Starting Phase 4. Results, Transdisciplinarity, Low-Rise High Density 5. Risk of Flooding 6. Partners 7. Action Field 1 8. Action Field 2 9. Urban Development Trends
MPOs SB 375 LAFCOs SCAG Practices/Experiences And Future Collaborations with LAFCOs
 Connecting LAFCOs and COGs for Mutual Benefits MPOs SB 375 LAFCOs SCAG Practices/Experiences And Future Collaborations with LAFCOs Frank Wen, Manager Research & Analysis Land Use & Environmental Planning
StanCOG Transportation Model Program. General Summary
 StanCOG Transportation Model Program Adopted By the StanCOG Policy Board March 17, 2010 What are Transportation Models? General Summary Transportation Models are technical planning and decision support
São Paulo Metropolis and Macrometropolis - territories and dynamics of a recent urban transition
 São Paulo Metropolis and Macrometropolis - territories and dynamics of a recent urban transition Faculty of Architecture and Urbanism of São Paulo University Prof. Dr. Regina M. Prosperi Meyer WC2 - World
Disaster Risk Assessment: Opportunities for GIS and data management with Open DRI
 Disaster Risk Assessment: Opportunities for GIS and data management with Open DRI Jacob Opadeyi Department of Geomatics Engineering and Land Management, The University of the West Indies, St. Augustine,
I. M. Schoeman North West University, South Africa. Abstract
 Urban Transport XX 607 Land use and transportation integration within the greater area of the North West University (Potchefstroom Campus), South Africa: problems, prospects and solutions I. M. Schoeman
Spotlight on Population Resources for Geography Teachers. Pat Beeson, Education Services, Australian Bureau of Statistics
 Spotlight on Population Resources for Geography Teachers Pat Beeson, Education Services, Australian Bureau of Statistics Population Population size Distribution Age Structure Ethnic composition Gender
Decentralisation and its efficiency implications in suburban public transport
 Decentralisation and its efficiency implications in suburban public transport Daniel Hörcher 1, Woubit Seifu 2, Bruno De Borger 2, and Daniel J. Graham 1 1 Imperial College London. South Kensington Campus,
The Use of Geographic Information Systems (GIS) by Local Governments. Giving municipal decision-makers the power to make better decisions
 by Local Governments. Giving municipal decision-makers the power to make better decisions") The Use of Geographic Information Systems (GIS) by Local Governments Giving municipal decision-makers the power to make better decisions Case Study: Examples of GIS Usage by Local Governments in North
The Use of Geographic Information Systems (GIS) by Local Governments Giving municipal decision-makers the power to make better decisions Case Study: Examples of GIS Usage by Local Governments in North
Measuring Disaster Risk for Urban areas in Asia-Pacific
 Measuring Disaster Risk for Urban areas in Asia-Pacific Acknowledgement: Trevor Clifford, Intl Consultant 1 SDG 11 Make cities and human settlements inclusive, safe, resilient and sustainable 11.1: By
A Simplified Travel Demand Modeling Framework: in the Context of a Developing Country City
 A Simplified Travel Demand Modeling Framework: in the Context of a Developing Country City Samiul Hasan Ph.D. student, Department of Civil and Environmental Engineering, Massachusetts Institute of Technology,
KENTUCKY HAZARD MITIGATION PLAN RISK ASSESSMENT
 KENTUCKY HAZARD MITIGATION PLAN RISK ASSESSMENT Presentation Outline Development of the 2013 State Hazard Mitigation Plan Risk Assessment Determining risk assessment scale Census Data Aggregation Levels
A Framework for Dynamic O-D Matrices for Multimodal transportation: an Agent-Based Model approach
 A Framework for Dynamic O-D Matrices for Multimodal transportation: an Agent-Based Model approach Nuno Monteiro - FEP, Portugal - 120414020@fep.up.pt Rosaldo Rossetti - FEUP, Portugal - rossetti@fe.up.pt
COMBINATION OF MACROSCOPIC AND MICROSCOPIC TRANSPORT SIMULATION MODELS: USE CASE IN CYPRUS
 International Journal for Traffic and Transport Engineering, 2014, 4(2): 220-233 DOI: http://dx.doi.org/10.7708/ijtte.2014.4(2).08 UDC: 656:519.87(564.3) COMBINATION OF MACROSCOPIC AND MICROSCOPIC TRANSPORT
Regional Snapshot Series: Transportation and Transit. Commuting and Places of Work in the Fraser Valley Regional District
 Regional Snapshot Series: Transportation and Transit Commuting and Places of Work in the Fraser Valley Regional District TABLE OF CONTENTS Complete Communities Daily Trips Live/Work Ratio Commuting Local
November 29, World Urban Forum 6. Prosperity of Cities: Balancing Ecology, Economy and Equity. Concept Note
 November 29, 2010 World Urban Forum 6 Prosperity of Cities: Balancing Ecology, Economy and Equity Concept Note 1 CONTENT Thematic Continuity Conceptualizing the Theme The 6 Domains of Prosperity The WUF
Census Transportation Planning Products (CTPP)
") Census Transportation Planning Products (CTPP) Penelope Weinberger CTPP Program Manager - AASHTO September 15, 2010 1 What is the CTPP Program Today? The CTPP is an umbrella program of data products, custom
Census Transportation Planning Products (CTPP) Penelope Weinberger CTPP Program Manager - AASHTO September 15, 2010 1 What is the CTPP Program Today? The CTPP is an umbrella program of data products, custom
How GIS based Visualizations Support Land Use and Transportation Modeling
 How GIS based Visualizations Support Land Use and Transportation Modeling ESRI International Users Conference San Diego, CA - July 23, 2015 Prepared by: Troy Hightower Introduction This presentation will
ANALYSIS OF TRANSPORTATION ACCESSIBILITY TO HOSPITALS IN JACKSONVILLE, FLORIDA APPLIED RESEARCH PAPER
 ANALYSIS OF TRANSPORTATION ACCESSIBILITY TO HOSPITALS IN JACKSONVILLE, FLORIDA APPLIED RESEARCH PAPER IN FULFILLMENT OF THE MASTER OF CITY AND REGIONAL PLANNING SCHOOL OF CITY AND REGIONAL PLANNING COLLEGE
Development of modal split modeling for Chennai
 IJMTES International Journal of Modern Trends in Engineering and Science ISSN: 8- Development of modal split modeling for Chennai Mr.S.Loganayagan Dr.G.Umadevi (Department of Civil Engineering, Bannari
A More Comprehensive Vulnerability Assessment: Flood Damage in Virginia Beach
 A More Comprehensive Vulnerability Assessment: Flood Damage in Virginia Beach By Raj Shah GIS in Water Resources Fall 2017 Introduction One of the most obvious effects of flooding events is death. Humans
Application of GIS in Public Transportation Case-study: Almada, Portugal
 Case-study: Almada, Portugal Doutor Jorge Ferreira 1 FSCH/UNL Av Berna 26 C 1069-061 Lisboa, Portugal +351 21 7908300 jr.ferreira@fcsh.unl.pt 2 FSCH/UNL Dra. FCSH/UNL +351 914693843, leite.ines@gmail.com
Flood Scenario Worksheet
 Flood Scenario Worksheet Scenario adapted from: http://www.epa.gov/watersecurity/tools/trainingcd/simple/source/scenario-8/ssc8-0.pdf Simple Tabletop Exercise, Interdependency Natural Disaster Scenario,
Analysis and Design of Urban Transportation Network for Pyi Gyi Ta Gon Township PHOO PWINT ZAN 1, DR. NILAR AYE 2
 www.semargroup.org, www.ijsetr.com ISSN 2319-8885 Vol.03,Issue.10 May-2014, Pages:2058-2063 Analysis and Design of Urban Transportation Network for Pyi Gyi Ta Gon Township PHOO PWINT ZAN 1, DR. NILAR AYE
Technical Memorandum #2 Future Conditions
 Technical Memorandum #2 Future Conditions To: Dan Farnsworth Transportation Planner Fargo-Moorhead Metro Council of Governments From: Rick Gunderson, PE Josh Hinds PE, PTOE Houston Engineering, Inc. Subject:
transportation research in policy making for addressing mobility problems, infrastructure and functionality issues in urban areas. This study explored
 ABSTRACT: Demand supply system are the three core clusters of transportation research in policy making for addressing mobility problems, infrastructure and functionality issues in urban areas. This study
Floodplain Modeling and Mapping Using The Geographical Information Systems (GIS) and Hec-RAS/Hec-GeoRAS Applications. Case of Edirne, Turkey.
 and Hec-RAS/Hec-GeoRAS Applications. Case of Edirne, Turkey.") Floodplain Modeling and Mapping Using The Geographical Information Systems (GIS) and Hec-RAS/Hec-GeoRAS Applications. Case of Edirne, Turkey. Fuad Hajibayov *1, Basak Demires Ozkul 1, Fatih Terzi 1 1 Istanbul
Floodplain Modeling and Mapping Using The Geographical Information Systems (GIS) and Hec-RAS/Hec-GeoRAS Applications. Case of Edirne, Turkey. Fuad Hajibayov *1, Basak Demires Ozkul 1, Fatih Terzi 1 1 Istanbul
The Attractive Side of Corpus Christi: A Study of the City s Downtown Economic Growth
 The Attractive Side of Corpus Christi: A Study of the City s Downtown Economic Growth GISC PROJECT DR. LUCY HUANG SPRING 2012 DIONNE BRYANT Introduction Background As a GIS Intern working with the City
Indicator : Proportion of population that has convenient access to public transport, by sex, age and persons with disabilities
 Goal 11: Make cities and human settlements inclusive, safe, resilient and sustainable Target 11.2: By 2030, provide access to safe, affordable, accessible and sustainable transport systems for all, improving
Difference in regional productivity and unbalance in regional growth
 Difference in regional productivity and unbalance in regional growth Nino Javakhishvili-Larsen and Jie Zhang - CRT, Denmark, Presentation at 26 th International input-output conference in Brazil Aim of
Spatiotemporal Analysis of Urban Traffic Accidents: A Case Study of Tehran City, Iran
 Spatiotemporal Analysis of Urban Traffic Accidents: A Case Study of Tehran City, Iran January 2018 Niloofar HAJI MIRZA AGHASI Spatiotemporal Analysis of Urban Traffic Accidents: A Case Study of Tehran
Responding to Natural Hazards: The Effects of Disaster on Residential Location Decisions and Health Outcomes
 Responding to Natural Hazards: The Effects of Disaster on Residential Location Decisions and Health Outcomes James Price Department of Economics University of New Mexico April 6 th, 2012 1 Introduction
The Tyndall Cities Integrated Assessment Framework
 The Tyndall Cities Integrated Assessment Framework Alistair Ford 1, Stuart Barr 1, Richard Dawson 1, Jim Hall 2, Michael Batty 3 1 School of Civil Engineering & Geosciences and Centre for Earth Systems
11/11/2016. Energy Impacts Research Coordination Network >>>
 Energy Impacts Research Coordination Network >>> www.energyimpacts.org Synergies and Innovations in Coordinating Energy Impacts Research: The Case of Shale Development Impacts November 10, 2016, 1:30 2:30
Spatial and Socioeconomic Analysis of Commuting Patterns in Southern California Using LODES, CTPP, and ACS PUMS
 Spatial and Socioeconomic Analysis of Commuting Patterns in Southern California Using LODES, CTPP, and ACS PUMS Census for Transportation Planning Subcommittee meeting TRB 95th Annual Meeting January 11,
Integrated location-allocation of private car and public transport users Primary health care facility allocation in the Oulu Region of Finland
 Integrated location-allocation of private car and public transport users Primary health care facility allocation in the Oulu Region of Finland Ossi Kotavaara University of Oulu, Geography Research Unit,
Metrolinx Transit Accessibility/Connectivity Toolkit
 Metrolinx Transit Accessibility/Connectivity Toolkit Christopher Livett, MSc Transportation Planning Analyst Research and Planning Analytics Tweet about this presentation #TransitGIS OUTLINE 1. Who is
How to measure Territorial Cohesion and Cooperation?
 How to measure territorial cohesion and cooperation? How to measure Territorial Cohesion and Cooperation? Brussels: 21 February Growth, Development or Cohesion? Economic Competitiveness Social Cohesion
Mapping vulnerability to fuel price increases in England
 Institute for Transport Studies FACULTY OF ENVIRONMENT Mapping vulnerability to fuel price increases in England Giulio Mattioli & Ian Philips * Institute for Transport Studies, University of Leeds G.Mattioli@leeds.ac.uk
CIV3703 Transport Engineering. Module 2 Transport Modelling
 CIV3703 Transport Engineering Module Transport Modelling Objectives Upon successful completion of this module you should be able to: carry out trip generation calculations using linear regression and category
International Conference Analysis and Management of Changing Risks for Natural Hazards November 2014 l Padua, Italy
 Abstract Code: B01 Assets mapping products in support of preparedness and prevention measures (examples from Germany, Italy and France) Marc Mueller, Thierry Fourty, Mehdi Lefeuvre Airbus Defence and Space,
Typical information required from the data collection can be grouped into four categories, enumerated as below.
 Chapter 6 Data Collection 6.1 Overview The four-stage modeling, an important tool for forecasting future demand and performance of a transportation system, was developed for evaluating large-scale infrastructure
VALIDATING THE RELATIONSHIP BETWEEN URBAN FORM AND TRAVEL BEHAVIOR WITH VEHICLE MILES TRAVELLED. A Thesis RAJANESH KAKUMANI
 VALIDATING THE RELATIONSHIP BETWEEN URBAN FORM AND TRAVEL BEHAVIOR WITH VEHICLE MILES TRAVELLED A Thesis by RAJANESH KAKUMANI Submitted to the Office of Graduate Studies of Texas A&M University in partial
Like other coastal cities, Honolulu s
 Worst-Case Scenarios: Flooding and Evacuation Plans in Honolulu Karl Kim, Pradip Pant, Eric Yamashita Like other coastal cities, Honolulu s long-term viability depends on how well it can adapt to climate
City of Jerez Urban Core Densification proposal; An Agent Based Spatio-temporal model
 Modelling urban population allocation City of Jerez Urban Core Densification proposal; An Agent Based Spatio-temporal model Elke Sauter Julia Úbeda Who we are & why we are here Masters programme: Geographical
ACCESSIBILITY TO SERVICES IN REGIONS AND CITIES: MEASURES AND POLICIES NOTE FOR THE WPTI WORKSHOP, 18 JUNE 2013
 ACCESSIBILITY TO SERVICES IN REGIONS AND CITIES: MEASURES AND POLICIES NOTE FOR THE WPTI WORKSHOP, 18 JUNE 2013 1. Significant differences in the access to basic and advanced services, such as transport,
Use of Geospatial data for disaster managements
 Use of Geospatial data for disaster managements Source: http://alertsystemsgroup.com Instructor : Professor Dr. Yuji Murayama Teaching Assistant : Manjula Ranagalage What is GIS? A powerful set of tools
By Abdulraheem M.Baabbad. Supervisor: Dr.Bager Al-Ramadan
 By Abdulraheem M.Baabbad Supervisor: Dr.Bager Al-Ramadan OUTLINE Health GIS Health GIS Application Emergency Vehicles Allocation: A case study Health GIS Innovative structureto access,integrate,visualize
Accessibility analysis of multimodal transport systems using advanced GIS techniques
 Urban Transport XIII: Urban Transport and the Environment in the 21st Century 655 Accessibility analysis of multimodal transport systems using advanced GIS techniques T. Vorraa Citilabs Regional Director,
The Church Demographic Specialists
 The Church Demographic Specialists Easy-to-Use Features Map-driven, Web-based Software An Integrated Suite of Information and Query Tools Providing An Insightful Window into the Communities You Serve Key
Towards an International Data Set for MST
 Towards an International Data Set for MST Carl Obst, UNWTO Consultant 15 October, 2018 Background and context The key role of the Measuring the Sustainability of Tourism (MST) project is to support more
Volume Title: Empirical Models of Urban Land Use: Suggestions on Research Objectives and Organization. Volume URL:
 This PDF is a selection from an out-of-print volume from the National Bureau of Economic Research Volume Title: Empirical Models of Urban Land Use: Suggestions on Research Objectives and Organization Volume
Local EPM Implementation Process in 5 stages
 Local PM Implementation Process in 5 stages 3. Working groups 1. City nvironmental Profile/ Outlook 5. Consolidation & Institutionalisation 4. Strategy & Action plans 2. City Consultation Urban nvironmental
Palmerston North Area Traffic Model
 Palmerston North Area Traffic Model Presentation to IPWEA 7 November 2014 PNATM Presentation Overview Model Scope and type Data collected The model Forecasting inputs Applications PNCC Aims and Objectives
Secretary for Gender, Child & Community Development
 Ministry of Gender, Child & Community Development Vote Number: 320 Controlling Officer: 1. Overview 1.1 Mission To Promote and protect women and children using community based and welfare approaches 1.2
Geospatial Analysis of Job-Housing Mismatch Using ArcGIS and Python
 Geospatial Analysis of Job-Housing Mismatch Using ArcGIS and Python 2016 ESRI User Conference June 29, 2016 San Diego, CA Jung Seo, Frank Wen, Simon Choi and Tom Vo, Research & Analysis Southern California
INTEGRATING CLIMATE VULNERABILITY & RISK ASSESSMENT INTO URBAN SPATIAL PLANNING PROCESS
 INTEGRATING CLIMATE VULNERABILITY & RISK ASSESSMENT INTO URBAN SPATIAL PLANNING PROCESS (CASE STUDY: BLITAR CITY, EAST JAVA, INDONESIA) SHINTA MICHIKO PUTERI, ST, MT. DR. IR. DENNY ZULKAIDI, MUP. WRITER
Modeling evacuation plan problems
 Chapter 7 Modeling evacuation plan problems In Section 3.1 we reviewed the recommendations that the UNESCO presented in [30] to develop volcanic emergency plans. In [18] is presented the state of art of
Spatial index of educational opportunities: Rio de Janeiro and Belo Horizonte
 Available online at www.sciencedirect.com Procedia Social and Behavioral Sciences 21 (2011) 287 293 International Conference: Spatial Thinking and Geographic Information Sciences 2011 Spatial index of
Assessment of Sustainable Land Use within the Town Planning Process Experiences with a Multi Criteria Approach (MCA)
") Assessment of Sustainable Land Use within the Town Planning Process Experiences with a Multi Criteria Approach (MCA) Dipl.-Geogr. Sophie Schetke Dipl.-Ing. Benedikt Frielinghaus, University of Bonn, Germany
Assessment of Sustainable Land Use within the Town Planning Process Experiences with a Multi Criteria Approach (MCA) Dipl.-Geogr. Sophie Schetke Dipl.-Ing. Benedikt Frielinghaus, University of Bonn, Germany
Regional Performance Measures
 G Performance Measures Regional Performance Measures Introduction This appendix highlights the performance of the MTP/SCS for 2035. The performance of the Revenue Constrained network also is compared to
Socio-Economic Levels and Human Mobility
 1 Socio-Economic Levels and Human Mobility V. Frias-Martinez, J. Virseda, E. Frias-Martinez Abstract Socio-economic levels provide an understanding of the population s access to housing, education, health
Planning for Economic and Job Growth
 Planning for Economic and Job Growth Mayors Innovation Project Winter 2012 Meeting January 21, 2012 Mary Kay Leonard Initiative for a Competitive Inner City AGENDA The Evolving Model for Urban Economic
Southington. Challenges
 Southington Southington, similar to its next-door neighbor Berlin, is a suburban community in the southeast part of the region. Originally an agricultural community, Southington has also hosted industry
TRIP GENERATION MODEL FOR THE CORE AREA OF THIRUVANANTHAPURAM CITY
 ISSN (Online) : 2319-8753 ISSN (Print) : 2347-6710 International Journal of Innovative Research in Science, Engineering and Technology An ISO 3297: 2007 Certified Organization, Volume 2, Special Issue
Regional Performance Measures
 G Performance Measures Regional Performance Measures Introduction This appendix highlights the performance of the MTP/SCS for 2035. The performance of the Revenue Constrained network also is compared to
Estimation of Travel demand from the city commuter region of Muvattupuzha municipal area Mini.M.I 1 Dr.Soosan George.T 2 Rema Devi.M.
 Estimation of Travel demand from the city commuter region of Muvattupuzha municipal area Mini.M.I 1 Dr.Soosan George.T 2 Rema Devi.M. 3 Professor, Department of Civil Engg., M.A.College of Engg, Kothamangalam,
Table-Top Exercise for Emergency Preparedness Evaluation: Little Anse, Isle Madame
 Table-Top Exercise for Emergency Preparedness Evaluation: Little Anse, Isle Madame Alexander Chung, M.Sc. Candidate C-Change Student Research Associate May 2013 The Community of Little Anse Coastal community
Implementation Performance Evaluation on Land Use Planning: A Case of Chengdu, China
 Cross-Cultural Communication Vol. 8, No. 4, 2012, pp. 34-38 DOI:10.3968/j.ccc.1923670020120804.1020 ISSN 1712-8358[Print] ISSN 1923-6700[Online] www.cscanada.net www.cscanada.org Implementation Performance