CRP 608 Winter 10 Class presentation February 04, Senior Research Associate Kirwan Institute for the Study of Race and Ethnicity
|
|
|
- Conrad Wiggins
- 5 years ago
- Views:
Transcription


1 CRP 608 Winter 10 Class presentation February 04, 2010 SAMIR GAMBHIR SAMIR GAMBHIR Senior Research Associate Kirwan Institute for the Study of Race and Ethnicity
2 Background Kirwan Institute Our work Using GIS for research and advocacy Opportunity Mapping Work in progress National Opportunity Model Web-based GIS
3 Multidisciplinary applied research institute Our mission is to expand opportunity for all, especially for our most marginalized communities Founded in 2003 by john powell Opportunity Communities Program (1/3 of staff) Opening pathways to opportunity for marginalized communities through investments in people, places and supporting linkages Opportunity mapping 3


4 Maps are incredibly efficient compacting volumes of data ability to convey information in seconds tell a story or solve a problem Research has shown that people can solve problems faster with map based information, than by looking at charts, tables or graphs
5 Why are maps particularly effective in dealing with issues of equity? Regional, racial and social inequity often manifest as spatial inequity Maps are naturally the best tools to display this spatial phenomena Maps give us the opportunity to look at our entire regions or states Informing people about an issue at a scale they may not usually think of linking communities sharing similar problems
6 In our work we see mapping as serving these primary advocacy goals Analysis Existing conditions, spatial trends, scenarios, optimization etc. Storytellingt A narrative Combination
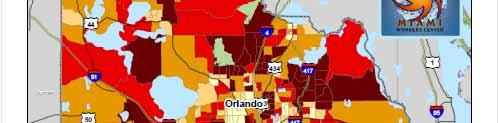
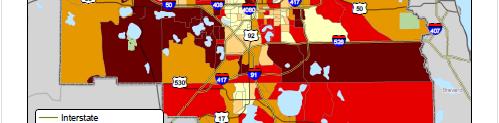
7 Are minority businesses located in areas of economic opportunity? (Cleveland) Are hospital investments benefiting communities of color? (Columbus) Are marginalized communities disproportionately affected by foreclosure crisis? i (Connecticut) t) Are job growth areas connected to transit? (Baltimore) What is the impact of stimulus money investment on job creation? (Florida)
8
9
10
11 Recent Job Growth and Public Transit in the Baltimore Region Percent Change in Jobs Job Loss


12
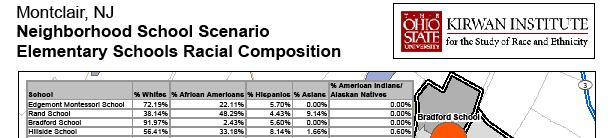
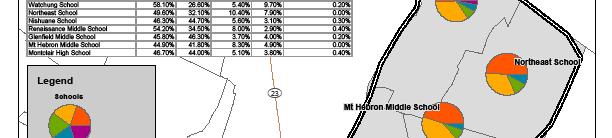
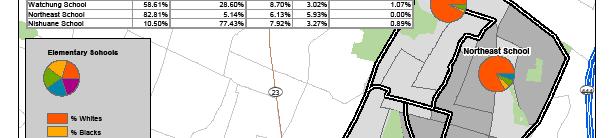
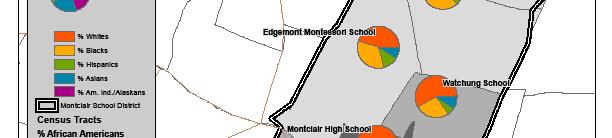
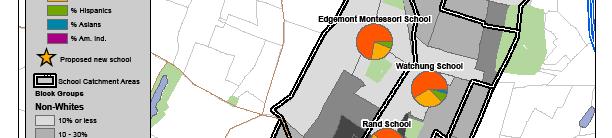
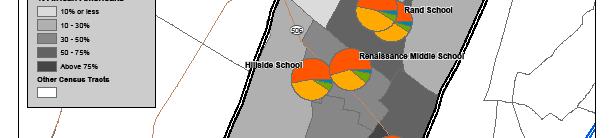
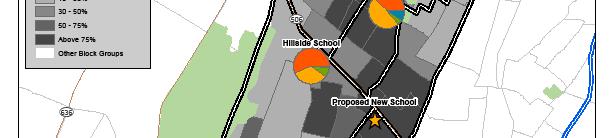
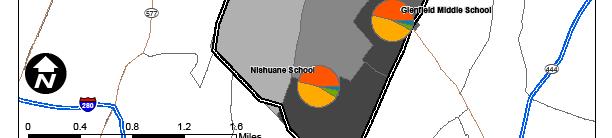
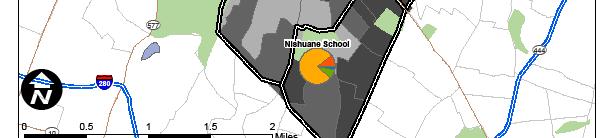
13 Subsidized housing policy is reinforcing segregation (Baltimore) Foreclosures in African American neighborhoods are due to subprime lending gp patterns (Cleveland) Vacant property problems are spreading, vacant property challenges are not just an inner city problem (Detroit) What if Montclair, NJ schools returned to neighborhood school system?
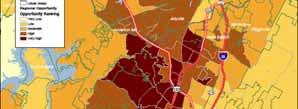
14 Subsidized housing opportunities in Baltimore are generally clustered in the region s predominately African American neighborhoods
15


16 Maps: Produced and adapted from Charles Bromley, SAGES Presidential Fellow, Case Western University
17 Growth of Vacant Housing in Detroit (% Vacant Housing in 1970 and 2000) City of Detroit Highways Counties Legend: Prepared by: Kirwan Institute Source Data: U.S. Census Bureau W N % of Homes Vacant S E % Vacant 1970 % Vacant Miles

18
19 Opportunity mapping is a research tool used to understand the dynamics of opportunity within metropolitan areas The purpose of opportunity mapping is to illustrate where opportunity rich communities exist (and assess who has access to these communities) Al t d t d h t d t b di d i Also, to understand what needs to be remedied in opportunity poor communities
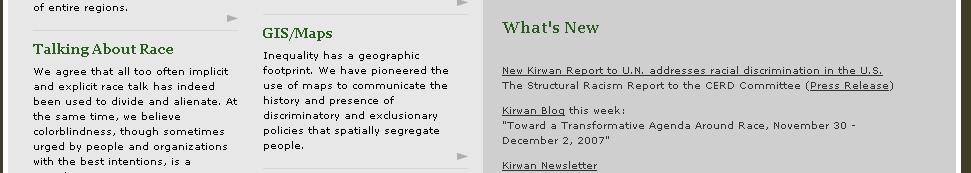
20 Inequality has a geographic footprint Maps can visually track the history and presence of discriminatory and exclusionary policies that spatially segregate g peoplep Identifying places with gaps in opportunity can y gp g p pp y help direct future investment and identify structures which impede access to opportunity


21 Opportunity is a situation or condition that places individuals in a position to be more likely to succeed or excel. Opportunity structures are critical to opening pathways to success: High quality education Healthy and safe environment Stable housing Sustainable employment Political empowerment Outlets for wealth building Positive social networks


22 22

23 Some people ride the Up escalator to reach opportunity. Others have to run up the Down escalator to get there.
24 A refined model to depict spatial pattern of opportunity Identifying indicators as proxy for opportunity Supported by social science literature Data easily available Index based approach compresses multi-factors to an index Model is a good communications tool to work with communities
25
26
27
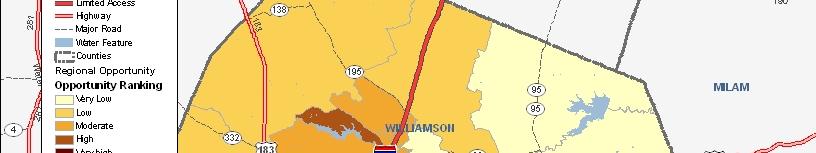
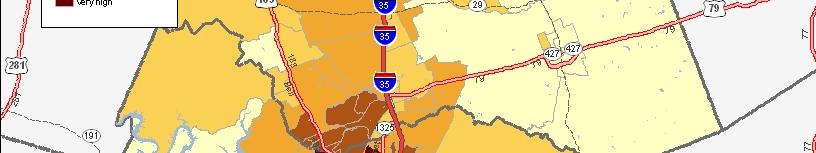
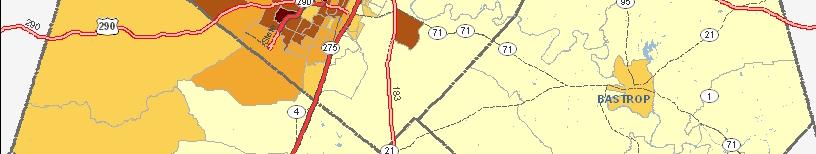
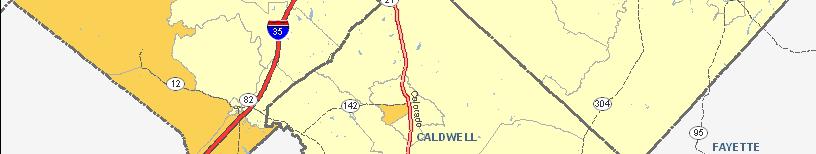
28
29
30 Identifying and selecting indicators of opportunity Identifying sources of data Compiling list of indicators (data matrix) Calculating Z scores Averaging these scores
31 Education Student/Teacher ratio? Test scores? Student mobility? Economic/Employment Indicators Unemployment rate? Proximity i to employment? Job creation? Neighborhood Quality Median home values? Crime rate? Housing vacancy rate? Mobility/Transportation Indicators Mean commute time? Access to public transit? Health & Environmental Indicators Access to health care? Exposure to toxic waste? Proximity to parks or open space?
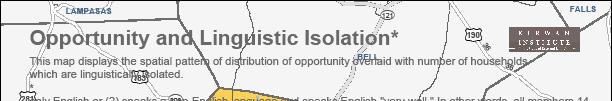
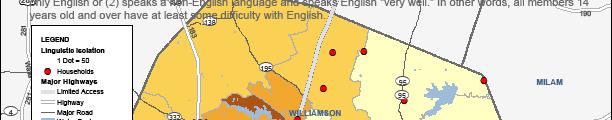
32 Federal Organizations Census Bureau County Business Patterns (ZIP Code Data) Housing and Urban Development (HUD) Environmental Protection ti Agency (EPA) State and Local Governmental Organizations Regional planning agencies Education boards/school districts Transportation agencies County Auditor s Office Other agencies (non-profit and Private) Schoolmatters.org DataPlace.org ESRI Business Analyst Claritas
33 INDICATORS DATA MATRIX EDUCATION DESCRIPTION Effect on opportunity Educational attainment for total population Percentage of population with college degree Positive School poverty for neighborhood schools Percentage of economically disadvantaged students Negative Teacher qualifications for neighborhood schools (or certified teachers) Percentage of Highly Qualified Teachers (HQT) Positive ENVIRONMENTAL & PUBLIC HEALTH Proximity i to toxic waste release sites Census tracts are ranked based on their distance from these facilities i Positive i Proximity to parks/open spaces Census tracts are ranked based on their distance from open spaces Negative Medically Underserved Areas Areas designated as MUA Positive
34 Z Score a statistical measure that quantifies the distance (measured in standard deviations) between data points and the mean Z Score = (Data point Mean)/ Standard Deviation Allows data for a geography (e.g. census tract) to be measured based on their relative distance from the average for the entire region Raw z score performance Mean value is always zero z score indicates distance from the mean Positive z score is always above the region s mean, Negative z score is always below the region s mean Indicators with negative effect on opportunity should have all the z scores adjusted to reflect this phenomena
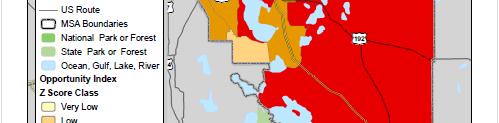
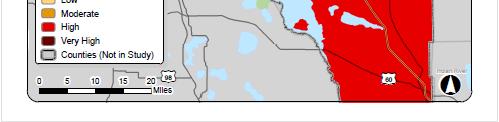
35 Final opportunity index for each census tract is the average of z scores (including adjusted scores for direction) for all indicators by category Census tracts can be ranked Opportunity level is determined by sorting a region s census tract z scores into ordered categories (very low, low, moderate, high, very high) Top 20% can be categorized as very high, bottom 20% - very low
36

37 Subsidized housing opportunities in Baltimore are generally clustered in the region s lowest opportunity neighborhoods


38 African American men are isolated from neighborhoods of opportunity in Detroit
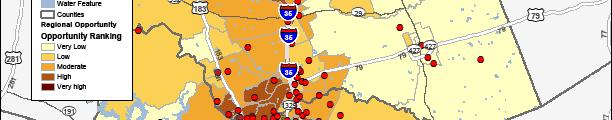
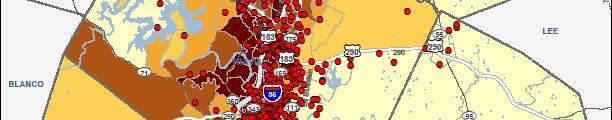
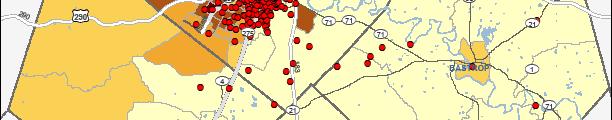
39 Low opportunity neighborhoods have higher number of linguistically isolated households
40
41
42 Need more research on methodology The model needs to be made more robust Critical analysis of all indicators e g job Critical analysis of all indicators e.g. job mismatch, park access issues
43 Customizing data transfer procedures National Opportunity Mapping Web-based based Opportunity mapping


44
45 Online interactive maps ArcGIS Server Baltimore Foreclosures ( wer.jsf?width=261&height=438) Open source Austin Opportunity Mapping ( projects/opportunity/index.html)


46
Mapping Communities of Opportunity in New Orleans
 Mapping Communities of Opportunity in New Orleans December 11, 2009 Samir Gambhir Senior Research Associate Kirwan Institute for the study of Race and Ethnicity The Ohio State University Gambhir.2@osu.edu
Mid-Term Report: New Orleans Opportunity Mapping An Analytical Tool to Aid Redevelopment
 Kirwan Institute for the Study of Race & Ethnicity 433 Mendenhall Laboratory 125 South Oval Mall Columbus, OH 43210 www.kirwaninstitute.org Mid-Term Report: New Orleans Opportunity Mapping An Analytical
Applying Health Outcome Data to Improve Health Equity
 Applying Health Outcome Data to Improve Health Equity Devon Williford, MPH, Health GIS Specialist Lorraine Dixon-Jones, Policy Analyst CDPHE Health Equity and Environmental Justice Collaborative Mile High
Mapping and Health Equity Advocacy
 Mapping and Health Equity Advocacy Sarah Treuhaft PolicyLink November 7, 2008 About us PolicyLink National research and action institute that advances policies to achieve economic and social equity Center
Are You Maximizing The Value Of All Your Data?
 Are You Maximizing The Value Of All Your Data? Using The SAS Bridge for ESRI With ArcGIS Business Analyst In A Retail Market Analysis SAS and ESRI: Bringing GIS Mapping and SAS Data Together Presented
Environmental Analysis, Chapter 4 Consequences, and Mitigation
 Environmental Analysis, Chapter 4 4.17 Environmental Justice This section summarizes the potential impacts described in Chapter 3, Transportation Impacts and Mitigation, and other sections of Chapter 4,
Demographic Data in ArcGIS. Harry J. Moore IV
 Demographic Data in ArcGIS Harry J. Moore IV Outline What is demographic data? Esri Demographic data - Real world examples with GIS - Redistricting - Emergency Preparedness - Economic Development Next
Do the Causes of Poverty Vary by Neighborhood Type?
 Do the Causes of Poverty Vary by Neighborhood Type? Suburbs and the 2010 Census Conference Uday Kandula 1 and Brian Mikelbank 2 1 Ph.D. Candidate, Maxine Levin College of Urban Affairs Cleveland State
BROOKINGS May
 Appendix 1. Technical Methodology This study combines detailed data on transit systems, demographics, and employment to determine the accessibility of jobs via transit within and across the country s 100
Spatial Organization of Data and Data Extraction from Maptitude
 Spatial Organization of Data and Data Extraction from Maptitude N. P. Taliceo Geospatial Information Sciences The University of Texas at Dallas UT Dallas GIS Workshop Richardson, TX March 30 31, 2018 1/
Hennepin GIS. Tree Planting Priority Areas - Analysis Methodology. GIS Services April 2018 GOAL:
 Hennepin GIS GIS Services April 2018 Tree Planting Priority Areas - Analysis Methodology GOAL: To create a GIS data layer that will aid Hennepin County Environment & Energy staff in determining where to
An Assessment of People, Place and Business on Syracuse s Near Northside
 An Assessment of People, Place and Business on Syracuse s Near Northside May 2013 Report produced by Jon Glass, Kelly Montague and Mark Pawliw Edited by Jon Glass and Jonnell Robinson Syracuse Community
Demographic Data. How to get it and how to use it (with caution) By Amber Keller
 By Amber Keller") Demographic Data How to get it and how to use it (with caution) By Amber Keller 101 Where does it come from? o The American Community Survey o Socio-economic characteristics of a population o Administered
Demographic Data How to get it and how to use it (with caution) By Amber Keller 101 Where does it come from? o The American Community Survey o Socio-economic characteristics of a population o Administered
APPENDIX C-3 Equitable Target Areas (ETA) Technical Analysis Methodology
 Technical Analysis Methodology") APPENDIX C-3 Equitable Target Areas (ETA) Technical Analysis Methodology Contents Introduction... 1 ETA Index Methodology... 1 ETA Index Development... 1 Other EJ Measures... 4 The Limited English Proficiency
APPENDIX C-3 Equitable Target Areas (ETA) Technical Analysis Methodology Contents Introduction... 1 ETA Index Methodology... 1 ETA Index Development... 1 Other EJ Measures... 4 The Limited English Proficiency
Geospatial Analysis of Job-Housing Mismatch Using ArcGIS and Python
 Geospatial Analysis of Job-Housing Mismatch Using ArcGIS and Python 2016 ESRI User Conference June 29, 2016 San Diego, CA Jung Seo, Frank Wen, Simon Choi and Tom Vo, Research & Analysis Southern California
Using the ACS to track the economic performance of U.S. inner cities
 Using the ACS to track the economic performance of U.S. inner cities 2017 ACS Data Users Conference May 11, 2017 Austin Nijhuis, Senior Research Analyst Initiative for a Competitive Inner (ICIC) ICIC ICIC
An online data and consulting resource of THE UNIVERSITY OF TOLEDO THE JACK FORD URBAN AFFAIRS CENTER
 An online data and consulting resource of THE JACK FORD URBAN AFFAIRS CENTER THE CENTER FOR GEOGRAPHIC INFORMATION SCIENCE AND APPLIED GEOGRAPHICS DEPARTMENT OF GEOGRAPHY AND PLANNING THE UNIVERSITY OF
ADDRESSING TITLE VI AND ENVIRONMENTAL JUSTICE IN LONG-RANGE TRANSPORTATION PLANS
 ADDRESSING TITLE VI AND ENVIRONMENTAL JUSTICE IN LONG-RANGE TRANSPORTATION PLANS Activities from the National Capital Region Transportation Planning Board Sergio Ritacco Transportation Planner 2017 Association
The CRP stresses a number of factors that point to both our changing demographics and our future opportunities with recommendations for:
 Plan Overview The CRP represents the first broad planning initiative covering Lake, Porter and LaPorte counties. Unlike previous plans released by NIRPC, which focused primarily on transportation, the
A Comprehensive Method for Identifying Optimal Areas for Supermarket Development. TRF Policy Solutions April 28, 2011
 A Comprehensive Method for Identifying Optimal Areas for Supermarket Development TRF Policy Solutions April 28, 2011 Profile of TRF The Reinvestment Fund builds wealth and opportunity for lowwealth communities
ESRI Delivering geographic information systems to millions of users
 Using Web GIS to Track Government Spending and Performance Eric Floss - ESRI April 12, 2010 ESRI Delivering geographic information systems to millions of users GIS Is Changing Everything How We Reason
Economic and Social Urban Indicators: A Spatial Decision Support System for Chicago Area Transportation Planning
 Economic and Social Urban Indicators: A Spatial Decision Support System for Chicago Area Transportation Planning Piyushimita Thakuriah (Vonu), P.S. Sriraj, Paul Metaxatos, Inshu Minocha & Tanushri Swarup
Can Public Transport Infrastructure Relieve Spatial Mismatch?
 Can Public Transport Infrastructure Relieve Spatial Mismatch? Evidence from Recent Light Rail Extensions Kilian Heilmann University of California San Diego April 20, 2015 Motivation Paradox: Even though
Planning for Economic and Job Growth
 Planning for Economic and Job Growth Mayors Innovation Project Winter 2012 Meeting January 21, 2012 Mary Kay Leonard Initiative for a Competitive Inner City AGENDA The Evolving Model for Urban Economic
from
 8Map Generalization and Classification Our human and natural environments are complex and full of detail. Maps work by strategically reducing detail and grouping phenomena together. Driven by your intent,
USR Opportunity Index
 OVERVIEW OF THE OHIO 2018-2019 USR Opportunity Index A new form-based, user-friendly framework for incentivizing economically stable and socially equitable housing development. This publication was produced
Strengthening Communities Through Neighborhood Data Baltimore Data Day 2015
 Strengthening Communities Through Neighborhood Data Baltimore Data Day 2015 #BaltimoreDataDay #VitalSigns13 @bniajfi www.bniajfi.org Role as Baltimore s Data Intermediary Democratization of Data Overcome
The econ Planning Suite: CPD Maps and the Con Plan in IDIS for Consortia Grantees Session 1
 The econ Planning Suite: CPD Maps and the Con Plan in IDIS for Consortia Grantees Session 1 1 Training Objectives Use CPD Maps to analyze, assess, and compare levels of need in your community Use IDIS
Medical GIS: New Uses of Mapping Technology in Public Health. Peter Hayward, PhD Department of Geography SUNY College at Oneonta
 Medical GIS: New Uses of Mapping Technology in Public Health Peter Hayward, PhD Department of Geography SUNY College at Oneonta Invited research seminar presentation at Bassett Healthcare. Cooperstown,
This report details analyses and methodologies used to examine and visualize the spatial and nonspatial
 Analysis Summary: Acute Myocardial Infarction and Social Determinants of Health Acute Myocardial Infarction Study Summary March 2014 Project Summary :: Purpose This report details analyses and methodologies
2009 ESRI User Conference San Diego, CA
 Guillaume Turcotte GIS Laboratory Technician Villanova University Determining Factors in the Siting of Undesirable Land Uses 2009 ESRI User Conference San Diego, CA Introduction and Literature Review Warren
HORIZON 2030: Land Use & Transportation November 2005
 PROJECTS Land Use An important component of the Horizon transportation planning process involved reviewing the area s comprehensive land use plans to ensure consistency between them and the longrange transportation
Three Ways the CSU is Using Geographic Information Systems (GIS) to Inform Decisions
 to Inform Decisions") Three Ways the CSU is Using Geographic Information Systems (GIS) to Inform Decisions Diana Lavery, Senior Research Analyst California State University, Office of the Chancellor California Association of
Three Ways the CSU is Using Geographic Information Systems (GIS) to Inform Decisions Diana Lavery, Senior Research Analyst California State University, Office of the Chancellor California Association of
Spatiotemporal Analysis of Commuting Patterns: Using ArcGIS and Big Data
 Spatiotemporal Analysis of Commuting Patterns: Using ArcGIS and Big Data 2017 ESRI User Conference July 13, 2017 San Diego, VA Jung Seo, Tom Vo, Frank Wen and Simon Choi Research & Analysis Southern California
3D - Boulder Valley Comprehensive Plan. Lesli Ellis Comprehensive Planning Manager City of Boulder
 3D - Boulder Valley Comprehensive Plan Lesli Ellis Comprehensive Planning Manager City of Boulder Presentation Boulder s use of 3D GIS and other tools in Comprehensive Planning (e.g., story maps, CityEngine,
Tracey Farrigan Research Geographer USDA-Economic Research Service
 Rural Poverty Symposium Federal Reserve Bank of Atlanta December 2-3, 2013 Tracey Farrigan Research Geographer USDA-Economic Research Service Justification Increasing demand for sub-county analysis Policy
Rural Pennsylvania: Where Is It Anyway? A Compendium of the Definitions of Rural and Rationale for Their Use
 Rural Pennsylvania: Where Is It Anyway? A Compendium of the Definitions of Rural and Rationale for Their Use Pennsylvania Office of Rural Health 310 Nursing Sciences Building University Park, PA 16802
TUESDAYS AT APA PLANNING AND HEALTH. SAGAR SHAH, PhD AMERICAN PLANNING ASSOCIATION SEPTEMBER 2017 DISCUSSING THE ROLE OF FACTORS INFLUENCING HEALTH
 SAGAR SHAH, PhD sshah@planning.org AMERICAN PLANNING ASSOCIATION SEPTEMBER 2017 TUESDAYS AT APA PLANNING AND HEALTH DISCUSSING THE ROLE OF FACTORS INFLUENCING HEALTH Outline of the Presentation PLANNING
Using GIS to Explore the Relationship between Socioeconomic Status and Demographic Variables and Crime in Pittsburgh, Pennsylvania
 Using GIS to Explore the Relationship between Socioeconomic Status and Demographic Variables and Crime in Pittsburgh, Pennsylvania Stephen E. Mitchell Department of Resource Analysis, Saint Mary s University
Summary Article: Poverty from Encyclopedia of Geography
 Topic Page: Poverty Definition: poverty from Dictionary of Energy Social Issues. the fact of being poor; the absence of wealth. A term with a wide range of interpretations depending on which markers of
Using ArcGIS Server to Bring Geospatial Analysis
 Using ArcGIS Server to Bring Geospatial Analysis and Mapping to non-gis Analysts ESRI Health User Conference September 22, 2009 Jim Laramie, Altarum Institute Sam Wang, Altarum Institute Agenda Agenda
NOACA s DART: Web GIS Tools for Transportation Planning. Chad Harris, NOACA Bryan Baker, Tierra Plan LLC Kevin Knapp, Tierra Plan LLC
 NOACA s DART: Web GIS Tools for Transportation Planning Chad Harris, NOACA Bryan Baker, Tierra Plan LLC Kevin Knapp, Tierra Plan LLC NOACA DART: Data Analysis and Reporting Tool NOACA: Northeast Ohio Areawide
Work-Based Learning Definitions State Agencies
 Work-Based Learning Definitions State Agencies Using Geographic Information Systems to Support Equitable Work-Based Learning Planning and Implementation OVERVIEW AND RESOURCES By Trent Sharp from the College
COMMUNITY SERVICE AREA
 INSTITUTE FOR TRIBAL ENVIRONMENTAL PROFESSIONALS Tribal Waste and Response Assistance Program (TWRAP) Developing and Implementing a Tribal Integrated Solid Waste Management Plan April 12-14, 2016 Palm
GIS Spatial Statistics for Public Opinion Survey Response Rates
 GIS Spatial Statistics for Public Opinion Survey Response Rates July 22, 2015 Timothy Michalowski Senior Statistical GIS Analyst Abt SRBI - New York, NY t.michalowski@srbi.com www.srbi.com Introduction
Transit Time Shed Analyzing Accessibility to Employment and Services
 Transit Time Shed Analyzing Accessibility to Employment and Services presented by Ammar Naji, Liz Thompson and Abdulnaser Arafat Shimberg Center for Housing Studies at the University of Florida www.shimberg.ufl.edu
Environmental Justice and the Environmental Protection Agency s Superfund Program
 Environmental Justice and the Environmental Protection Agency s Superfund Program Brian Alt Advance GIS 26 April 2011 Introduction In the late 1970 s the Environmental Protection Agency, the United States
Diffusion of GIS in Public Policy Doctoral Program
 Diffusion of GIS in Public Policy Doctoral Program By Fulbert Namwamba PhD Southern University This presentation demonstrate how GIS was introduced in the Public Policy Doctoral Program at Southern University,
Regional Performance Measures
 G Performance Measures Regional Performance Measures Introduction This appendix highlights the performance of the MTP/SCS for 2035. The performance of the Revenue Constrained network also is compared to
Victorian Liveability Indicator Program: Definition, Measurement and Application
 Victorian Liveability Indicator Program: Definition, Measurement and Application Dr Hannah Badland Senior Research Fellow Place, Health, and Liveability Program Melbourne School of Population and Global
CRP 272 Introduction To Regression Analysis
 CRP 272 Introduction To Regression Analysis 30 Relationships Among Two Variables: Interpretations One variable is used to explain another variable X Variable Independent Variable Explaining Variable Exogenous
Analysis of Bank Branches in the Greater Los Angeles Region
 Analysis of Bank Branches in the Greater Los Angeles Region Brian Moore Introduction The Community Reinvestment Act, passed by Congress in 1977, was written to address redlining by financial institutions.
Purpose Study conducted to determine the needs of the health care workforce related to GIS use, incorporation and training.
 GIS and Health Care: Educational Needs Assessment Cindy Gotz, MPH, CHES Janice Frates, Ph.D. Suzanne Wechsler, Ph.D. Departments of Health Care Administration & Geography California State University Long
GEOG 3340: Introduction to Human Geography Research
 GEOG 3340: Introduction to Human Geography Research Lecture 1: Course Overview Guofeng Cao www.myweb.ttu.edu/gucao Department of Geosciences Texas Tech University guofeng.cao@ttu.edu Fall 2015 Course Description
MEASURING RACIAL RESIDENTIAL SEGREGATION
 MEASURING RACIAL RESIDENTIAL SEGREGATION Race Relations Institute Fisk University 1000 Seventeenth Ave. North Nashville, Tennessee 37208 615/329-8575 WHERE WE LIVE: THE COLOR LINE The color line is carved
CIRES Web Map Application Design Overview
 CIRES Web Map Application Design Overview Prepared by: Natalie Chan Ho Man, Greenest/ Healthy City Scholar, August 2018 Prepared for: Wes Regan, Social Planner II, Social Policy & Project Division, City
Application of Indirect Race/ Ethnicity Data in Quality Metric Analyses
 Background The fifteen wholly-owned health plans under WellPoint, Inc. (WellPoint) historically did not collect data in regard to the race/ethnicity of it members. In order to overcome this lack of data
EICCARS WORKBOOK FOR INITIATING COMMUNITY PROFILES WITH STATISTICAL AND OTHER SECONDARY DATA
 The Cultural Ecology of Health and Change (CEHC) Working Papers Ethnographically Informed Community and Cultural Assessment Research Systems (EICCARS) Workbooks EICCARS WORKBOOK FOR INITIATING COMMUNITY
Cultural Data in Planning and Economic Development. Chris Dwyer, RMC Research Sponsor: Rockefeller Foundation
 Cultural Data in Planning and Economic Development Chris Dwyer, RMC Research Sponsor: Rockefeller Foundation A Decade of Attempts to Quantify Arts and Culture Economic impact studies Community indicators
ITEM 11 Information June 20, Visualize 2045: Update to the Equity Emphasis Areas. None
 ITEM 11 Information June 20, 2018 Visualize 2045: Update to the Equity Emphasis Areas Staff Recommendation: Issues: Background: Briefing on the TPB-approved methodology to update the Equity Emphasis Areas
Analyzing the Geospatial Rates of the Primary Care Physician Labor Supply in the Contiguous United States
 Analyzing the Geospatial Rates of the Primary Care Physician Labor Supply in the Contiguous United States By Russ Frith Advisor: Dr. Raid Amin University of W. Florida Capstone Project in Statistics April,
hurricane harvey and equitable recovery
 hurricane harvey and equitable recovery Mapping social vulnerability and intensity of wind and flooding from Hurricane Harvey in Texas hurricane harvey s impact on texas In August 2017, Hurricane Harvey
Evaluating Community Analyst for Use in School Demography Studies
 Portland State University PDXScholar Publications, Reports and Presentations Population Research Center 7-2013 Evaluating Community Analyst for Use in School Demography Studies Richard Lycan Portland State
Descriptive Statistics
 Applied Econometrics Descriptive Statistics Michael Ash Econ 753 Descriptive Statistics p.1/22 Review of Summers Good econometrics Bad econometrics Interesting Exploratory Robust Critical test of deductive
Topic 4: Changing cities
 Topic 4: Changing cities Overview of urban patterns and processes 4.1 Urbanisation is a global process a. Contrasting trends in urbanisation over the last 50 years in different parts of the world (developed,
Local Economic Activity Around Rapid Transit Stations
 Local Economic Activity Around Rapid Transit Stations The Case of Chicago s Orange Line Julie Cooper, MPP 2014 Harris School of Public Policy Transport Chicago June 6, 2014 Motivation Impacts of transit
Internet GIS Sites. 2 OakMapper webgis Application
 Internet GIS Sites # Name URL Description 1 City of Sugar Land http://www.sugarlandtx.gov/index.htm It is a city in Texas with 65,000 Residents. The City of Sugar Land, Texas, provides ArcIMS-based maps
GIS and Community Health. GIS and Community Health. Institutional Context and Interests in GIS Development. GIS and Community Health
 GIS and Community Health GIS and Community Health Some critiques of GIS emphasize the potentially harmful social consequences of the diffusion of GIS technology, including reinforcing the power of state
The Attractive Side of Corpus Christi: A Study of the City s Downtown Economic Growth
 The Attractive Side of Corpus Christi: A Study of the City s Downtown Economic Growth GISC PROJECT DR. LUCY HUANG SPRING 2012 DIONNE BRYANT Introduction Background As a GIS Intern working with the City
ENV208/ENV508 Applied GIS. Week 1: What is GIS?
 ENV208/ENV508 Applied GIS Week 1: What is GIS? 1 WHAT IS GIS? A GIS integrates hardware, software, and data for capturing, managing, analyzing, and displaying all forms of geographically referenced information.
A Framework for Incorporating Community Benefits Agreements into. 14 July
 A Framework for Incorporating Community Benefits Agreements into Brownfield Redevelopm ent Projects: The Case of Chelsea, Massachusetts I. Introduction to the Project 2010 ESRI User Conference 14 July
Population Profiles
 U N D E R S T A N D I N G A N D E X P L O R I N G D E M O G R A P H I C C H A N G E MAPPING AMERICA S FUTURES, BRIEF 6 2000 2010 Population Profiles Atlanta, Las Vegas, Washington, DC, and Youngstown Allison
EXAMINING THE DEMOGRAPHICS OF THE DOG RIVER WATERSHED
 EXAMINING THE DEMOGRAPHICS OF THE DOG RIVER WATERSHED Phillip B. Whatley, Department of Earth Sciences, University of South Alabama, Mobile, AL, 36688. Email: pbw401@jaguar1.usouthal.edu. Examining the
C) Discuss two factors that are contributing to the rapid geographical shifts in urbanization on a global scale.
 Discuss two factors that are contributing to the rapid geographical shifts in urbanization on a global scale.") AP Human Geography Unit VII. Cities and Urban Land Use Free Response Questions FRQ 1 Rapid urbanization in Least Developed Countries (LDCs) has many profound impacts for the world. Answer the following
AP Human Geography Unit VII. Cities and Urban Land Use Free Response Questions FRQ 1 Rapid urbanization in Least Developed Countries (LDCs) has many profound impacts for the world. Answer the following
Regional Performance Measures
 G Performance Measures Regional Performance Measures Introduction This appendix highlights the performance of the MTP/SCS for 2035. The performance of the Revenue Constrained network also is compared to
LEHMAN COLLEGE OF THE CITY UNIVERSITY OF NEW YORK. 1. Type of Change: Change in Degree Requirements
 Alpha Number: Hegis Code 1214 Program Code: 30600 1. Type of Change: Change in Degree Requirements 2. From: [The curriculum consists of 45 graduate credits and includes core courses, an area of specialization,
Toxic Wastes and Race at Twenty:
 Chapter 3 Racial and Socioeconomic Disparities in the Distribution of Environmental Hazards: Assessing the Evidence Twenty Years after Toxic Wastes and Race* The publication in 1987 of the United Church
Jobs-Housing Fit: Linking Housing Affordability and Local Wages
 Jobs-Housing Fit: Linking Housing Affordability and Local Wages Alex Karner, PhD Assistant Professor School of City and Regional Planning Georgia Institute of Technology Chris Benner, PhD Dorothy E. Everett
Map your way to deeper insights
 Map your way to deeper insights Target, forecast and plan by geographic region Highlights Apply your data to pre-installed map templates and customize to meet your needs. Select from included map files
Transit Service Gap Technical Documentation
 Transit Service Gap Technical Documentation Introduction This document is an accompaniment to the AllTransit TM transit gap methods document. It is a detailed explanation of the process used to develop
Neighborhood social characteristics and chronic disease outcomes: does the geographic scale of neighborhood matter? Malia Jones
 Neighborhood social characteristics and chronic disease outcomes: does the geographic scale of neighborhood matter? Malia Jones Prepared for consideration for PAA 2013 Short Abstract Empirical research
Opportunities and challenges of HCMC in the process of development
 Opportunities and challenges of HCMC in the process of development Lê Văn Thành HIDS HCMC, Sept. 16-17, 2009 Contents The city starting point Achievement and difficulties Development perspective and goals
1Department of Demography and Organization Studies, University of Texas at San Antonio, One UTSA Circle, San Antonio, TX
 Well, it depends on where you're born: A practical application of geographically weighted regression to the study of infant mortality in the U.S. P. Johnelle Sparks and Corey S. Sparks 1 Introduction Infant
GIS Monroe Geographic Information System March 14, 2018
 GIS Monroe Geographic Information System March 14, 2018 Goals Maintain Enterprise/County-wide geo-database Increase spatial accuracy of data Build and acquire more data layers Increase use of GIS; as another
RELATIONAL DATA MODELING TO ENHANCE GIS-BASED VISUAL INFORMATION SYSTEMS
 RELATIONAL DATA MODELING TO ENHANCE GIS-BASED VISUAL INFORMATION SYSTEMS Matthew A. North, Washington & Jefferson College, mnorth@washjeff.edu Samuel B. Fee, Washington & Jefferson College, sfee@washjeff.edu
Where to Invest Affordable Housing Dollars in Polk County?: A Spatial Analysis of Opportunity Areas
 Resilient Neighborhoods Technical Reports and White Papers Resilient Neighborhoods Initiative 6-2014 Where to Invest Affordable Housing Dollars in Polk County?: A Spatial Analysis of Opportunity Areas
STAR COMMUNITY RATING SYSTEM OBJECTIVE EE-4: EQUITABLE SERVICES & ACCESS COMMUNITY LEVEL OUTCOMES FOR KING COUNTY, WA
 STAR COMMUNITY RATING SYSTEM OBJECTIVE EE-4: EQUITABLE SERVICES & ACCESS COMMUNITY LEVEL OUTCOMES FOR KING COUNTY, WA OUTCOME I: EQUITABLE ACCESS AND PROXIMITY Background: This analysis has been developed
MULTIPLE CHOICE. Choose the one alternative that best completes the statement or answers the question.
 AP Test 13 Review Name MULTIPLE CHOICE. Choose the one alternative that best completes the statement or answers the question. 1) Compared to the United States, poor families in European cities are more
APPENDIX PHASE 1 GREEN INFRASTRUCTURE FRAMEWORK
 APPENDIX PHASE 1 GREEN INFRASTRUCTURE FRAMEWORK KANSAS MISSOURI CONTENTS A DATA WISHLIST 4 B PRECEDENTS 7 C WORKSHOP MATERIALS 13 D ANALYSIS PROCESS 124 E ATLAS & PLAYBOOK DETAILS 156 F POLICY ANALYSIS
Initial Findings from Regional Initiatives Planning Enhancement Fair Housing & Equity Assessment
 NEW YORK AND CONNECTICUT SUSTAINABLE COMMUNITIES Initial Findings from Regional Initiatives Planning Enhancement Fair Housing & Equity Assessment July 30, 2013 White Plains Library Federal grant to improve
KENTUCKY HAZARD MITIGATION PLAN RISK ASSESSMENT
 KENTUCKY HAZARD MITIGATION PLAN RISK ASSESSMENT Presentation Outline Development of the 2013 State Hazard Mitigation Plan Risk Assessment Determining risk assessment scale Census Data Aggregation Levels
HAZUS-MH: Earthquake Event Report
 HAZUS-MH: Earthquake Event Report Region Name: El Paso County Earthquake Scenario: El Paso County Random EQ Print Date: February 08, 2006 Disclaimer: The estimates of social and economic impacts contained
INSIDE. Metric Descriptions by Topic Area. Data Sources and Methodology by Topic Area. Technical Appendix
 As part of the Chicago Neighborhoods 2015 (CN2015) project, the Institute for Housing Studies at DePaul University collected data and built metrics to help The Chicago Community Trust and the City of Chicago
Geodatabase for Sustainable Urban Development. Presented By Rhonda Maronn Maurice Johns Daniel Ashney Jack Anliker
 Geodatabase for Sustainable Urban Development Presented By Rhonda Maronn Maurice Johns Daniel Ashney Jack Anliker Objective Build a Geodatabase that will enable urban planners to create and assess the
Final Group Project Paper. Where Should I Move: The Big Apple or The Lone Star State
 Final Group Project Paper Where Should I Move: The Big Apple or The Lone Star State By: Nathan Binder, Shannon Scolforo, Kristina Conste, Madison Quinones Main Goal: Determine whether New York or Texas
Online Robustness Appendix to Endogenous Gentrification and Housing Price Dynamics
 Online Robustness Appendix to Endogenous Gentrification and Housing Price Dynamics Robustness Appendix to Endogenous Gentrification and Housing Price Dynamics This robustness appendix provides a variety
Environmental Justice Analysis
 Environmental Justice Analysis October 2013 Transportation Department Environmental Justice Analysis Background The U.S. Environmental Protection Agency (EPA) defines environmental justice as the fair
Child Opportunity Index Mapping
 Child Opportunity Index Mapping A partnership project of How to Use and Interpret the Child Opportunity Index Maps How to Use the Child Opportunity Index Maps Getting Started: How to Find and Open a Child
Keywords: Air Quality, Environmental Justice, Vehicle Emissions, Public Health, Monitoring Network
 NOTICE: this is the author s version of a work that was accepted for publication in Transportation Research Part D: Transport and Environment. Changes resulting from the publishing process, such as peer
During the latter half of the twentieth. Modest Progress:
 Center on Urban & Metropolitan Policy Modest Progress: The Narrowing Spatial Mismatch Between Blacks and Jobs in the 1990s Steven Raphael, University of California, Berkeley Michael A. Stoll, University