GIS Analysis of Crenshaw/LAX Line
|
|
|
- Jesse Cobb
- 6 years ago
- Views:
Transcription

1 PDD 631 Geographic Information Systems for Public Policy, Planning & Development GIS Analysis of Crenshaw/LAX Line Biying Zhao Professor Barry Waite and Bonnie Shrewsbury May 12 th, 2015
2 Introduction Los Angeles is home to one of the country s best public transportation networks, including subways, light-rail, buses and shuttles to nearly every corner of the Greater Los Angeles area. Metro Rail is an essential urban rail system for public transit, which serves the whole County. The average daily weekday ridership for the system is over one million in 2015 (Metro Apr. 2015). The public transit attracts increasing attention and the effect of the transit expansion becomes the focus for social, economic and environmental issue. Especially, the accessibility and convenience for surrounding residents are of vital convenience. The Metro Crenshaw/LAX Line is an under construction mass transit line project. Based on the current stations, the Crenshaw/LAX Line will operate on a new 8.5-mile light-rail (LRT) route, starting at the Expo/Crenshaw station on the Metro Expo Line, and ending at the existing Imperial/Aviation station (on the Metro Green Line). This project will provide a new light-rail service, which will connect the whole southwest LA, and connect the Crenshaw District and Leimert Park to Inglewood and Los Angeles International Airport (LAX). The new Metro Rail extension will offer an alternative transportation option to congested roadways and provide significant environmental benefits, economic development and employment opportunities throughout Los Angeles County. Riders will be able to make easy connections within the entire Metro Rail system, municipal bus lines and other regional transportation services. The analysis from GIS evaluation of the Crenshaw/LAX Line is essential for the future ridership projection. And consequently providing practical experience and advice for future public transit development.
.")
3 Basic information about Crenshaw/LAX Line An 8.5mile extension from the Metro Exposition Line at Crenshaw and Exposition to the Metro Green Line Aviation/LAX Station. Six new stations at Crenshaw/Exposition, Crenshaw/Martin Luther King Jr. Bl, Crenshaw/Slauson, Florence/West, Florence/La Brea and Aviation/Century. Optional Station at Crenshaw/Vernon (Leimert Park). New park/ride lots at Crenshaw/Exposition, Florence/West and Florence/La Brea. A new maintenance facility at Arbor Vitae/Bellanca, near LAX. All stations include public art and provide convenient access to disabled patrons. Forecasted opening: The report outlines the basic demographic condition for the Crenshaw/LAX. The analysis in the census tracts include population, median household income, and car ownership in the surrounding area of the LAX /Crenshaw line. By analyzing and interpreting the demographic data of the surrounding areas, it intends to provide effective advices and practical experiences further public transit development. Data Selection The U.S. Census Bureau, Los Angeles County GIS Data Portal, and Metro Developer provide different demographic and metro data for research. The base map is a Shapefile of City Boundaries that derived from the Los Angeles County Boundary.

4 The census tracts of Los Angeles County, total population and median household income data were selected as demographic indicators for the research questions. Since Crenshaw/LAX Line is still under construction, the necessary format for Arc GIS could not be found on the websites, thus the stations of the Line were drawn manually. Layout Distribution and Analysis Figure 1. Metro Rail Lines in Los Angeles County The layout shows the current five Lines of Metro Rail in Los Angeles County and the ongoing Crenshaw/LAX Line.

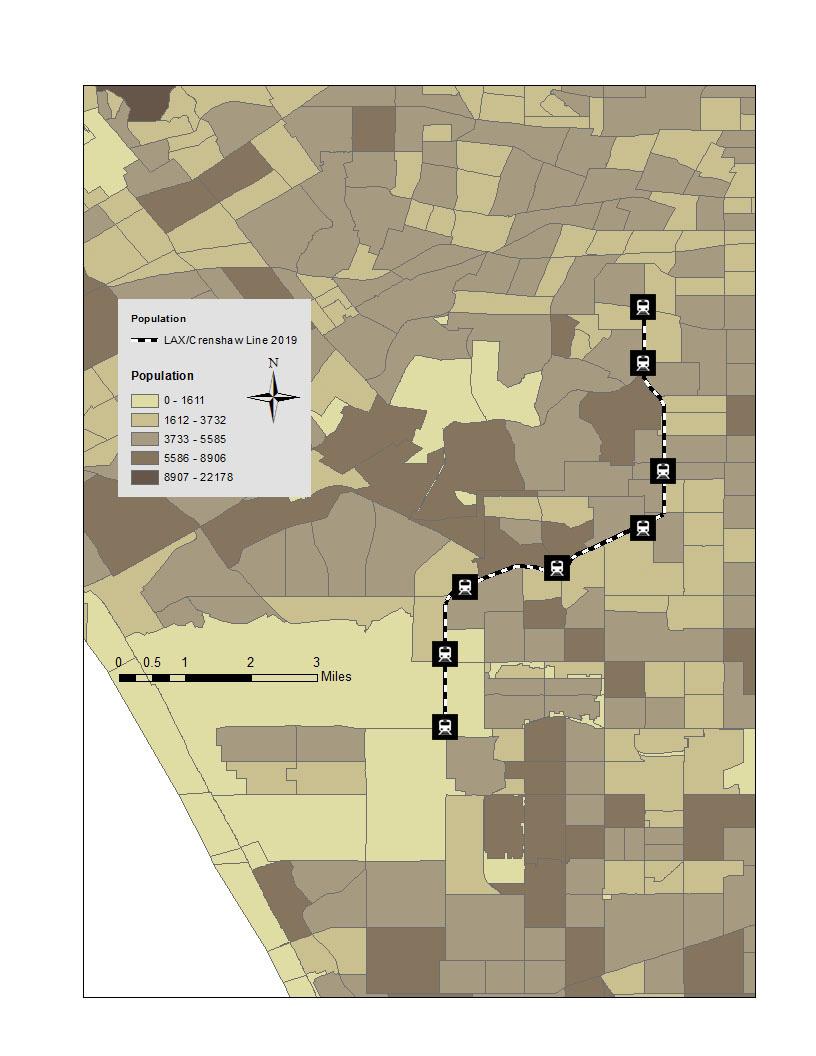
5 Figure 2. Crenshaw/LAX Line 2019 The construction of Crenshaw/LAX Line will connect with Red/Purple Lines, and Green Line at existing Imperial/Aviation station, and mainly within South Los Angeles (Derived from Metro Website). The northern half of the route follows Crenshaw Boulevard from Exposition Blvd down to 67th Street. The southern half of the route utilizes the Harbor Subdivision Right-Of-Way (ROW) from Crenshaw Boulevard to the Green Line just south of Imperial/Aviation. Project completion is expected in Figure 3. Population Distribution The ongoing project is mainly within high population density areas. Population gathering in locations with public transit, especially subway systems are widespread phenomena in many metropolitans. The high efficiency that provided by well-developed public transit will vibrate cities and promote the land value close to transit stations. Due to the suburban sprawl, Los Angeles County contains a spread out population and limited public transit ridership that is very different from other metropolitans. The large area of extreme low population density at the southwest part is due to the existing of LAX.
6

7 Figure 4. Income Distribution
8 The income distribution is a key factor to households daily trips and travel behaviors in Los Angeles County. According to the map, the most median household income of surrounding areas is under US median. Since the low-income and working class household cannot afford a private vehicle, the public transit is their only travel choice for most of their daily trips. And their range of activity is limited by the Metro Rail route. For the middle-income and rich class, private vehicles are necessities for their daily lives. The distance to public transit is a less important factor to the selection of their residential addresses. Consequently, the low-income and working class are the majority of current Metro Rail riders. The Crenshaw/LAX Line is designated to provide wider access to LAX and different destinations for those people. Figure 5. Car Ownership Distribution
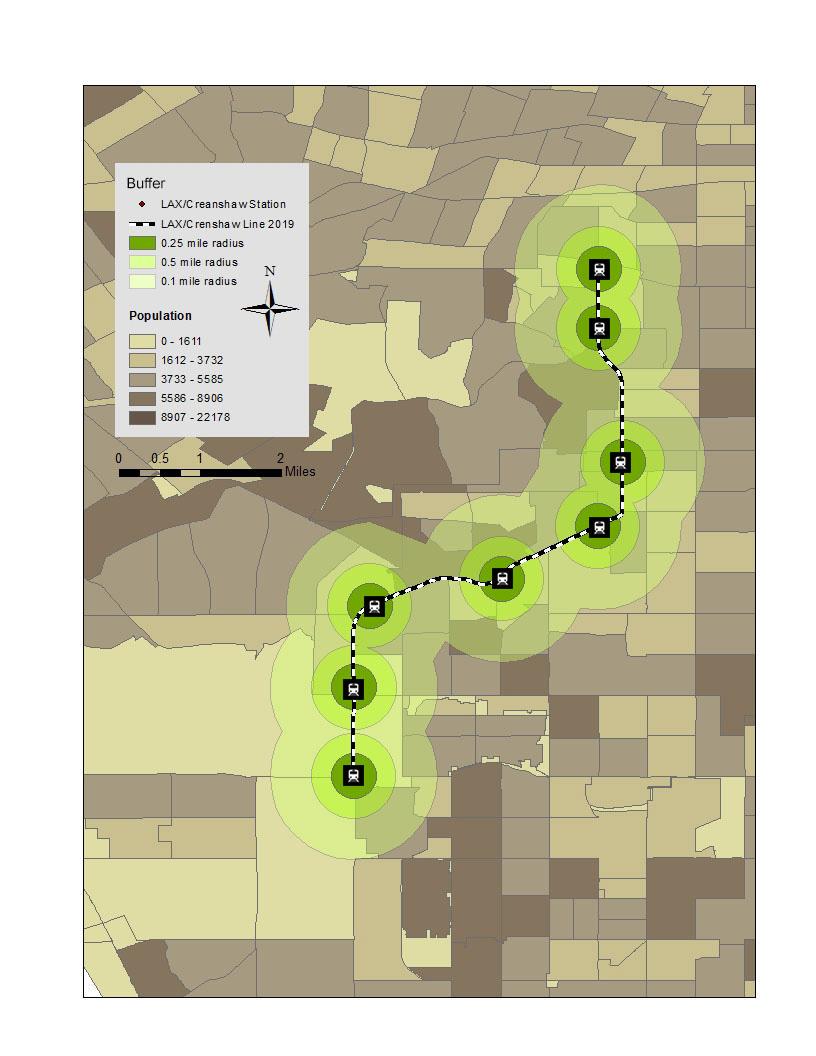
9 The surrounding areas of the Crenshaw/LAX Line have a comparative lower car ownership. It is mainly due to the low income of residents. The Crenshaw/LAX Line is projected to meet the need of the surrounding residents. Figure 6. Crenshaw/LAX Line Buffer Region & Population The buffer zones are created to analyze the accessibility and walkability of the Crenshaw/LAX Line stations as Station Node regions. Each Crenshaw/LAX Line stations are the center of the buffer zones; a buffer with quarter-mile radius and a buffer with a half-mile radius are created and dissolved for the station node walkability. The buffers with one-mile radius are the zones for potential riders such as cyclists and bus riders travelling from further neighborhood communities to switch travel mode and travel further. According to the map, within the half-mile radius buffer zones, the population is not dense at walkable station nodes. The one-mile radius buffers cover the surrounding areas and will satisfy the commuters trip demands. The stations with the densest population in the buffer zone are Crenshaw/MLK Station and Florence/LA Brea Station. Although Aviation/LAX Station is in low population density area, it may has the largest readership due to the commuters travelling between others areas and LAX.
10

11 Figure 7. Crenshaw/LAX Line Buffer Region & Income

12 The major median incomes of households around Crenshaw/LAX Line are under U.S. median. Since the low-income and working class are the main distribution of public transit ridership, the construction of Crenshaw/LAX Line is intended to meet their demands, as well as provide multi transit potions for passengers from and to LAX. After the opening of the six new stations, the diversity and ridership of passengers on Metro Rail will increased. Figure 8. Crenshaw/LAX Line Buffer Region & Car Ownership The project is initially intended to provide access to LAX and other destinations for low-income and working class who cannot afford private vehicles. As a result, the locations of stations are mainly in relative lower can ownership areas. In the long run, Crenshaw/LAX Line project will encourage more residents from middle class neighborhoods to reduce private vehicle trips by providing a more developed LA rail system.
13 Conclusion The main goal of establishing metro lines and creating the public transit system is to serve the low-income residents and divert people from their cars, which is also beneficial for environment. A fully developed rail system will also provide multi transit options for different class passengers. When considering the route and stops of a line, people always pay attention to the low-income and minority. Obviously, public transit can provide more travel opportunities to the groups, which are not affordable to own private cars. Additionally, what is also needed to be in mind is that new construction or routes should avoid making congestion to the existing transit operation. References U.S. Census Bureau, Metro developer, Los Angeles County GIS Data Portal, Los Angeles Transit, Neighborhood and Plans, LA Census Tracts, Factfinder demographic data, Crenshaw/LAX Transit Project,
BROOKINGS May
 Appendix 1. Technical Methodology This study combines detailed data on transit systems, demographics, and employment to determine the accessibility of jobs via transit within and across the country s 100
Speakers: Jeff Price, Federal Transit Administration Linda Young, Center for Neighborhood Technology Sofia Becker, Center for Neighborhood Technology
 Speakers: Jeff Price, Federal Transit Administration Linda Young, Center for Neighborhood Technology Sofia Becker, Center for Neighborhood Technology Peter Haas, Center for Neighborhood Technology Craig
Analyzing the Market Share of Commuter Rail Stations using LEHD Data
 Analyzing the Market Share of Commuter Rail Stations using LEHD Data Using Census Data for Transportation Applications Conference, Irvine, CA October 26, 2011 1. What is the size of Metrolink s commute
Frequently Asked Questions
 What is the Regional Transit Engagement Series? As one of the fastest growing regions in the country, there is recognition that long-term transit planning efforts should be accelerated if we are to remain
Alternatives Analysis Report
 1.0 PURPOSE AND NEED The Southern California Association of Governments (SCAG), in coordination with the Los Angeles County Metropolitan Transportation Authority (Metro) and the Orange County Transportation
East Bay BRT. Planning for Bus Rapid Transit
 East Bay BRT Planning for Bus Rapid Transit Regional Vision Draper Prison The Bottleneck is a State-Level issue, Salt Lake County 2050 Population: 1.5M Draper Prison hopefully with some State-Level funding!
Forecasts for the Reston/Dulles Rail Corridor and Route 28 Corridor 2010 to 2050
 George Mason University Center for Regional Analysis Forecasts for the Reston/Dulles Rail Corridor and Route 28 Corridor 21 to 25 Prepared for the Fairfax County Department of Planning and Zoning Lisa
Westside Extension Los Angeles, California
 Westside Extension Los Angeles, California Rail~Volution 2010 Portland, Oregon Monica Villalobos AECOM History of Westside Suburban Growth in the Westside (1920 1970 s) LA Centers Concept + Employment
Alternatives Analysis
 Alternatives Analysis Prepared for: Metropolitan Atlanta Rapid Transit Authority Prepared by: AECOM/Jacobs-JJG Joint Venture Atlanta, GA November 2012 Page Left Intentionally Blank ii TABLE OF CONTENTS
Local Economic Activity Around Rapid Transit Stations
 Local Economic Activity Around Rapid Transit Stations The Case of Chicago s Orange Line Julie Cooper, MPP 2014 Harris School of Public Policy Transport Chicago June 6, 2014 Motivation Impacts of transit
Geospatial Analysis of Job-Housing Mismatch Using ArcGIS and Python
 Geospatial Analysis of Job-Housing Mismatch Using ArcGIS and Python 2016 ESRI User Conference June 29, 2016 San Diego, CA Jung Seo, Frank Wen, Simon Choi and Tom Vo, Research & Analysis Southern California
Assessing spatial distribution and variability of destinations in inner-city Sydney from travel diary and smartphone location data
 Assessing spatial distribution and variability of destinations in inner-city Sydney from travel diary and smartphone location data Richard B. Ellison 1, Adrian B. Ellison 1 and Stephen P. Greaves 1 1 Institute
Appendixx C Travel Demand Model Development and Forecasting Lubbock Outer Route Study June 2014
 Appendix C Travel Demand Model Development and Forecasting Lubbock Outer Route Study June 2014 CONTENTS List of Figures-... 3 List of Tables... 4 Introduction... 1 Application of the Lubbock Travel Demand
Metrolinx Transit Accessibility/Connectivity Toolkit
 Metrolinx Transit Accessibility/Connectivity Toolkit Christopher Livett, MSc Transportation Planning Analyst Research and Planning Analytics Tweet about this presentation #TransitGIS OUTLINE 1. Who is
HORIZON 2030: Land Use & Transportation November 2005
 PROJECTS Land Use An important component of the Horizon transportation planning process involved reviewing the area s comprehensive land use plans to ensure consistency between them and the longrange transportation
Transit-Oriented Development. Christoffer Weckström
 Transit-Oriented Development Christoffer Weckström 31.10.2017 Outline Context of Transit-oriented Development Elements of Transit-oriented Development A short history of land use and transit integration
Figure 8.2a Variation of suburban character, transit access and pedestrian accessibility by TAZ label in the study area
 Figure 8.2a Variation of suburban character, transit access and pedestrian accessibility by TAZ label in the study area Figure 8.2b Variation of suburban character, commercial residential balance and mix
Spatial Organization of Data and Data Extraction from Maptitude
 Spatial Organization of Data and Data Extraction from Maptitude N. P. Taliceo Geospatial Information Sciences The University of Texas at Dallas UT Dallas GIS Workshop Richardson, TX March 30 31, 2018 1/
The 3V Approach. Transforming the Urban Space through Transit Oriented Development. Gerald Ollivier Transport Cluster Leader World Bank Hub Singapore
 Transforming the Urban Space through Transit Oriented Development The 3V Approach Gerald Ollivier Transport Cluster Leader World Bank Hub Singapore MDTF on Sustainable Urbanization The China-World Bank
Mapping Accessibility Over Time
 Journal of Maps, 2006, 76-87 Mapping Accessibility Over Time AHMED EL-GENEIDY and DAVID LEVINSON University of Minnesota, 500 Pillsbury Drive S.E., Minneapolis, MN 55455, USA; geneidy@umn.edu (Received
Regional Performance Measures
 G Performance Measures Regional Performance Measures Introduction This appendix highlights the performance of the MTP/SCS for 2035. The performance of the Revenue Constrained network also is compared to
California Urban Infill Trip Generation Study. Jim Daisa, P.E.
 California Urban Infill Trip Generation Study Jim Daisa, P.E. What We Did in the Study Develop trip generation rates for land uses in urban areas of California Establish a California urban land use trip
3.0 ANALYSIS OF FUTURE TRANSPORTATION NEEDS
 3.0 ANALYSIS OF FUTURE TRANSPORTATION NEEDS In order to better determine future roadway expansion and connectivity needs, future population growth and land development patterns were analyzed as part of
Urban Planning Word Search Level 1
 Urban Planning Word Search Level 1 B C P U E C O S Y S T E M P A R E U O E U R B A N P L A N N E R T N S T D H E C O U N T Y G E R E R D W R E N I C I T Y C O U N C I L A A A S U G G C I L A G P R I R
Regional Performance Measures
 G Performance Measures Regional Performance Measures Introduction This appendix highlights the performance of the MTP/SCS for 2035. The performance of the Revenue Constrained network also is compared to
Assessment of Models to Estimate Bus-Stop Level Transit Ridership using Spatial Modeling Methods
 Assessment of Models to Estimate Bus-Stop Level Transit Ridership using Spatial Modeling Methods Assessment of Models to Estimate Bus-Stop Level Transit Ridership using Spatial Modeling Methods Srinivas
C) Discuss two factors that are contributing to the rapid geographical shifts in urbanization on a global scale.
 Discuss two factors that are contributing to the rapid geographical shifts in urbanization on a global scale.") AP Human Geography Unit VII. Cities and Urban Land Use Free Response Questions FRQ 1 Rapid urbanization in Least Developed Countries (LDCs) has many profound impacts for the world. Answer the following
AP Human Geography Unit VII. Cities and Urban Land Use Free Response Questions FRQ 1 Rapid urbanization in Least Developed Countries (LDCs) has many profound impacts for the world. Answer the following
CIV3703 Transport Engineering. Module 2 Transport Modelling
 CIV3703 Transport Engineering Module Transport Modelling Objectives Upon successful completion of this module you should be able to: carry out trip generation calculations using linear regression and category
Density and Walkable Communities
 Density and Walkable Communities Reid Ewing Professor & Chair City and Metropolitan Planning University of Utah ewing@arch.utah.edu Department of City & Metropolitan Planning, University of Utah MRC Research
Technical Memorandum #2 Future Conditions
 Technical Memorandum #2 Future Conditions To: Dan Farnsworth Transportation Planner Fargo-Moorhead Metro Council of Governments From: Rick Gunderson, PE Josh Hinds PE, PTOE Houston Engineering, Inc. Subject:
FHWA Planning Data Resources: Census Data Planning Products (CTPP) HEPGIS Interactive Mapping Portal
 HEPGIS Interactive Mapping Portal") FHWA Planning Data Resources: Census Data Planning Products (CTPP) HEPGIS Interactive Mapping Portal Jeremy Raw, P.E. FHWA, Office of Planning, Systems Planning and Analysis August 2017 Outline Census
FHWA Planning Data Resources: Census Data Planning Products (CTPP) HEPGIS Interactive Mapping Portal Jeremy Raw, P.E. FHWA, Office of Planning, Systems Planning and Analysis August 2017 Outline Census
Foreword. Vision and Strategy
 GREATER MANCHESTER SPATIAL FRAMEWORK Friends of Walkden Station Consultation Response January 2017 Foreword Friends of Walkden Station are a group of dedicated volunteers seeking to raise the status and
Neighborhood Locations and Amenities
 University of Maryland School of Architecture, Planning and Preservation Fall, 2014 Neighborhood Locations and Amenities Authors: Cole Greene Jacob Johnson Maha Tariq Under the Supervision of: Dr. Chao
MULTIPLE CHOICE. Choose the one alternative that best completes the statement or answers the question.
 AP Test 13 Review Name MULTIPLE CHOICE. Choose the one alternative that best completes the statement or answers the question. 1) Compared to the United States, poor families in European cities are more
Knowledge claims in planning documents on land use and transport infrastructure impacts
 Knowledge claims in planning documents on land use and transport infrastructure impacts Presentation at the Final Workshop of the research project "Innovations for sustainable public transport in Nordic
Effects of a non-motorized transport infrastructure development in the Bucharest metropolitan area
 The Sustainable City IV: Urban Regeneration and Sustainability 589 Effects of a non-motorized transport infrastructure development in the Bucharest metropolitan area M. Popa, S. Raicu, D. Costescu & F.
2040 MTP and CTP Socioeconomic Data
 SE Data 6-1 24 MTP and CTP Socioeconomic Data Purpose of Socioeconomic Data The socioeconomic data (SE Data) shows the location of the population and employment, median household income and other demographic
Impact of Metropolitan-level Built Environment on Travel Behavior
 Impact of Metropolitan-level Built Environment on Travel Behavior Arefeh Nasri 1 and Lei Zhang 2,* 1. Graduate Research Assistant; 2. Assistant Professor (*Corresponding Author) Department of Civil and
Traffic Demand Forecast
 Chapter 5 Traffic Demand Forecast One of the important objectives of traffic demand forecast in a transportation master plan study is to examine the concepts and policies in proposed plans by numerically
A Comprehensive Method for Identifying Optimal Areas for Supermarket Development. TRF Policy Solutions April 28, 2011
 A Comprehensive Method for Identifying Optimal Areas for Supermarket Development TRF Policy Solutions April 28, 2011 Profile of TRF The Reinvestment Fund builds wealth and opportunity for lowwealth communities
FOR LEASE LA BREA CROSSING N. La Brea Ave.
 CLASS A OFFICE BUILDINGS LOCATED 1 MILE FROM HOLLYWOOD PARK FOOTBALL STADIUM FOR LEASE CROSSING 101 111 N. La Brea Ave. Inglewood, California PROPERTY HIGHLIGHTS Close Proximity to Crenshaw/LAX Metro Stop
Prepared for: San Diego Association Of Governments 401 B Street, Suite 800 San Diego, California 92101
 Activity-Based Travel Model Validation for 2012 Using Series 13 Data: Coordinated Travel Regional Activity Based Modeling Platform (CT-RAMP) for San Diego County Prepared for: San Diego Association Of
City of Hermosa Beach Beach Access and Parking Study. Submitted by. 600 Wilshire Blvd., Suite 1050 Los Angeles, CA
 City of Hermosa Beach Beach Access and Parking Study Submitted by 600 Wilshire Blvd., Suite 1050 Los Angeles, CA 90017 213.261.3050 January 2015 TABLE OF CONTENTS Introduction to the Beach Access and Parking
King City URA 6D Concept Plan
 King City URA 6D Concept Plan King City s Evolution Among the fastest growing cities 2000 Census 1,949 2010 Census 3,111 60% increase 2016 Census estimate 3,817 23% increase Average annual rate 4.3% Surpassing
Spatiotemporal Analysis of Commuting Patterns in Southern California Using ACS PUMS, CTPP and LODES
 Spatiotemporal Analysis of Commuting Patterns in Southern California Using ACS PUMS, CTPP and LODES 2017 ACS Data Users Conference May 11-12, 2017 Alexandria, VA Jung Seo, Tom Vo, Frank Wen and Simon Choi
Typical information required from the data collection can be grouped into four categories, enumerated as below.
 Chapter 6 Data Collection 6.1 Overview The four-stage modeling, an important tool for forecasting future demand and performance of a transportation system, was developed for evaluating large-scale infrastructure
APPENDIX D.1 TRANSPORTATION: RIDERSHIP MODELING
 APPENDIX D.1 TRANSPORTATION: RIDERSHIP MODELING Appendix D.1: Transportation Ridership Modeling A. INTRODUCTION This Appendix describes the ridership forecasting methodology used by New York City Transit
Transit Time Shed Analyzing Accessibility to Employment and Services
 Transit Time Shed Analyzing Accessibility to Employment and Services presented by Ammar Naji, Liz Thompson and Abdulnaser Arafat Shimberg Center for Housing Studies at the University of Florida www.shimberg.ufl.edu
Can Public Transport Infrastructure Relieve Spatial Mismatch?
 Can Public Transport Infrastructure Relieve Spatial Mismatch? Evidence from Recent Light Rail Extensions Kilian Heilmann University of California San Diego April 20, 2015 Motivation Paradox: Even though
Leveraging Urban Mobility Strategies to Improve Accessibility and Productivity of Cities
 Leveraging Urban Mobility Strategies to Improve Accessibility and Productivity of Cities Aiga Stokenberga World Bank GPSC African Regional Workshop May 15, 2018 Roadmap 1. Africa s urbanization and its
Regional Transit Development Plan Strategic Corridors Analysis. Employment Access and Commuting Patterns Analysis. (Draft)
") Regional Transit Development Plan Strategic Corridors Analysis Employment Access and Commuting Patterns Analysis (Draft) April 2010 Contents 1.0 INTRODUCTION... 4 1.1 Overview and Data Sources... 4 1.2
Regional Transit Development Plan Strategic Corridors Analysis Employment Access and Commuting Patterns Analysis (Draft) April 2010 Contents 1.0 INTRODUCTION... 4 1.1 Overview and Data Sources... 4 1.2
The Built Environment, Car Ownership, and Travel Behavior in Seoul
 The Built Environment, Car Ownership, and Travel Behavior in Seoul Sang-Kyu Cho, Ph D. Candidate So-Ra Baek, Master Course Student Seoul National University Abstract Although the idea of integrating land
Case Study: Orange County, California. Overview. Context
 Case Study: Orange County, California Overview The Orange County Transportation Authority (OCTA) provides transit service in a generally automobile-oriented part of southern California. Consequently, OCTA
Study Overview. the nassau hub study. The Nassau Hub
 Livable Communities through Sustainable Transportation the nassau hub study AlternativeS analysis / environmental impact statement The Nassau Hub Study Overview Nassau County has initiated the preparation
Shall we Dense?: Policy Potentials. Summary. Simon McPherson Director SJB Urban Australia au
 Shall we dense? Shall we Dense?: Policy Potentials Simon McPherson Director SJB Urban Australia smcpherson@sjb.com. au Adam Haddow Director SJB Architects Australia ahaddow@sjb.com.au Summary This paper
VALIDATING THE RELATIONSHIP BETWEEN URBAN FORM AND TRAVEL BEHAVIOR WITH VEHICLE MILES TRAVELLED. A Thesis RAJANESH KAKUMANI
 VALIDATING THE RELATIONSHIP BETWEEN URBAN FORM AND TRAVEL BEHAVIOR WITH VEHICLE MILES TRAVELLED A Thesis by RAJANESH KAKUMANI Submitted to the Office of Graduate Studies of Texas A&M University in partial
Key Issue 1: Why Do Services Cluster Downtown?
 Key Issue 1: Why Do Services Cluster Downtown? Pages 460-465 1. Define the term CBD in one word. 2. List four characteristics of a typical CBD. Using your knowledge of services from chapter 12, define
Estimating Transportation Demand, Part 2
 Transportation Decision-making Principles of Project Evaluation and Programming Estimating Transportation Demand, Part 2 K. C. Sinha and S. Labi Purdue University School of Civil Engineering 1 Estimating
WOODRUFF ROAD CORRIDOR ORIGIN-DESTINATION ANALYSIS
 2018 WOODRUFF ROAD CORRIDOR ORIGIN-DESTINATION ANALYSIS Introduction Woodruff Road is the main road to and through the commercial area in Greenville, South Carolina. Businesses along the corridor have
Growth Management: Analysis of Comments Received and Responses Comments received as of October 16, 2017
 Growth Management: Analysis of Comments Received and s Comments received as of October 16, Comments informing the Region of Peel s growth management work have been summarized with responses below. These
Spatial and Socioeconomic Analysis of Commuting Patterns in Southern California Using LODES, CTPP, and ACS PUMS
 Spatial and Socioeconomic Analysis of Commuting Patterns in Southern California Using LODES, CTPP, and ACS PUMS Census for Transportation Planning Subcommittee meeting TRB 95th Annual Meeting January 11,
MOR CO Analysis of future residential and mobility costs for private households in Munich Region
 MOR CO Analysis of future residential and mobility costs for private households in Munich Region The amount of the household budget spent on mobility is rising dramatically. While residential costs can
Identifying Inaccessible Areas with Potential to Enhance Transit Market
 Identifying Inaccessible Areas with Potential to Enhance Transit Market Srinivas S. Pulugurtha, Venkata Ramana Duddu, Rakesh Mora The University of North Carolina at Charlotte Abstract The focus of this
Data Collection. Lecture Notes in Transportation Systems Engineering. Prof. Tom V. Mathew. 1 Overview 1
 Data Collection Lecture Notes in Transportation Systems Engineering Prof. Tom V. Mathew Contents 1 Overview 1 2 Survey design 2 2.1 Information needed................................. 2 2.2 Study area.....................................
GIS BASED ANALYSIS OF EXPRESS VS LOCAL STATIONS ON SURROUNDING LAND USES IN NEW YORK CITY
 GIS BASED ANALYSIS OF EXPRESS VS LOCAL STATIONS ON SURROUNDING LAND USES IN NEW YORK CITY GIS in Transit Conference, Washington D.C Date: September 2, 2015 1 Subrina Rahman Supervised by Dr. Candace Brakewood
Regional Snapshot Series: Transportation and Transit. Commuting and Places of Work in the Fraser Valley Regional District
 Regional Snapshot Series: Transportation and Transit Commuting and Places of Work in the Fraser Valley Regional District TABLE OF CONTENTS Complete Communities Daily Trips Live/Work Ratio Commuting Local
Environmental Analysis, Chapter 4 Consequences, and Mitigation
 Environmental Analysis, Chapter 4 4.17 Environmental Justice This section summarizes the potential impacts described in Chapter 3, Transportation Impacts and Mitigation, and other sections of Chapter 4,
THE LEGACY OF DUBLIN S HOUSING BOOM AND THE IMPACT ON COMMUTING
 Proceedings ITRN2014 4-5th September, Caulfield and Ahern: The Legacy of Dublin s housing boom and the impact on commuting THE LEGACY OF DUBLIN S HOUSING BOOM AND THE IMPACT ON COMMUTING Brian Caulfield
Spatiotemporal Analysis of Commuting Patterns: Using ArcGIS and Big Data
 Spatiotemporal Analysis of Commuting Patterns: Using ArcGIS and Big Data 2017 ESRI User Conference July 13, 2017 San Diego, VA Jung Seo, Tom Vo, Frank Wen and Simon Choi Research & Analysis Southern California
Equity, Accessibility and Transit Use in large American cities
 Equity, Accessibility and Transit Use in large American cities Submitted: 1 August 2004 Word Count: 4600 + 1500 = 6100 Murtaza Haider, Ph.D. McGill University, School of Urban Planning 815 Sherbrooke St.
Monmouth County Adam Nassr (Partner: Brian Berkowitz, Ocean County)
") Monmouth County Adam Nassr (Partner: Brian Berkowitz, Ocean County) 1. County Summary Monmouth County, founded in 1675, is the northernmost county along the Jersey Shore in the state of New Jersey. It
Monmouth County Adam Nassr (Partner: Brian Berkowitz, Ocean County) 1. County Summary Monmouth County, founded in 1675, is the northernmost county along the Jersey Shore in the state of New Jersey. It
Susan Clark NRS 509 Nov. 29, 2005
 Susan Clark NRS 509 Nov. 29, 2005 The original intent of this project was to look at the role of GIS in the inventory of bicycle and pedestrian facilities. The research, however, indicates a different
Subject: Note on spatial issues in Urban South Africa From: Alain Bertaud Date: Oct 7, A. Spatial issues
 Page 1 of 6 Subject: Note on spatial issues in Urban South Africa From: Alain Bertaud Date: Oct 7, 2009 A. Spatial issues 1. Spatial issues and the South African economy Spatial concentration of economic
Geodatabase for Sustainable Urban Development. Presented By Rhonda Maronn Maurice Johns Daniel Ashney Jack Anliker
 Geodatabase for Sustainable Urban Development Presented By Rhonda Maronn Maurice Johns Daniel Ashney Jack Anliker Objective Build a Geodatabase that will enable urban planners to create and assess the
GIS Lecture 5: Spatial Data
 GIS Lecture 5: Spatial Data GIS 1 Outline Vector Data Formats Raster Data Formats Map Projections Coordinate Systems US Census geographic files US Census data files GIS Data Sources GIS 2 Vector Data Formats
Key Issue 1: Why Do Services Cluster Downtown?
 Key Issue 1: Why Do Services Cluster Downtown? Pages 460-465 ***Always keep your key term packet out whenever you take notes from Rubenstein. As the terms come up in the text, think through the significance
Identifying transit deserts in major Texas cities where the supplies missed the demands
 THE JOURNAL OF TRANSPORT AND LAND USE http://jtlu.org VOL. 10 NO. 1 [2017] pp. 529 540 Identifying transit deserts in major Texas cities where the supplies missed the demands Junfeng Jiao The University
A Micro-Analysis of Accessibility and Travel Behavior of a Small Sized Indian City: A Case Study of Agartala
 A Micro-Analysis of Accessibility and Travel Behavior of a Small Sized Indian City: A Case Study of Agartala Moumita Saha #1, ParthaPratim Sarkar #2,Joyanta Pal #3 #1 Ex-Post graduate student, Department
GIS-Based Analysis of the Commuting Behavior and the Relationship between Commuting and Urban Form
 GIS-Based Analysis of the Commuting Behavior and the Relationship between Commuting and Urban Form 1. Abstract A prevailing view in the commuting is that commuting would reconstruct the urban form. By
Data driven approaches to Urban Planning Experience from Derry/Londonderry
 Data driven approaches to Urban Planning Experience from Derry/Londonderry Anna Rose RTPI Belfast 11 th of September 1 June 26 07:47AM 2 The value of the City The space of the city is a theatre: playing
São Paulo Metropolis and Macrometropolis - territories and dynamics of a recent urban transition
 São Paulo Metropolis and Macrometropolis - territories and dynamics of a recent urban transition Faculty of Architecture and Urbanism of São Paulo University Prof. Dr. Regina M. Prosperi Meyer WC2 - World
Urban Form and Travel Behavior:
 Urban Form and Travel Behavior: Experience from a Nordic Context! Presentation at the World Symposium on Transport and Land Use Research (WSTLUR), July 28, 2011 in Whistler, Canada! Petter Næss! Professor
Public Transport Versus Private Car: GIS-Based Estimation of Accessibility Applied to the Tel Aviv Metropolitan Area
 Public Transport Versus Private Car: GIS-Based Estimation of Accessibility Applied to the Tel Aviv Metropolitan Area Itzhak Benenson 1, Karel Martens 3, Yodan Rofe 2, Ariela Kwartler 1 1 Dept of Geography
Development of modal split modeling for Chennai
 IJMTES International Journal of Modern Trends in Engineering and Science ISSN: 8- Development of modal split modeling for Chennai Mr.S.Loganayagan Dr.G.Umadevi (Department of Civil Engineering, Bannari
The CRP stresses a number of factors that point to both our changing demographics and our future opportunities with recommendations for:
 Plan Overview The CRP represents the first broad planning initiative covering Lake, Porter and LaPorte counties. Unlike previous plans released by NIRPC, which focused primarily on transportation, the
Forecasts from the Strategy Planning Model
 Forecasts from the Strategy Planning Model Appendix A A12.1 As reported in Chapter 4, we used the Greater Manchester Strategy Planning Model (SPM) to test our long-term transport strategy. A12.2 The origins
Impressive Growth & Relaxed Elegance.
 Impressive Growth & Relaxed Elegance www.culpeperva.org About Culpeper Nestled between Charlottesville and the District of Columbia, Culpeper is a hub of commerce and culture proud to be home to a broad
Smart Growth: Threat to the Quality of Life. Experience
 Smart Growth: Threat to the Quality of Life Presentation by Wendell Cox Wendell Cox Consultancy Visiting Professor Conservatoire National des Arts et Metiers Paris Frontier Centre for Public Policy Winnipeg
How is public transport performing in Australia
 How is public transport performing in Australia CILTA Moving People Thursday 17 March 2011 Professor Corinne Mulley Institute of Transport and Logistics Studies Outline Measuring performance Australia
Transit Service Gap Technical Documentation
 Transit Service Gap Technical Documentation Introduction This document is an accompaniment to the AllTransit TM transit gap methods document. It is a detailed explanation of the process used to develop
Service Area Analysis of Portland's METRO Bus System. Andy Smith-Petersen, University of Southern Maine -
 Andy Smith-Petersen, University of Southern Maine - andysp@usm.maine.edu METRO Background 8 routes serving Portland, South Portland, Falmouth and Westbrook 100,000+ passengers/month, +11% 1997-2005 (GPCOG/METRO,
Mind the Gap: Transit Need Analysis
 Mind the Gap: Transit Need Analysis Introduction Transit Propensity a measure of demographics that indicate the propensity for people in a given area to use transit GIS: heat maps Emphasizes the transit
CLAREMONT MASTER PLAN 2017: LAND USE COMMUNITY INPUT
 Planning and Development Department 14 North Street Claremont, New Hampshire 03743 Ph: (603) 542-7008 Fax: (603) 542-7033 Email: cityplanner@claremontnh.com www.claremontnh.com CLAREMONT MASTER PLAN 2017:
Analysis and Design of Urban Transportation Network for Pyi Gyi Ta Gon Township PHOO PWINT ZAN 1, DR. NILAR AYE 2
 www.semargroup.org, www.ijsetr.com ISSN 2319-8885 Vol.03,Issue.10 May-2014, Pages:2058-2063 Analysis and Design of Urban Transportation Network for Pyi Gyi Ta Gon Township PHOO PWINT ZAN 1, DR. NILAR AYE
Chao Liu, Ting Ma, and Sevgi Erdogan National Center for Smart Growth Research & Education (NCSG) University of Maryland, College Park
 University of Maryland, College Park") Chao Liu, Ting Ma, and Sevgi Erdogan National Center for Smart Growth Research & Education (NCSG) University of Maryland, College Park 2015 GIS in Transit, September 1-3, 2015 Shared-use Vehicle Services
Chao Liu, Ting Ma, and Sevgi Erdogan National Center for Smart Growth Research & Education (NCSG) University of Maryland, College Park 2015 GIS in Transit, September 1-3, 2015 Shared-use Vehicle Services
River North Multi-Modal Transit Analysis
 River North Multi-Modal Transit Analysis November 7, 2006 Dan Meyers, AICP URS Corporation 612-373-6446 / dan_meyers@urscorp.com River North Study Area Reasons for initiating the study Downtown areas north
The sustainable location of low-income housing development in South African urban areas
 Sustainable Development and Planning II, Vol. 2 1165 The sustainable location of low-income housing development in South African urban areas S. Biermann CSIR Building and Construction Technology Abstract
The effects of impact fees on urban form and congestion in Florida
 The effects of impact fees on urban form and congestion in Florida Principal Investigators: Andres G. Blanco Ruth Steiner Presenters: Hyungchul Chung Jeongseob Kim Urban and Regional Planning Contents
Measuring Disaster Risk for Urban areas in Asia-Pacific
 Measuring Disaster Risk for Urban areas in Asia-Pacific Acknowledgement: Trevor Clifford, Intl Consultant 1 SDG 11 Make cities and human settlements inclusive, safe, resilient and sustainable 11.1: By
Advancing Urban Models in the 21 st Century. Jeff Tayman Lecturer, Dept. of Economics University of California, San Diego
 Advancing Urban Models in the 21 st Century Jeff Tayman Lecturer, Dept. of Economics University of California, San Diego 1 Regional Decision System Better tools Better data Better access Better Decisions