EMS Hot Spot Analysis:
|
|
|
- Evelyn Johns
- 6 years ago
- Views:
Transcription

1 EMS Hot Spot Analysis: James Moy, Nika Ofori-Atta, Holly Simmons, Samantha Sperber Under the supervision of Professor Chao Liu URSP 688L: Planning Technologies The University of Maryland College Park December 18, 2016 PALS - Partnership for Action Learning in Sustainability
2 An initiative of the National Center for Smart Growth Gerrit Knaap, NCSG Executive Director Uri Avin, PALS Director 1
3 Contents Introduction 02 Executive Summary 03 Background and Problem Area 03 Primary Research Questions 04 Methodology 05 Variables 05 Methods 06 Limitations of the Data 08 Natural Breaks 08 Map Results PM1 Incidents PM2 Incidents Heat Map over Land Use Heat Map over Population Heat Map over Senior Population 15 EMS Hot Spot Analysis 16 Conclusions 16 Interpretations of the Results 16 Limitations of the Study 17 Future Directions 17 References 18 Team Contributions 19 Appendix A - List of Maps Produced 20 Appendix B - Complete Set of Maps (2015) 21 Appendix C - Map-Making Guide 26 2
 Emergency Medical Services (EMS) division responds to a wide range of emergencies experienced by the county s more than 500,000 residents.")
4 URSP 688L PLANNING TECHNOLOGY FINAL REPORT: EMS HOT SPOT ANALYSIS Partnership for Action Learning in Sustainability Anne Arundel County Introduction Effective emergency services are vital to public safety. The Anne Arundel County (AAC) Emergency Medical Services (EMS) division responds to a wide range of emergencies experienced by the county s more than 500,000 residents. In this report, we analyze emergency service dispatch records. We focus primarily on EMS dispatches for life-threatening incidents (those requiring Advanced Life Support-Paramedic responses) occurring during peak traffic hours (07:00-20:00). By identifying spatial and temporal patterns reflected in the data, we aim to assist the AAC Fire Department in effectively providing emergency services to the population. Executive Summary 3
5 This report attempts to identify the locations of the most life-threatening EMS incidents, patterns indicated by data analysis by time of day/day of the week, and potential underlying causes of EMS incidents. We found that the highest concentrations of dispatch calls were in the northcentral part of the county, in and around Annapolis, and in residential areas where some senior citizens live. Our recommendation is that the county can incorporate the ArcGIS Network Analyst tool to analyze transportation routes and response times. This will help identify ways to optimize emergency resources and improve overall effectiveness in providing emergency services to residents. Background and Problem Area Anne Arundel County (AAC) has a total area of 588 square miles, 415 square miles of which is land, and 173 square miles of which is water, according to the U.S. Census Bureau (U.S. Census, 2016). The county is bounded by the Chesapeake Bay to the east, the Patuxent River to the west, and portions of the Patapsco River that form the county s northern border. It shares borders with seven counties and the city of Baltimore. The county is due south of Baltimore City. Anne Arundel County is home to 564,195 residents, according to the 2015 American Community Survey estimate. This population is concentrated in the northern part of the county, and also in and around the state capitol, Annapolis, which lies on the western shore of the Chesapeake Bay. The southern part of the county is more rural and has a generally lower population density. The Anne Arundel County Fire Department consists of 31 fire stations (20 county-owned and 11 volunteer-owned) staffed by 550 volunteers and over 862 firefighters and Emergency Services (EMS) personnel (Schuh, S., et. al., 2015). Having evolved over the past 40 years from primarily a Basic Life Support (BLS) service, the county EMS system is now an Advanced Life Support (ALS) transport service supported by a few BLS transport units (ibid.). EMS response types include fire protection, BLS, ALS-Paramedic, hazardous materials, collapse, confined space, dive rescue and marine operations (ibid.). 4
6 Research Questions Through our research, we investigated the following questions: Where are most of the EMS incidents occurring? What patterns do the data indicate? Where are the most life-threatening EMS incidents occurring over years and during different times of day? Are there any possible underlying causes of life-threatening EMS incidents? GIS Methodology We acquired the primary EMS data from Anne Arundel County and supplementary data from both the county and the American Community Survey, via the United States (U.S.) Census Bureau, American FactFinder website. We used Microsoft Excel and ArcGIS software to manipulate the data and perform analyses. Variables Attributes of the EMS data include EMS incidents by year (2014, 2015, and 2016), dates of occurrence (by month/day/year), times of occurrence (peak 1 and non-peak 2 traffic hours), and type of ALS response (PM1 3 and PM2 4 ). The non-ems variables used include fire company (the coverage areas of each fire station) and the land use/cover for the year Data from the American Community Survey included block groups (boundaries defined by the U.S. Census), along with estimates of both general population (the total number of people living in each block group) and senior households (the total number of households with people 60 years or older in each block group). Using different combinations of these variables, we produced maps reflecting: EMS incidents by type alone: PM1 and PM2 [by fire company] 1 Peak hours are defined as 07:00-20:00. 2 Non-Peak hours are defined as 00:00-06:00 & 21:00-23:00. 3 PM1 responses are categorized as responses that require only one ALS (advanced life support) provider. 4 PM2 responses are categorized as responses that require two ALS (advanced life support) providers. 5
7 EMS incidents by type and time of day: peak (07:00-20:00) and non-peak (00:00-06:00 and 21:00-23:00) [by fire company] EMS incidents during peak hours by type (PM1 and PM2) and day of the week [by fire company] Heat maps of EMS incidents during peak hours by type overlaid on land use and census data (population and senior households by block group) Methods The following summary outlines the main processes in making the maps for each year from 2014 to For step-by-step methods, see Appendix C. First, we prepared the data. With Microsoft Excel, we created time of day files categorizing EMS incident occurrences by the time of day (peak vs. non-peak) and the day of the week. With ArcGIS, we joined the EMS incident data to the Time of Day files. We then re-projected all the necessary files into NAD_1983_HARN_StatePlane_Maryland_FIPS_1900_Feet. We then created multiple sets of maps using increasingly specific combinations of variables. We performed query searches to select for: Only either PM1 or PM2 incidents (resulting in two maps per year) PM1 or PM2 incidents and peak or non-peak time of day (resulting in maps by type and time of day (resulting in four maps per year) Peak time of day and PM1 or PM2 incidents and day of the week (resulting in 14 maps per year) After each query search, we spatially joined the selected incident data to the fire company boundaries. We symbolized the number of incidents by fire company into five classes using natural breaks in the data and a high-low color ramp. We also created maps of land use/cover, population by block group, and senior households by block group. For the land use/cover map, we grouped like-types of land uses for better visualization and symbolized the data by type in ArcGIS. For both population maps, we joined the population data to the block group data and symbolized each using natural breaks into five classes, using a high-low color ramp. 6
8 We created heat maps (a graphic representation of data showing varying degrees of a single metric in varied colors) of EMS Incidents during peak hours by type for each year. Using the previously created maps of EMS incidents by type (PM1 and PM2) and peak time of day, we used the Kernel Density tool (an ArcGIS tool that calculates the density of features in the area around those features) to produce heat maps showing concentrations of incidences. We excluded the lowest class from the resulting five classes of expected density and made the heat maps 40% transparent. Finally, we overlaid the heat maps onto the land use/cover, population by block group, and senior households by block group maps. This resulted in six heat map overlays per year. Limitations of the Data The main limitations of the data result from the inclusion of year 2016 in the analysis. Because we began the analysis in September 2016, the incident data set is incomplete. It contains data from January 1 to August 30, about two-thirds of the year. This resulted in a smaller sample size for comparison with the complete data for 2014 and It also introduces the potential for difference trends, resulting from seasonal variations in EMS incidents. Additionally, we created all population overlay maps using 2014 ACS 5-year population estimates, because more recent years were unavailable. County-provided data on land use/cover is also from Natural Breaks In creating maps, we classified all incident data using natural breaks (also called the Jenks optimization method), which reflects the natural clustering of EMS incident data points. While this is the most effective way to symbolize breaks in the data in each map, the use of natural breaks can create complications when comparing maps. 7
9 Map Results The following maps are a sample of all the maps produced (over 70 maps). For the complete set of maps for 2015, see Appendix B. In comparing maps across years and within years, it is important to remember that natural breaks in incident data were used throughout. Because of this, we interpret the maps as snapshots of each year, rather than representations of trends PM1 Incidents 8
10 In comparing all three years of PM1 incidents, 2014 and 2015 exhibit similar patterns while 2016 looks slightly dissimilar. This could be a result of partial data for Glen Burnie consistently has a high concentration of incidents, but shifts do occur in the fire companies around Glen Burnie. Over the three years, we see levels of concentration decrease from the northwest of Glen Burnie and increase to the east and southwest of Glen Burnie. We also see the proportion of incidents increase in and around Annapolis over time. 9
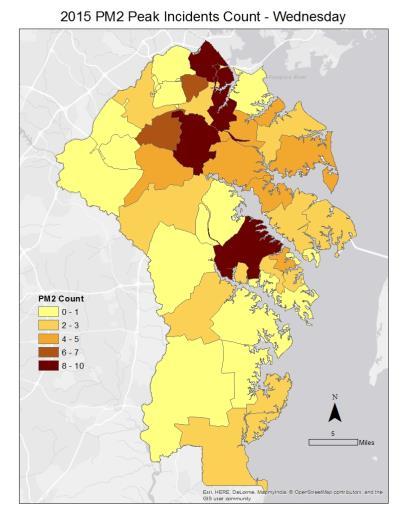
11 PM2 Incidents 10
12 The maps of PM2 incidents from 2014 to 2016 reveal incident concentrations toward the north of central Anne Arundel County. Concentrations of incidents exist in and around Glen Burnie, and 11
13 shifts in this concentration occur from the southwest of Glen Burnie to the northeast over the three years. A comparison of the first two sets of maps (PM1 and PM2) shows that although PM2 incidents are more severe, total counts of PM1 incident by fire company tend to be higher. The PM2 incident by fire company maximum is 114, as opposed to a PM1 incident maximum of 2,058. This finding could affect resource allocation Heat Map over Land Use 12
14 2015 Heat Map over Population 13
15 2015 Heat Map over Senior Households 14
16 15
17 EMS Hot Spot Analysis This part of the analysis focuses on land use, population, and senior households to identify possible underlying causes of life-threatening EMS incidents. The areas where incident densities occurred between PM1 and PM2 varied only slightly. Based on the land use and heat maps, we concluded that most incidences occurred either in residential or commercial areas. On the map showing general population, we found that areas with higher population densities had a higher incident rate. The senior households by block group maps indicate that many seniors live in rural areas. In addition, since some seniors live in the north and east areas where most of the incidents occur, they do contribute to some of those incidents. Conclusions Interpretations of the Results The highest concentrations of incidents occurred primarily in the north-central area near Glen Burnie, and also in and around Annapolis. Over the three years of data analyzed, there was only a slight shift in incident areas. We note that most incidents occurred in high population residential areas. Limitations of the Study The most significant limitations of the study resulted from inherent limitations in the data. Because the 2016 EMS incidents data was incomplete, it was hard to see any type of significant trends over the three years. Another limitation was the availability of data from the U.S. Census estimates were the only population data available. This detracted from the accuracy of the 2015 and 2016 population overlay maps and impacted our ability to analyze any possible correlations between shifts in incident count and shifts in population density over the three years. Future Directions We propose to use the Network Analysis tool in ArcGIS to analyze transportation routes and response times. This will help the county optimize emergency resources. 16
18 17
19 References Schuh, S., Graves, A., Blair, J., Serich, M. et. al. (2015). Emergency Medical Services and Suppression Deployment Study. Anne Arundel County Fire Department. U.S. Census. (2016). The United States Census Bureau. Tiger Shapefiles. Retrieved from U.S. Census. (2016). The United States Census Bureau. Quick Facts: Anne Arundel County, Maryland. Retrieved from 18
20 Team Contributions Group Effort - map creation, analysis and pattern discussion, presentation and final report James Moy - project manager, map guidelines, presented at PALS event in Annapolis, MD Nika Ofori Atta - EMS map creation (2016), data interpretation Samantha Sperber - EMS map creation (2015), data interpretation Holly Simmons - EMS map creation (2014), standardized map exports to JPEG for final presentation and report 19
21 Appendix A - List of Maps Produced for years 2014, 2015, and 2016 MAPS 1 EMS Incidents: Peak [by Fire Company] EMS Incidents: Non-Peak [by Fire Company] MAPS 2 EMS Incidents: PM1 [by Fire Company] EMS Incidents: PM2 [by Fire Company] MAPS 3 EMS Incidents: PM1 - PEAK [by Fire Company] EMS Incidents: PM1 - NONPEAK [by Fire Company] EMS Incidents: PM2 - PEAK [by Fire Company] EMS Incidents: PM2 - NONPEAK [by Fire Company] MAPS 4 EMS Incidents: PM1 - PEAK - MON [by Fire Company] EMS Incidents: PM1 - PEAK - TUE [by Fire Company] EMS Incidents: PM1 - PEAK - WED [by Fire Company] EMS Incidents: PM1 - PEAK - THU [by Fire Company] EMS Incidents: PM1 - PEAK - FRI [by Fire Company] EMS Incidents: PM1 - PEAK - SAT [by Fire Company] EMS Incidents: PM1 - PEAK - SUN [by Fire Company] EMS Incidents: PM2 - PEAK - MON [by Fire Company] EMS Incidents: PM2 - PEAK - TUE [by Fire Company] EMS Incidents: PM2 - PEAK - WED [by Fire Company] EMS Incidents: PM2 - PEAK - THU [by Fire Company] EMS Incidents: PM2 - PEAK - FRI [by Fire Company] EMS Incidents: PM2 - PEAK - SAT [by Fire Company] EMS Incidents: PM2 - PEAK - SUN [by Fire Company] MAPS 5 Population [by Block Group] Senior Households [by Block Group] Land Use/Cover Map 20
![MAPS 6 HEAT MAPS of MAPS 2 EMS Incidents: HEAT MAP - PM1 - PEAK [by Fire Company] EMS](/docs-images/73/69480563/images/22-0.jpg "Incidents: HEAT MAP - PM2 - PEAK [by Fire Company] Appendix B - Complete Set of Maps")
22 MAPS 6 HEAT MAPS of MAPS 2 EMS Incidents: HEAT MAP - PM1 - PEAK [by Fire Company] EMS Incidents: HEAT MAP - PM2 - PEAK [by Fire Company] Appendix B - Complete Set of Maps (2015) 21
23 22

24 23

25 24
26 25
27 Appendix C - Map-Making Guide URSP688L - Method for EMS Hotspot Analysis (AAC) Maps Preparation of Data Part P-1: Projecting Fire Companies 1. ArcMap -> ArcToolbox -> Data Management Tools -> Projections and Transformations -> Project: a. Input Dataset: Click on the folder button and find the Fire Companies file from the EMS geodatabase b. Output Dataset: Click on the folder button, and choose where you want to save the new file. Also, choose what you want to name it. c. Output Coordinate System: Click on the button, click on the Add Coordinate System button (looks like a globe and is near the search bar). Choose Import, and find the Incidents file (inside the geodatabase file) that you are planning to work with. The projected coordinate system should be: NAD_1983_HARN_StatePlane_Maryland_FIPS_1900_Feet ***Now, we have a layer containing the projected Fire Companies (boundaries) Part P-2: Joining Incidents to the Time of Day (ToD) files 1. Load into ArcMap an EMS Incident file 2. Load into ArcMap an EMS ToD file of the same year (Use Sheet2$) 3. Right-click the Incident layer -> Joins and Relates -> Join: a. Click the drop-down button and select: Join attributes from a table b. Choose the field: incident_n c. Click the drop-down button and select the ToD layer (Use Sheet2$) d. Choose the field: incident_n e. Choose: Keep all records f. Click OK 26
28 g. Right-click the Incident layer, and open the attribute table to check the Join ***Now, we have our Incident points joined to the ToD table Map 1: EMS Incidents By Type (PM1 vs PM2) [By Fire Company] Part 1-1: Displaying Incidents By Type (PM1 vs PM2) 1. Right-click the Incidents (joined with ToD) layer -> Copy 2. Right-click on Layers -> Paste 2 Times (***This made a copy of the joined layer - This can be done any number of times, and you may want to turn off the layers as you work with them.) 3. Rename copied Incidents layer (***Type: PM1, PM2) 4. Right-click a renamed Incidents layer -> Properties -> Definition Query tab -> Query Builder button -> "dispatch_c" = 'PM1' (This is an example) -> Click OK twice 5. Repeat Step 4 for each renamed layer, and change query based on focus. For example, instead of PM1, use PM2 ***Now, we have 2 layers, each based on different Incidents by Type: PM1 and PM2 Part 1-2: Spatial Joining Fire Companies to Incidents 1. Right-click the projected Fire Companies layer -> Joins and Relates -> Join: a. Click the drop-down button and select: Join data from another layer based on spatial location b. Choose the layer: A renamed Incident file that you used a definition query for to choose a certain type c. Output: Choose where you want to save the output, and what you want to name it d. ***Note: The processing may take a few minutes (up to about 15 min.) e. Right-click the Incident layer, and open the attribute table to check the Join f. ***Note: There should be a Count_ field at the end of the table. 27
29 ***Now, we have a file with Fire Companies spatially joined to the Incidents layer, and the number of incidents of a certain type within each Fire Company Part 1-3: Symbolizing Incidents by Type 1. Right-click the Joined Fire Companies layer -> Properties -> Symbology tab: a. Click Quantities b. Value: Count_ c. Click OK twice Map(s) 2: EMS Incidents By Type and Time of Day (PEAK vs NONPEAK) [By Fire Company] Part 2-1: Displaying Incidents By Type (PM1 vs PM2) and Time of Day (PEAK vs NONPEAK) 1. Right-click the Incidents (joined with ToD) layer -> Copy 2. Right-click on Layers -> Paste 4 times (***This can be done any number of times, and you may want to turn off the layers as you work with them.) 3. Rename copied Incidents layers (***Type: PM1, PM2; and ToD: PEAK, NONPEAK) 4. Right-click a renamed Incidents layer -> Properties -> Definition Query tab -> Query Builder button -> "dispatch_c" = 'PM1' AND "ToD" = 'PEAK' (This is an example) -> Click OK twice 5. Repeat Step 9 for each renamed layer, and change query based on focus. For example, Type could be like: "dispatch_c" = 'PM1' AND "ToD" = 'NONPEAK' ***Now, we have 4 layers, each based on different Incidents by Time of Day: PM1- PEAK, PM1-NONPEAK, PM2-PEAK, and PM2-NONPEAK Part 2-2: Spatial Joining Fire Companies to Incidents 1. Right-click the projected Fire Companies layer -> Joins and Relates -> Join: 28
30 a. Click the drop-down button and select: Join data from another layer based on spatial location b. Choose the layer: A renamed Incident file that you used a definition query for to choose a certain type and time of day c. Output: Choose where you want to save the output, and what you want to name it d. ***Note: The processing may take a few minutes (up to about 15 min.) e. Right-click the Incident layer, and open the attribute table to check the Join f. ***Note: There should be a Count_ field at the end of the table. ***Now that we have spatially joined the layers, we have a layer containing the number of incidents of a certain type and time of day 1. Repeat Step 1 for each type of Incident layer you used a definition query for Part 2-3: Symbolizing Incidents by Type and Time of Day 1. Right-click the Joined Fire Companies layer -> Properties -> Symbology tab: a. Click Quantities b. Value: Count_ c. Click OK twice Map(s) 3: EMS Incidents By Type and Time of Day (PEAK) and Day of the Week (MON to SUN) [By Fire Company] ***NOTE: Only the PEAK Time of Day is used... Part 3-1: Displaying Incidents By Type (PM1 vs PM2) and Time of Day (PEAK) and Day of the Week 1. Right-click the Incidents (joined with ToD) layer -> Copy 29
31 2. Right-click on Layers -> Paste 14 times (***This can be done any number of times, and you may want to turn off the layers as you work with them.) 3. Rename copied Incidents layers (***Types: PM1, PM2; and Time of Day: PEAK; and Day: MON, TUE, WED, THU, FRI, SAT, SUN) 4. Right-click a renamed Incidents layer -> Properties -> Definition Query tab -> Query Builder button -> "dispatch_c" = 'PM1' AND "ToD" = 'PEAK' AND "Day" = 'MON' (This is an example) -> Click OK twice 5. Repeat Step 4 for each renamed layer, and change query based on focus. For example, "dispatch_c" = 'PM2' AND "ToD" = 'PEAK' AND "Day" = 'MON' ***Now, we have 14 layers, each based on different types of Incidents: PM1-PEAK-MON PM1-PEAK-SUN, and PM2-PEAK-MON PM2-PEAK-SUN Part 3-2: Spatial Joining Fire Companies to Incidents 1. Right-click the projected Fire Companies layer -> Joins and Relates -> Join: a. Click the drop-down button and select: Join data from another layer based on spatial location b. Choose the layer: A renamed Incident file that you used a definition query for to choose a certain type and time of day c. Output: Choose where you want to save the output, and what you want to name it d. ***Note: The processing may take a few minutes (up to about 15 min.) e. Right-click the Incident layer, and open the attribute table to check the Join f. ***Note: There should be a Count_ field at the end of the table. ***Now that we have spatially joined the layers, we have a layer containing the number of incidents of a certain type and time of day 1. Repeat Step 1 for each type of Incident layer you used a definition query for Part 3-3: Symbolizing Incidents By Type and Time of Day and Day of the Week 30
32 1. Right-click the Joined Fire Companies layer -> Properties -> Symbology tab: a. Click Quantities b. Value: Count_ c. Click OK twice Map(s) 4: Maps of Other Data Part 4-1: Getting Block Groups for Anne Arundel County (AAC) 1. Go to the U.S. Census Tiger Line Site: (*** Note: If downloads are not working, site may be undergoing maintenance ***) 1. Choose the appropriate year (2014, 2015, 2016), and Block Groups -> Next 2. Choose: Maryland -> Download -> Extract files (un-zip) 3. ArcMap -> ArcToolbox -> Data Management Tools -> Projections and Transformations -> Project: a. Input Dataset: Click on the folder button and find the MD Block Groups file that you downloaded b. Output Dataset: Click on the folder button, and choose where you want to save the new file. Also, choose what you want to name it. c. Output Coordinate System: Click on the button, click on the Add Coordinate System button (looks like a globe and is near the search bar). Choose Import, and find the Incidents file (inside the geodatabase file) that you are planning to work with. The projected coordinate system should be: NAD_1983_HARN_StatePlane_Maryland_FIPS_1900_Feet 4. Repeat Step 4 for the Anne Arundel County (AAC) Boundary file from Dr. Liu s PALS Anne Arundel County GIS data. (*** Note: This step is optional if done once before. ***) 1. Load both projected files (MD Block Groups and AAC Boundary) into ArcMap. 2. In the Menu bar, click Geoprocessing -> Clip: 31
33 a. Input Feature: MD Block Groups file b. Clip Feature: AAC Boundary file c. Output Feature Class: Choose where you want to save the output, and what you want to name it 3. Turn off: MD Block Groups, and AAC Boundary layers ***Now, we have a layer containing AAC Block Groups Part 4-2: Getting (2014) Population Data For AAC Block Groups (***Note: The only available Population Totals data by Block Group was for 2014) (***Note: Data can be of any desired demographics, not just population) 1. Go to the U.S. Census American Fact Finder Site: (*** Note: If downloads are not working, site may be undergoing maintenance ***) 1. Choose: Guided Search -> Get Me Started 2. Choose: I'm looking for information about people -> Next 3. Choose: Basic Count/Estimate -> Population Total -> Next 4. Choose: Block Group -> Maryland -> Anne Arundel -> All Block Groups within Anne Arundel County, Maryland -> Add To Your Selection -> Next 5. Choose: Skip this step 6. Select: Total Population - B ACS 5-year estimates 7. Under Table View, click on Modify Table 8. Next to the first Estimate row, click the T -shaped button (Hovering over it should say Filter the table using values from this row ) -> check box next to Estimate -> OK 9. Click Download -> Uncheck box next to Include descriptive data element names -> OK -> Download -> Extract files (un-zip) 10. Open Excel (CSV) file -> Save as a new file (to copy the original), but save as a Excel file 11. Right-click on GEO.display-label column -> Delete 12. Right-click on GEO.id column -> Delete 13. Rename heading: HD01_VD01 -> Pop 32
34 14. Highlight all values under GEO.id2 -> Right-click -> Format Cells -> Number tab -> Category: Number -> Decimal Places: 0 -> OK 15. SAVE WORK!!! 16. ArcMap -> Search -> Excel to -> Excel To Table: a. Input: Excel file b. Output Table: Choose where to save, and a name c. OK ***Now, we have a Population Table file. ***Note: For this 2014 Population file, there will only be 312 block groups versus the AAC Block Groups which has 354. Part 4-3: Joining AAC Block Groups to the Population Table 1. Load into ArcMap: AAC Block Groups layer, and the Population Table 2. Right-click the AAC Block Groups layer -> Open attribute table -> Add new field -> Name: GeoID2, Type: Double -> OK 3. Right-click the new GeoID2 field heading -> Field Calculator: GEOID -> OK 4. Right-click the AAC Block Groups layer -> Joins and Relates -> Join: a. Click the drop-down button and select: Join attributes from a table b. Choose the field: GeoID2 c. Click the drop-down button and select the Population Table layer d. Choose the field: Geo.ID2 e. Choose: Keep all records f. Right-click the AAC Block Groups layer, and open the attribute table to check the Join ***Now, we have our AAC Block Groups joined to our Population Table. ***For multiple maps, it is best to copy the newly joined AAC Block Groups layer. Part 4-4: Symbolizing Population by Block Group 33
35 1. Right-click the Joined AAC Block Groups layer -> Properties -> Symbology tab: a. Click Quantities b. Value: Pop c. Click OK twice Part 4-5: Land Use/Cover Map 1. Load into ArcMap the Land Cover (2014) layer from Dr. Liu s PALS Anne Arundel County GIS data. (***This layer should already be projected correctly, but be sure to check in the Properties***) 2. Right-click the Joined Land Cover layer -> Properties -> Symbology tab: a. Click Categories b. Click Unique Values c. Value: CLASSNAME d. Click Add All Values e. Un-check All Other Values f. Click on Residential 1-acre -> Hold Shift and click on Residential 2-acre -> Rightclick -> Group Values g. Repeat Step f for Woods-Coniferous to Woods-Mixed and Open Space and Open Wetland and Forested Wetland h. Click on Airport -> Hold Ctrl and click on Transportation, and Utility -> Right-click -> Group Values i. Repeat Step h for Industrial and Mining j. Repeat Step h for Pasture/Hay and Row Crops k. Click OK twice - There should be 7 final categories after groupings. l. Choose appropriate colors/patterns/symbols for each category. Map(s) 5: Heat Map of (Map 2) EMS Incidents - ONLY ToD: PEAK 34
36 Part 5-1: Creating a Heat Map 1. Load into ArcMap the projected Fire Companies layer 2. Follow the Map(s) 2 section to create and define the appropriate EMS Incident layers: PM1-PEAK and PM2-PEAK 3. At the top of ArcMap, click Customize -> Extensions -> Check Spatial Analyst -> Close 4. ArcMap -> ArcToolbox -> Spatial Analyst Tools -> Density -> Kernel Density: a. Input Dataset: Choose either PM1-PEAK Incidents, OR PM2-PEAK Incidents b. Output Dataset: Click on the folder button, and choose where you want to save the new file. Also, choose what you want to name it. c. Click on Environments at the bottom -> Processing Extent -> Change Extent to the same as the projected Fire Companies layer d. Still in Environments -> Raster Analysis -> Mask -> Projected Fire Companies e. Click OK twice. 1. Repeat Step 2 for PM2-PEAK Incidents. ***Now, we have 2 heat maps for: PM1-PEAK and PM2-PEAK Incidents Part 5-2: Overlaying Maps of Other Data with a Heat Map 1. Load into ArcMap a map of Other Data (***From Map(s) 4***) 2. Load into ArcMap a Heat map 3. Make sure Heat map layer is on top of the Other Data layer. 4. Look at the classification ranges of the Heat map to see the lowest values. 5. Right-click the Heat map layer -> Properties -> Symbology tab -> Classify -> Exclusion -> Type in the range of values from Step 2 (Example: 0-44) 6. Click OK twice. 7. Optional: Right-click the Heat map layer -> Properties -> Display -> Adjust transparency value. 35
37 36
Task 1: Open ArcMap and activate the Spatial Analyst extension.
 Exercise 10 Spatial Analyst The following steps describe the general process that you will follow to complete the exercise. Specific steps will be provided later in the step-by-step instructions component
Neighborhood Locations and Amenities
 University of Maryland School of Architecture, Planning and Preservation Fall, 2014 Neighborhood Locations and Amenities Authors: Cole Greene Jacob Johnson Maha Tariq Under the Supervision of: Dr. Chao
In this exercise we will learn how to use the analysis tools in ArcGIS with vector and raster data to further examine potential building sites.
 GIS Level 2 In the Introduction to GIS workshop we filtered data and visually examined it to determine where to potentially build a new mixed use facility. In order to get a low interest loan, the building
Modeling Incident Density with Contours in ArcGIS Pro
 Modeling Incident Density with Contours in ArcGIS Pro By Mike Price, Entrada/San Juan, Inc. What you will need ArcGIS Pro 1.4 license or later ArcGIS Spatial Analyst license ArcGIS Online for organizational
Exercise on Using Census Data UCSB, July 2006
 Exercise on Using Census Data UCSB, July 2006 Purpose The purpose of this lab is to become familiar with Census Bureau data. Second, we will learn how to join tables which allows you to add data to the
PALS: Neighborhood Identification, City of Frederick, Maryland. David Boston Razia Choudhry Chris Davis Under the supervision of Chao Liu
 PALS: Neighborhood Identification, City of Frederick, Maryland David Boston Razia Choudhry Chris Davis Under the supervision of Chao Liu University of Maryland School of Architecture, Planning & Preservation
Calculating Conflict Density and Change over Time in Uganda using Vector Techniques
 Calculating Conflict Density and Change over Time in Uganda using Vector Techniques Created by Patrick Florance and Kyle Monahan; revised by Patrick Florance April 2, 2018. OVERVIEW... 1 SET UP... 1 SET
Utilizing Data from American FactFinder with TIGER/Line Shapefiles in ArcGIS
 Utilizing Data from American FactFinder with TIGER/Line Shapefiles in ArcGIS Web Adams, GISP Data Dissemination Specialist U.S. Census Bureau New York Regional Office 1 What We Do Decennial Census Every
Vector Analysis: Farm Land Suitability Analysis in Groton, MA
 Vector Analysis: Farm Land Suitability Analysis in Groton, MA Written by Adrienne Goldsberry, revised by Carolyn Talmadge 10/9/2018 Introduction In this assignment, you will help to identify potentially
Delineation of high landslide risk areas as a result of land cover, slope, and geology in San Mateo County, California
 Delineation of high landslide risk areas as a result of land cover, slope, and geology in San Mateo County, California Introduction Problem Overview This project attempts to delineate the high-risk areas
The Geodatabase Working with Spatial Analyst. Calculating Elevation and Slope Values for Forested Roads, Streams, and Stands.
 GIS LAB 7 The Geodatabase Working with Spatial Analyst. Calculating Elevation and Slope Values for Forested Roads, Streams, and Stands. This lab will ask you to work with the Spatial Analyst extension.
Introduction. Project Summary In 2014 multiple local Otsego county agencies, Otsego County Soil and Water
 Introduction Project Summary In 2014 multiple local Otsego county agencies, Otsego County Soil and Water Conservation District (SWCD), the Otsego County Planning Department (OPD), and the Otsego County
Tutorial 8 Raster Data Analysis
 Objectives Tutorial 8 Raster Data Analysis This tutorial is designed to introduce you to a basic set of raster-based analyses including: 1. Displaying Digital Elevation Model (DEM) 2. Slope calculations
Institutional Research with Public Data and Open Source Software
 2017 Institutional Research with Public Data and Open Source Software DUE1304591, 1644409, 1700496 Opinions expressed are those of the authors and not necessarily those of the National Science Foundation.
GIS Workshop UCLS_Fall Forum 2014 Sowmya Selvarajan, PhD TABLE OF CONTENTS
 TABLE OF CONTENTS TITLE PAGE NO. 1. ArcGIS Basics I 2 a. Open and Save a Map Document 2 b. Work with Map Layers 2 c. Navigate in a Map Document 4 d. Measure Distances 4 2. ArcGIS Basics II 5 a. Work with
Learning ArcGIS: Introduction to ArcCatalog 10.1
 Learning ArcGIS: Introduction to ArcCatalog 10.1 Estimated Time: 1 Hour Information systems help us to manage what we know by making it easier to organize, access, manipulate, and apply knowledge to the
Hot Spot / Point Density Analysis: Kernel Smoothing
 Hot Spot / Point Density Analysis: Kernel Smoothing Revised by Carolyn Talmadge on January 15, 2016 SETTING UP... 1 ENABLING THE SPATIAL ANALYST EXTENSION... 1 SET UP YOUR ANALYSIS OPTIONS IN ENVIRONMENTS...
Data Structures & Database Queries in GIS
 Data Structures & Database Queries in GIS Objective In this lab we will show you how to use ArcGIS for analysis of digital elevation models (DEM s), in relationship to Rocky Mountain bighorn sheep (Ovis
Visual Studies Exercise, Assignment 07 (Architectural Paleontology) Geographic Information Systems (GIS), Part II
 Geographic Information Systems (GIS), Part II") ARCH1291 Visual Studies II Week 8, Spring 2013 Assignment 7 GIS I Prof. Alihan Polat Visual Studies Exercise, Assignment 07 (Architectural Paleontology) Geographic Information Systems (GIS), Part II Medium:
ARCH1291 Visual Studies II Week 8, Spring 2013 Assignment 7 GIS I Prof. Alihan Polat Visual Studies Exercise, Assignment 07 (Architectural Paleontology) Geographic Information Systems (GIS), Part II Medium:
Geographic Systems and Analysis
 Geographic Systems and Analysis New York University Robert F. Wagner Graduate School of Public Service Instructor Stephanie Rosoff Contact: stephanie.rosoff@nyu.edu Office hours: Mondays by appointment
Spatial Analysis using Vector GIS THE GOAL: PREPARATION:
 PLAN 512 GIS FOR PLANNERS Department of Urban and Environmental Planning University of Virginia Fall 2006 Prof. David L. Phillips Spatial Analysis using Vector GIS THE GOAL: This tutorial explores some
Exercise 6: Working with Raster Data in ArcGIS 9.3
 Exercise 6: Working with Raster Data in ArcGIS 9.3 Why Spatial Analyst? Grid query Grid algebra Grid statistics Summary by zone Proximity mapping Reclassification Histograms Surface analysis Slope, aspect,
Analysis of Change in Land Use around Future Core Transit Corridors: Austin, TX, Eric Porter May 3, 2012
 Analysis of Change in Land Use around Future Core Transit Corridors: Austin, TX, 1990-2006 PROBLEM DEFINITION Eric Porter May 3, 2012 This study examines the change in land use from 1990 to 2006 in the
Geography 281 Map Making with GIS Project Four: Comparing Classification Methods
 Geography 281 Map Making with GIS Project Four: Comparing Classification Methods Thematic maps commonly deal with either of two kinds of data: Qualitative Data showing differences in kind or type (e.g.,
Overlay Analysis II: Using Zonal and Extract Tools to Transfer Raster Values in ArcMap
 Overlay Analysis II: Using Zonal and Extract Tools to Transfer Raster Values in ArcMap Created by Patrick Florance and Jonathan Gale, Edited by Catherine Ressijac on March 26, 2018 If you have raster data
Acknowledgments xiii Preface xv. GIS Tutorial 1 Introducing GIS and health applications 1. What is GIS? 2
 Acknowledgments xiii Preface xv GIS Tutorial 1 Introducing GIS and health applications 1 What is GIS? 2 Spatial data 2 Digital map infrastructure 4 Unique capabilities of GIS 5 Installing ArcView and the
Exercise 6: Using Burn Severity Data to Model Erosion Risk
 Exercise 6: Using Burn Severity Data to Model Erosion Risk Document Updated: November 2009 Software Versions: ERDAS Imagine 9.3 and ArcGIS 9.3, Microsoft Office 2007 Introduction A common use of burn severity
Geo 327G Semester Project. Landslide Suitability Assessment of Olympic National Park, WA. Fall Shane Lewis
 Geo 327G Semester Project Landslide Suitability Assessment of Olympic National Park, WA Fall 2011 Shane Lewis 1 I. Problem Landslides cause millions of dollars of damage nationally every year, and are
Hot Spot / Kernel Density Analysis: Calculating the Change in Uganda Conflict Zones
 Hot Spot / Kernel Density Analysis: Calculating the Change in Uganda Conflict Zones Created by Patrick Florance; revised by Carolyn Talmadge, Madeline Wrable, Kyle Monahan on March 28, 2017 OVERVIEW...
How to Create Stream Networks using DEM and TauDEM
 How to Create Stream Networks using DEM and TauDEM Take note: These procedures do not describe all steps. Knowledge of ArcGIS, DEMs, and TauDEM is required. TauDEM software ( http://hydrology.neng.usu.edu/taudem/
The data for this lab comes from McDonald Forest. We will be working with spatial data representing the forest boundary, streams, roads, and stands.
 GIS LAB 6 Using the Projection Utility. Converting Data to Oregon s Approved Lambert Projection. Determining Stand Size, Stand Types, Road Length, and Stream Length. This lab will ask you to work with
Introduction to ArcGIS 10.2
 Introduction to ArcGIS 10.2 Francisco Olivera, Ph.D., P.E. Srikanth Koka Lauren Walker Aishwarya Vijaykumar Keri Clary Department of Civil Engineering April 21, 2014 Contents Brief Overview of ArcGIS 10.2...
Working with ArcGIS: Classification
 Working with ArcGIS: Classification 2 Abbreviations D-click R-click TOC Double Click Right Click Table of Content Introduction The benefit from the use of geographic information system (GIS) software is
Exercise 2: Working with Vector Data in ArcGIS 9.3
 Exercise 2: Working with Vector Data in ArcGIS 9.3 There are several tools in ArcGIS 9.3 used for GIS operations on vector data. In this exercise we will use: Analysis Tools in ArcToolbox Overlay Analysis
Classification Exercise UCSB July 2006
 Classification Exercise UCSB July 2006 Purpose This exercise will examine how spatial data is catergorized and the advantages and disadvantages of different classification methods. Terms to know Population,
INTRODUCTION TO GIS. Practicals Guide. Chinhoyi University of Technology
 INTRODUCTION TO GIS Practicals Guide Chinhoyi University of Technology Lab 1: Basic Visualisation You have been requested to make a map of Zimbabwe showing the international boundary and provinces. The
ISU GIS CENTER S ARCSDE USER'S GUIDE AND DATA CATALOG
 ISU GIS CENTER S ARCSDE USER'S GUIDE AND DATA CATALOG 2 TABLE OF CONTENTS 1) INTRODUCTION TO ARCSDE............. 3 2) CONNECTING TO ARCSDE.............. 5 3) ARCSDE LAYERS...................... 9 4) LAYER
Lauren Jacob May 6, Tectonics of the Northern Menderes Massif: The Simav Detachment and its relationship to three granite plutons
 Lauren Jacob May 6, 2010 Tectonics of the Northern Menderes Massif: The Simav Detachment and its relationship to three granite plutons I. Introduction: Purpose: While reading through the literature regarding
SIE 509 Principles of GIS Exercise 5 An Introduction to Spatial Analysis
 SIE 509 Principles of GIS Exercise 5 An Introduction to Spatial Analysis Due: Oct. 31, 2017 Total Points: 50 Introduction: The Governor of Maine is asking communities to look at regionalization for major
Exercise 3: GIS data on the World Wide Web
 Exercise 3: GIS data on the World Wide Web These web sites are a few examples of sites that are serving free GIS data. Many other sites exist. Search in Google or other search engine to find GIS data for
Getting Started. Start ArcMap by opening up a new map.
 Start ArcMap by opening up a new map. Getting Started We now need to set up ArcMap to do some analysis using the Spatial Analyst extension. You will need to activate the Spatial Analyst extension by selecting
Introducing GIS analysis
 1 Introducing GIS analysis GIS analysis lets you see patterns and relationships in your geographic data. The results of your analysis will give you insight into a place, help you focus your actions, or
Displaying and Rotating WindNinja-Derived Wind Vectors in ArcMap 10.5
 Displaying and Rotating WindNinja-Derived Wind Vectors in ArcMap 10.5 Chuck McHugh RMRS, Fire Sciences Lab, Missoula, MT, 406-829-6953, cmchugh@fs.fed.us 08/01/2018 Displaying WindNinja-generated gridded
Where to Invest Affordable Housing Dollars in Polk County?: A Spatial Analysis of Opportunity Areas
 Resilient Neighborhoods Technical Reports and White Papers Resilient Neighborhoods Initiative 6-2014 Where to Invest Affordable Housing Dollars in Polk County?: A Spatial Analysis of Opportunity Areas
Compilation of GIS data for the Lower Brazos River basin
 Compilation of GIS data for the Lower Brazos River basin Francisco Olivera, Ph.D., P.E. Srikanth Koka Lauren Walker Aishwarya Vijaykumar Department of Civil Engineering December 5, 2011 Contents Brief
Lab 7: Cell, Neighborhood, and Zonal Statistics
 Lab 7: Cell, Neighborhood, and Zonal Statistics Exercise 1: Use the Cell Statistics function to detect change In this exercise, you will use the Spatial Analyst Cell Statistics function to compare the
Land Cover Data Processing Land cover data source Description and documentation Download Use Use
 Land Cover Data Processing This document provides a step by step procedure on how to build the land cover data required by EnSim. The steps provided here my be long and there may be short cuts (like using
Exercise 4 Estimating the effects of sea level rise on coastlines by reclassification
 Exercise 4 Estimating the effects of sea level rise on coastlines by reclassification Due: Thursday February 1; at the start of class Goal: Get familiar with symbolizing and making time-series maps of
MERGING (MERGE / MOSAIC) GEOSPATIAL DATA
 GEOSPATIAL DATA") This help guide describes how to merge two or more feature classes (vector) or rasters into one single feature class or raster dataset. The Merge Tool The Merge Tool combines input features from input
This help guide describes how to merge two or more feature classes (vector) or rasters into one single feature class or raster dataset. The Merge Tool The Merge Tool combines input features from input
Lecture 2. A Review: Geographic Information Systems & ArcGIS Basics
 Lecture 2 A Review: Geographic Information Systems & ArcGIS Basics GIS Overview Types of Maps Symbolization & Classification Map Elements GIS Data Models Coordinate Systems and Projections Scale Geodatabases
Task 1: Start ArcMap and add the county boundary data from your downloaded dataset to the data frame.
 Exercise 6 Coordinate Systems and Map Projections The following steps describe the general process that you will follow to complete the exercise. Specific steps will be provided later in the step-by-step
WORKING WITH DMTI DIGITAL ELEVATION MODELS (DEM)
") WORKING WITH DMTI DIGITAL ELEVATION MODELS (DEM) Contents (Ctrl-Click to jump to a specific page) Manipulating the DEM Step 1: Finding the DEM Tiles You Need... 2 Step 2: Importing the DEM Tiles into ArcMap...
WORKING WITH DMTI DIGITAL ELEVATION MODELS (DEM) Contents (Ctrl-Click to jump to a specific page) Manipulating the DEM Step 1: Finding the DEM Tiles You Need... 2 Step 2: Importing the DEM Tiles into ArcMap...
IMPERIAL COUNTY PLANNING AND DEVELOPMENT
 IMPERIAL COUNTY PLANNING AND DEVELOPMENT GEODATABASE USER MANUAL FOR COUNTY BUSINESS DEVELOPMENT GIS June 2010 Prepared for: Prepared by: County of Imperial Planning and Development 801 Main Street El
Diamonds on the soles of scholarship?
 Educational Performance and Family Income Diamonds on the soles of scholarship? by Introduction Problem Two young girls entering elementary school in Boston aspire to be doctors. Both come from twoparent,
Using American Factfinder
 Using American Factfinder What is American Factfinder? American Factfinder is a search engine that provides access to the population, housing and economic data collected by the U.S. Census Bureau. It can
(THIS IS AN OPTIONAL BUT WORTHWHILE EXERCISE)
") PART 2: Analysis in ArcGIS (THIS IS AN OPTIONAL BUT WORTHWHILE EXERCISE) Step 1: Start ArcCatalog and open a geodatabase If you have a shortcut icon for ArcCatalog on your desktop, double-click it to start
PART 2: Analysis in ArcGIS (THIS IS AN OPTIONAL BUT WORTHWHILE EXERCISE) Step 1: Start ArcCatalog and open a geodatabase If you have a shortcut icon for ArcCatalog on your desktop, double-click it to start
Watershed Delineation
 Watershed Delineation Jessica L. Watkins, University of Georgia 2 April 2009 Updated by KC Love February 25, 2011 PURPOSE For this project, I delineated watersheds for the Coweeta synoptic sampling area
CE 365K Exercise 1: GIS Basemap for Design Project Spring 2014 Hydraulic Engineering Design
 CE 365K Exercise 1: GIS Basemap for Design Project Spring 2014 Hydraulic Engineering Design The purpose of this exercise is for you to construct a basemap in ArcGIS for your design project. You may execute
Hennepin GIS. Tree Planting Priority Areas - Analysis Methodology. GIS Services April 2018 GOAL:
 Hennepin GIS GIS Services April 2018 Tree Planting Priority Areas - Analysis Methodology GOAL: To create a GIS data layer that will aid Hennepin County Environment & Energy staff in determining where to
Tutorial using the 2011 Statistics Canada boundary files and the Householder survey
 Tutorial using the 2011 Statistics Canada boundary files and the Householder survey In this tutorial, we ll try to determine the wards that contain the highest income groups. To do this, we will have to
How to Model Stream Temperature Using ArcMap
 How to Model Stream Temperature Using ArcMap Take note: Assumption before proceeding: A temperature point file has been attributed with TauDEM variables. There are three processes described in this document.
Modeling the Rural Urban Interface in the South Carolina Piedmont: T. Stephen Eddins Lawrence Gering Jeff Hazelton Molly Espey
 Modeling the Rural Urban Interface in the South Carolina Piedmont: T. Stephen Eddins (teddins@clemson.edu) Lawrence Gering Jeff Hazelton Molly Espey ABSTRACT Continuing growth of America s cities has created
Analyzing Nepal earthquake epicenters
 Analyzing Nepal earthquake epicenters The Nepal Earthquake Epicenters map shows epicenters of the earthquakes that occurred in and around Nepal. The year of the earthquake, its epicenter, and its magnitude
Exercise 2: Working with Vector Data in ArcGIS 9.3
 Exercise 2: Working with Vector Data in ArcGIS 9.3 There are several tools in ArcGIS 9.3 used for GIS operations on vector data. In this exercise we will use: Analysis Tools in ArcToolbox Overlay Analysis
Search for the Gulf of Carpentaria in the remap search bar:
 This tutorial is aimed at getting you started with making maps in Remap (). In this tutorial we are going to develop a simple classification of mangroves in northern Australia. Before getting started with
DP Project Development Pvt. Ltd.
 Dear Sir/Madam, Greetings!!! Thanks for contacting DP Project Development for your training requirement. DP Project Development is leading professional training provider in GIS technologies and GIS application
Within this document, the term NHDPlus is used when referring to NHDPlus Version 2.1 (unless otherwise noted).
.") Exercise 7 Watershed Delineation Using ArcGIS Spatial Analyst Last Updated 4/6/2017 Within this document, the term NHDPlus is used when referring to NHDPlus Version 2.1 (unless otherwise noted). There
Exercise 7 Watershed Delineation Using ArcGIS Spatial Analyst Last Updated 4/6/2017 Within this document, the term NHDPlus is used when referring to NHDPlus Version 2.1 (unless otherwise noted). There
Using Web GIS to Build Consensus and Combat Wildland Fire Threats
 Using Web GIS to Build Consensus and Combat Wildland Fire Threats By Mike Price, Entrada/San Juan, Inc. What You Will Need ArcGIS 10.3 for Desktop (any license level) An ArcGIS Online account (one comes
Working with Census 2000 Data from MassGIS
 Tufts University GIS Tutorial Working with Census 2000 Data from MassGIS Revised September 26, 2007 Overview In this tutorial, you will use pre-processed census data from Massachusetts to create maps of
Determining the Location of the Simav Fault
 Lindsey German May 3, 2012 Determining the Location of the Simav Fault 1. Introduction and Problem Formulation: The issue I will be focusing on involves interpreting the location of the Simav fault in
In order to save time, the following data files have already been preloaded to the computer (most likely under c:\odmc2012\data\)
") ODMC2012 QGIS Ex1 Schools and Public Transport In this exercise, users will learn how to a) map the location of secondary schools in and around the Southampton area; b) overlay the school location map
ODMC2012 QGIS Ex1 Schools and Public Transport In this exercise, users will learn how to a) map the location of secondary schools in and around the Southampton area; b) overlay the school location map
ArcGIS 9 ArcGIS StreetMap Tutorial
 ArcGIS 9 ArcGIS StreetMap Tutorial Copyright 2001 2008 ESRI All Rights Reserved. Printed in the United States of America. The information contained in this document is the exclusive property of ESRI. This
Software requirements * :
 Title: Product Type: Developer: Target audience: Format: Software requirements * : Using GRACE to evaluate change in Greenland s ice sheet Part I: Download, import and map GRACE data Part II: View and
Final Group Project Paper. Where Should I Move: The Big Apple or The Lone Star State
 Final Group Project Paper Where Should I Move: The Big Apple or The Lone Star State By: Nathan Binder, Shannon Scolforo, Kristina Conste, Madison Quinones Main Goal: Determine whether New York or Texas
Using the Stock Hydrology Tools in ArcGIS
 Using the Stock Hydrology Tools in ArcGIS This lab exercise contains a homework assignment, detailed at the bottom, which is due Wednesday, October 6th. Several hydrology tools are part of the basic ArcGIS
Instructions for Mapping 2011 Census Data
 Instructions for Mapping 2011 Census Data To map 2011 census data, you must download the census boundary files and the census data separately, then join the two files in ArcMap. In this guide, we will
Outline Anatomy of ArcGIS Metadata Data Types Vector Raster Conversion Adding Data Navigation Symbolization Methods Layer Files Editing Help Files
 UPlan Training Lab Exercise: Introduction to ArcGIS Outline Anatomy of ArcGIS Metadata Data Types Vector Raster Conversion Adding Data Navigation Symbolization Methods Layer Files Editing Help Files Anatomy
STAR COMMUNITY RATING SYSTEM OBJECTIVE EE-4: EQUITABLE SERVICES & ACCESS COMMUNITY LEVEL OUTCOMES FOR KING COUNTY, WA
 STAR COMMUNITY RATING SYSTEM OBJECTIVE EE-4: EQUITABLE SERVICES & ACCESS COMMUNITY LEVEL OUTCOMES FOR KING COUNTY, WA OUTCOME I: EQUITABLE ACCESS AND PROXIMITY Background: This analysis has been developed
Hazard Assessment of Lava Flows, Wildfires, and Tsunamis on the Big Island of Hawaii s population. By: Thomas Ditges
 Hazard Assessment of Lava Flows, Wildfires, and Tsunamis on the Big Island of Hawaii s population By: Thomas Ditges The Problem: The Big Island of Hawaii is the largest and most dangerous of the Hawaiian
Spatial Organization of Data and Data Extraction from Maptitude
 Spatial Organization of Data and Data Extraction from Maptitude N. P. Taliceo Geospatial Information Sciences The University of Texas at Dallas UT Dallas GIS Workshop Richardson, TX March 30 31, 2018 1/
Spatial Analyst: Multiple Criteria Evaluation Material adapted from FOR 4114 developed by Forestry Associate Professor Steve Prisley
 Spatial Analyst: Multiple Criteria Evaluation Material adapted from FOR 4114 developed by Forestry Associate Professor Steve Prisley Section 1: Data In this exercise we will be working with several types
Introduction to Coastal GIS
 Introduction to Coastal GIS Event was held on Tues, 1/8/13 - Thurs, 1/10/13 Time: 9:00 am to 5:00 pm Location: Roger Williams University, Bristol, RI Audience: The intended audiences for this course are
Map your way to deeper insights
 Map your way to deeper insights Target, forecast and plan by geographic region Highlights Apply your data to pre-installed map templates and customize to meet your needs. Select from included map files
Outline. Chapter 1. A history of products. What is ArcGIS? What is GIS? Some GIS applications Introducing the ArcGIS products How does GIS work?
 Outline Chapter 1 Introducing ArcGIS What is GIS? Some GIS applications Introducing the ArcGIS products How does GIS work? Basic data formats The ArcCatalog interface 1-1 1-2 A history of products Arc/Info
WlLPEN L. GORR KRISTEN S. KURLAND. Universitats- und Landesbibliothek. Bibliothek Architektur und Stadtebau ESRI
 hj WlLPEN L. GORR KRISTEN S. KURLAND Universitats- und Landesbibliothek Darmstadt Bibliothek Architektur und Stadtebau ESRI Contents Acknowledgments Preface xvii XV GIS Tutorial 1 Introduction Launch ArcMap
2G1/3G4 GIS TUTORIAL >>>>>>>>>>>>>>>>>>>>>>>>>>>>>>>>>>>>>>>>>>>>>>>>>>>>>>>>>>>>>>>>>>>>>>>>>>>>>>>>
 > University of Michigan >Taubman College of Architecture > ARCH 552, Perimeter @ Work Out [T]here, Fall 2009 >September 24, 2009 2G1/3G4 GIS TUTORIAL >>>>>>>>>>>>>>>>>>>>>>>>>>>>>>>>>>>>>>>>>>>>>>>>>>>>>>>>>>>>>>>>>>>>>>>>>>>>>>>>
Data Visualization with GIS, Dr. Chris Badurek Visualization and Computing Teacher s Workshop. Part 1: Getting Started with Tectonic Hot Spot Mapping
 Data Visualization with GIS, Dr. Chris Badurek Visualization and Computing Teacher s Workshop Part 1: Getting Started with Tectonic Hot Spot Mapping Lesson Overview This lesson is designed to help students
Chapter 5. GIS and Decision-Making
 Chapter 5. GIS and Decision-Making GIS professionals are involved in the use and application of GIS in a wide range of areas, including government, business, and planning. So far, it has been introduced
caused displacement of ocean water resulting in a massive tsunami. II. Purpose
 I. Introduction The Great Sumatra Earthquake event took place on December 26, 2004, and was one of the most notable and devastating natural disasters of the decade. The event consisted of a major initial
Studying Topography, Orographic Rainfall, and Ecosystems (STORE)
") Introduction Studying Topography, Orographic Rainfall, and Ecosystems (STORE) Lesson: Using ArcGIS Explorer to Analyze the Connection between Topography, Tectonics, and Rainfall GIS-intensive Lesson This
Introduction Studying Topography, Orographic Rainfall, and Ecosystems (STORE) Lesson: Using ArcGIS Explorer to Analyze the Connection between Topography, Tectonics, and Rainfall GIS-intensive Lesson This
How to Make or Plot a Graph or Chart in Excel
 This is a complete video tutorial on How to Make or Plot a Graph or Chart in Excel. To make complex chart like Gantt Chart, you have know the basic principles of making a chart. Though I have used Excel
Lab#8: Working With Geodatabases. create a geodatabase with feature datasets, tables, raster datasets, and raster catalogs
 Lab#8: Geodatabase Concepts Page#1 of 25 In this lab, you will learn how to: Lab#8: Working With Geodatabases create a geodatabase with feature datasets, tables, raster datasets, and raster catalogs join
GIS ANALYSIS METHODOLOGY
 GIS ANALYSIS METHODOLOGY No longer the exclusive domain of cartographers, computer-assisted drawing technicians, mainframes, and workstations, geographic information system (GIS) mapping has migrated to
ArcGIS Pro: Essential Workflows STUDENT EDITION
 ArcGIS Pro: Essential Workflows STUDENT EDITION Copyright 2018 Esri All rights reserved. Course version 6.0. Version release date August 2018. Printed in the United States of America. The information contained
Demographic characteristics of the School of International Studies 9 th Grade class and their success their first semester.
 Project Tutorial 1. Topic Demographic characteristics of the School of International Studies 9 th Grade class and their success their first semester. 2. Research Question/Problem For the 9 th Grade class
INTRODUCTION TO ARCGIS Version 10.*
 Week 3 INTRODUCTION TO ARCGIS Version 10.* topics of the week Overview of ArcGIS Using ArcCatalog Overview of ArcGIS Desktop ArcGIS Overview Scalable desktop applications ArcView ArcEditor ArcInfo ArcGIS
ARCGIS TRAINING AT KU GIS LABS: INTRODUCTION TO GIS: EXPLORING ARCCATALOG AND ARCGIS TOOLS
 PHASE 1_3 rd SESSION ARCGIS TRAINING AT KU GIS LABS: INTRODUCTION TO GIS: EXPLORING ARCCATALOG AND ARCGIS TOOLS 3 rd SESSION REPORT: 25 TH -27 TH JUNE 2014 SCHOOL OF ENVIRONMENTAL STUDIES COMPUTER LAB
The econ Planning Suite: CPD Maps and the Con Plan in IDIS for Consortia Grantees Session 1
 The econ Planning Suite: CPD Maps and the Con Plan in IDIS for Consortia Grantees Session 1 1 Training Objectives Use CPD Maps to analyze, assess, and compare levels of need in your community Use IDIS
MIS 0855 Data Science (Section 005) Fall 2016 In-Class Exercise (Week 4) Visualizing with Maps
 Fall 2016 In-Class Exercise (Week 4) Visualizing with Maps") MIS 0855 Data Science (Section 005) Fall 2016 In-Class Exercise (Week 4) Visualizing with Maps Objective: Learn how to use Tableau s powerful mapping tools Learning Outcomes: Learn at what levels (e.g.
MIS 0855 Data Science (Section 005) Fall 2016 In-Class Exercise (Week 4) Visualizing with Maps Objective: Learn how to use Tableau s powerful mapping tools Learning Outcomes: Learn at what levels (e.g.
Geography 281 Map Making with GIS Project Eight: Comparing Map Projections
 Geography 281 Map Making with GIS Project Eight: Comparing Map Projections In this activity, you will do a series of projection comparisons using maps at different scales and geographic extents. In this