A critique of the National Standard for Spatial Data Accuracy. Paul Zandbergen Department of Geography University of New Mexico
|
|
|
- Candace Joseph
- 5 years ago
- Views:
Transcription
1 A critique of the National Standard for Spatial Data Accuracy Paul Zandbergen Department of Geography University of New Mexico
2 Warning: Statistics Ahead!
3 Spatial Data Quality Matters!

4 Plane took off on a wrong runway and crashed in flames because the pilot used an outdated airport map. 49 persons were killed

5 AU.K.woman sent her Mercedes flying into a river, trusting the car's optimistic GPS guidance instead of the road signs warning of impending doom. Matters were made worse as the river was swollen from recent heavy rains, which caused the vehicle to be swept some 200 meters downstream before the woman was able to escape.
6 Spatial Data Quality Standards National Map Accuracy Standards (NMAS) National Standards for Spatial Data Accuracy (NSSDA) of the Federal Geographic Data Committee (FGDC) Guidelines and Specifications for Flood Hazard Mapping Partners of the Federal Emergency Management Agency (FEMA) Guidelines for Digital Elevation Data of the National Digital Elevation Program (NDEP) Minimum Standard Detail Requirements of the American Land Title Association (ALTA) and the American Congress on Surveying and Mapping (ACSM) Various standards and guidelines of the American Society for Photogrammetry and Remote Sensing (ASPRS)
7 National Map Accuracy Standards (1947) Based on the error resulting from paper maps i.e. what is the error in a very thin line on a paper map? Standard: 90% of well defined points that are tested must fall within a specified tolerance For map scales larger than 1:20,000, the NMAS horizontal tolerance is 1/30 inch, measured at publication scale. For map scales of 1:20,000 or smaller, the NMAS horizontal tolerance is 1/50 inch, measured at publication scale. Typical statement: Data is estimated to be compliant with the National Map Accuracy Standards for 1:12,000, estimated +/ 33.3 feet
8 National Standard for Spatial Data Accuracy (1998)
9 National Standard for Spatial Data Accuracy (1998) Current standard for all spatial data in the US Adopted by the Federal Geographic Data Committee (FGDC) Foundation for most other recent standards Outlines a testing methodology Minimum of 20 sample points Distributed across quadrants, not too close together Calculate Root Mean Square Error (RMSE) Compute 95% confidence interval by multiplying RMSE with for vertical error and for horizontal error Provides suggested reporting format NSSDA is a procedural standard does not define thresholds
10 National Standard for Spatial Data Accuracy (1998)

11 Accuracy Assessment
12 Accuracy Assessment
13 Root Mean Square Error (RMSE) RMSE = 1 n n i= 1 e 2

14 Resources to Implement NSSDA
15 Assumptions of NSSDA Data is free of systematic errors Errors of spatial data are normally distributed Errors in X and Y direction are similar and independent Spatial autocorrelation of error is limited Therefore: RMSE is used as basis for calculating 95 % confidence interval A sample of 20 points is sufficient Stratified random sampling is sufficient
16 Research Question Are positional errors of spatial data normally distributed? If not, what does that mean for accuracy metrics, like RMSE? Should we revise the NSSDA?
17 Four Data Types Considered Autonomous GPS position fixes Collected using a Trimble Geo XM unit, 1 second logging for 8 hours, random sample of 1,000 locations Reference: surveyed benchmark Geocoding Home addresses of public school students (163,886) geocoded against 1:5,000 street centerlines, random sample of 1,000 locations Reference: parcel centroids TIGER Roads 2000 Intersections of TIGER road data (2000), random sample of 1,000 locations Reference: 1 meter orthophotography Lidar elevation data Processed bare earth lidar elevation points Reference: field accuracy reports obtained using RTK GPS
18 GPS Position Fixes
19 Geocoded Addresses
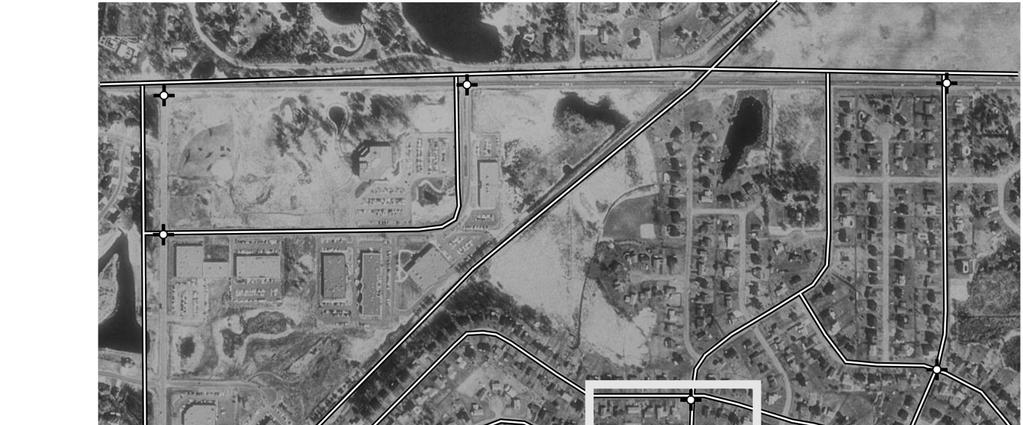
20 TIGER Road Network Intersections
21 Lidar Elevation Data
22 Positional Errors
23 Normality Testing Examining the distribution Skewness Kurtosis Normality testing Lillefors Shapiro Wilk Visualization Histogram Q Q plot

24 GPS Locations Horizontal (XY)
25 GPS Locations X and Y Components X component Y component
26 GPS Error Approximates a Rayleigh Distribution
27 Geocoding Errors

28 Geocoding Errors Log Transformed
29 TIGER Roads Errors

30 TIGER Roads Errors Log Transformed
31 Lidar Elevation Errors
32 bare earth and low grass brush lands and low trees Expected Normal 0 Expected Normal Observed Value Observed Value 2 4 fully forested urban areas Expected Normal 0 Expected Normal Observed Value Observed Value 2 4
33 Findings About Normality Positional errors are not normally distributed Some come close, e.g. X and Y components of GPS Some approximate log normality Outliers and skew are the norm!
34 What Does This Mean for Determining the Accuracy of My Data? Test Protocol: Use sample of 1,000 as the true distribution Derive accuracy metrics from this distribution Take a sample of 20 points, as per NSDDA protocol Determine accuracy metrics Repeat 100 times, i.e. 100 samples of 20 points Determine robustness of metrics Metrics employed RMSE, trimmed RMSE, 90 th and 95 th percentile
35 TIGER Roads 1,000 points 300 m 200 m Statistic Value (m) Average 38.5 Median 29.9 RMSE th 95.6 NSSDA m
36 TIGER Roads 20 points 300 m 200 m Statistic Value (m) Average 24.2 Median 21.3 RMSE th 44.7 NSSDA m
37 TIGER Roads 20 points 300 m 200 m Statistic Value (m) Average 40.0 Median 32.1 RMSE th 82.7 NSSDA m
38 Distribution of NSSDA Error Statistic True value 92.6 m Outliers of 175 and 256 m NSSDA Error Statistic (m)
39 Comparing Error Statistics Are they unbiased? Which metrics consistently over or underestimate? Compare average value of metrics of point samples to true metric for 1,000 points Are they reliable? Which metrics reveal very high or very low variability? Compare standard deviation of metrics of point samples to average value of metrics
40 Close-to-normal data: 1. Metrics close in performance 2. RMSE appears OK Non-normal data: 1. RMSE and percentiles poor 2. Trimmed RMSE best
41 Effect of Outliers and Trimming bare earth and low grass high grass, weeds and crops shrubs and low trees fully forested urban areas 0.20 RMSE (meters) Percentile of Error Distribution (%)
42 What Metrics to Use? RMSE on complete dataset performs poorly Percentiles (90 th, 95 th ) perform even worse Trimmed RMSE values perform better Alternative: median
43 General Recommendations Never assume your data is normal! Expect outliers Expect skew, log normal behavior etc. Test for normality if sample size allows Increase sample size Still effect of outliers on RMSE Metrics become more robust Properly characterize the error distribution Multiple metrics Curves/graphs Do not just fill out the NSSDA worksheet without examining your data!
44 How To Improve NSSDA 1. Embrace alternative approaches to error characterization 2. Do not calculate the 95% confidence interval from RMSE 3. Increase minimum sample size 4. Consider multiple error components (X, Y, vertical) 5. Consider some common alternative distributions 6. Data trimming might be one reasonable alternative 7. Expand beyond point features add line and area
45 Final Take Home Lessons Positional errors in spatial data do not behave normally! NSSDA is still THE standard we should all be using When using the NSSDA protocol, carefully examine your data Learn from others who are working with the same data types
46 Further Reading. Zandbergen, P.A. In Press. Characterizing the error distribution of LIDAR elevation data. International Journal of Remote Sensing. Zandbergen, P.A Geocoding quality and implications for spatial analysis. Geography Compass, 3(2): Zandbergen, P.A Positional accuracy of spatial data: Non normal distributions and a critique of the National Standard for Spatial Data Accuracy. Transactions in GIS, 12(1):
47 Contact Information Paul Zandbergen Department of Geography University of New Mexico
Positional Accuracy of Spatial Data: Non-Normal Distributions and a Critique of the National Standard for Spatial Data Accuracy
 : 103 130 Research Article Blackwell Oxford, TGIS Transactions 1361-1682 XXX 2008 The UKPublishing Authors. in GIS Ltd Journal compilation 2008 Blackwell Publishing Ltd Positional Research A Zandbergen
Sensitivity of estimates of travel distance and travel time to street network data quality
 Sensitivity of estimates of travel distance and travel time to street network data quality Paul Zandbergen Department of Geography University of New Mexico Outline Street network quality Approaches to
Error propagation models dlto examine the effects of geocoding quality on spatial analysis of individual level datasets
 Error propagation models dlto examine the effects of geocoding quality on spatial analysis of individual level datasets P.A. Zandbergen 1, T.C. Hart 2, K.E. Lenzer 1 and M.E. Camponovo 1 1 Department tof
Approaching quantitative accuracy in early Dutch city maps
 Approaching quantitative accuracy in early Dutch city maps Introduction Jakeline Benavides and John Nerbonne Alfa-informatica, University of Groningen j.benavides@rug.nl, j.nerbonne@rug.nl We are motivated
QUANTITATIVE ASSESSMENT OF DIGITAL TOPOGRAPHIC DATA FROM DIFFERENT SOURCES
 QUANTITATIVE ASSESSMENT OF DIGITAL TOPOGRAPHIC DATA FROM DIFFERENT SOURCES N. Yastıklı a, F. Esirtgen b, U. G. Sefercik c a YTU, Department of Geomatic Engineering, Davutpasa Campus, 31, Istanbul, Turkey
Lecture 12. Data Standards and Quality & New Developments in GIS
 Lecture 12 Data Standards and Quality & New Developments in GIS Lecture 12: Outline I. Data Standards and Quality 1. Types of Spatial Data Standards 2. Data Accuracy 3. III. Documenting Spatial Data Accuracy
Chapter 1 - Lecture 3 Measures of Location
 Chapter 1 - Lecture 3 of Location August 31st, 2009 Chapter 1 - Lecture 3 of Location General Types of measures Median Skewness Chapter 1 - Lecture 3 of Location Outline General Types of measures What
3D Elevation Program, Lidar in Missouri. West Central Regional Advanced LiDAR Workshop Ray Fox
 3D Elevation Program, Lidar in Missouri West Central Regional Advanced LiDAR Workshop Ray Fox National Enhanced Elevation Assessment (Dewberry, 2011) Sponsored by the National Digital Elevation Program
Summary Description Municipality of Anchorage. Anchorage Coastal Resource Atlas Project
 Summary Description Municipality of Anchorage Anchorage Coastal Resource Atlas Project By: Thede Tobish, MOA Planner; and Charlie Barnwell, MOA GIS Manager Introduction Local governments often struggle
CHANGES IN ETHNIC GEOGRAPHY IN WATERBURY AS A RESULT OF NATURAL DISASTERS AND URBAN RENEWAL
 G-1302: GIS and Environmental Modeling Final Project Report December 4, 2012 Student: David Perrier Instructor: Tatiana Serebriakova, Ph.D. CHANGES IN ETHNIC GEOGRAPHY IN WATERBURY AS A RESULT OF NATURAL
Quality and Coverage of Data Sources
 Quality and Coverage of Data Sources Objectives Selecting an appropriate source for each item of information to be stored in the GIS database is very important for GIS Data Capture. Selection of quality
ELEVATION. The Base Map
 ELEVATION The Base Map Basic Elevation Types: Points X, Y, Z Irregular distribution Cumbersome Typical sources Lidar Stereo photography Ground survey ASCII, LAS formats Basic Elevation Types: Contour Lines
LiDAR Quality Assessment Report
 LiDAR Quality Assessment Report The USGS National Geospatial Technical Operations Center, Data Operations Branch is responsible for conducting reviews of all Light Detection and Ranging (LiDAR) pointcloud
I. Abstract. II. Introduction
 Validating Your Geospatial Data: Protect Your Investment and Yourself! Author: Rodrick M. Erickson, Michael Baker Jr., Inc. I. Abstract The use of geospatial data in the decision making process continues
Emergency Planning. for the. Democratic National. Convention. imaging notes // Spring 2009 //
 Emergency Planning for the Democratic National Convention The DRAPP Demonstrates Partnership among Local, Regional, State, Utility and Federal Governments 14 imaging notes // Spring 2009 // www.imagingnotes.com
Flooding Performance Indicator Summary. Performance indicator: Flooding impacts on riparian property for Lake Ontario and the Upper St.
 Flooding Performance Indicator Summary Performance indicator: Flooding impacts on riparian property for Lake Ontario and the Upper St. Lawrence River Technical Workgroup: Coastal TWG Research by: Baird
Comparison in terms of accuracy of DEMs extracted from SRTM/X-SAR data and SRTM/C-SAR data: A Case Study of the Thi-Qar Governorate /AL-Shtra City
 International Journal of Current Engineering and Technology E-ISSN 2277 4106, P-ISSN 2347 5161 2016 INPRESSCO, All Rights Reserved Available at http://inpressco.com/category/ijcet Research Article Comparison
MISSOURI LiDAR Stakeholders Meeting
 MISSOURI LiDAR Stakeholders Meeting East-West Gateway June 18, 2010 Tim Haithcoat Missouri GIO Enhanced Elevation Data What s different about it? Business requirements are changing.fast New data collection
Utilizing GIS Technology for Rockland County. Rockland County Planning Department Douglas Schuetz & Scott Lounsbury
 Utilizing GIS Technology for Rockland County Rockland County Planning Department Douglas Schuetz & Scott Lounsbury Presentation Agenda Introduction What is GIS What can GIS do GIS Efforts for BOE Resources
Classification of Erosion Susceptibility
 GEO327G: GIS & GPS Applications in Earth Sciences Classification of Erosion Susceptibility Denali National Park, Alaska Zehao Xue 12 3 2015 2 TABLE OF CONTENTS 1 Abstract... 3 2 Introduction... 3 2.1 Universal
EXPERIENCE WITH HIGH ACCURACY COUNTY DTM MAPPING USING SURVEYING, PHOTOGRAMMETRIC, AND LIDAR TECHNOLOGIES - GOVERNMENT AND CONTRACTOR PERSPECTIVES
 EXPERIENCE WITH HIGH ACCURACY COUNTY DTM MAPPING USING SURVEYING, PHOTOGRAMMETRIC, AND LIDAR TECHNOLOGIES - GOVERNMENT AND CONTRACTOR PERSPECTIVES Barbora Ubar, Photogrammetrist Tim Brown, PSM, Senior
Accuracy assessment of Pennsylvania streams mapped using LiDAR elevation data: Method development and results
 Accuracy assessment of Pennsylvania streams mapped using LiDAR elevation data: Method development and results David Saavedra, geospatial analyst Louis Keddell, geospatial analyst Michael Norton, geospatial
What Do You See? FOR 274: Forest Measurements and Inventory. Area Determination: Frequency and Cover
 What Do You See? Message of the Day: Many options exist to determine the size, area, or extent of a feature on a landscape FOR 274: Forest Measurements and Inventory Lecture 7: Measures of Land Area Frequency
Regional GIS Initiatives Geospatial Technology Center
 Regional GIS Initiatives Geospatial Technology Center Mr. Bobby Lear GIS Coordinator St. James Parish & Dr. Balaji Ramachandran Contractors Educational Trust Fund Endowed Professor Geomatics Program, Department
Large Scale Elevation Data Assessment of SCOOP 2013 Deliverables. Version 1.1 March 2015
 Large Scale Elevation Data Assessment of SCOOP 2013 Deliverables Version 1.1 March 2015 ACKNOWLEDGEMENTS... 2 EXECUTIVE SUMMARY... 2 1.0 INTRODUCTION... 3 2.0 BACKGROUND... 4 2.1 SOUTH CENTRAL ONTARIO
Deriving Spatially Refined Consistent Small Area Estimates over Time Using Cadastral Data
 Deriving Spatially Refined Consistent Small Area Estimates over Time Using Cadastral Data H. Zoraghein 1,*, S. Leyk 1, M. Ruther 2, B. P. Buttenfield 1 1 Department of Geography, University of Colorado,
Sampling. Where we re heading: Last time. What is the sample? Next week: Lecture Monday. **Lab Tuesday leaving at 11:00 instead of 1:00** Tomorrow:
 Sampling Questions Define: Sampling, statistical inference, statistical vs. biological population, accuracy, precision, bias, random sampling Why do people use sampling techniques in monitoring? How do
Teaching GIS for Land Surveying
 Teaching GIS for Land Surveying Zhanjing (John) Yu Evergreen Valley College, San Jose, California James Crossfield California State University at Fresno, Fresno California 7/13/2006 1 Outline of the Presentation
Town of Chino Valley. Survey Control Network Report. mgfneerhg mc N. Willow Creek Road Prescott AZ
 Town of Chino Valley Survey Control Network Report mgfneerhg mc. 2050 N. Willow Creek Road Prescott AZ 86301 928-771-2376 Page 1 of 70 Table of Contents Town of Chino Valley Survey Datum Outline A short
Creating A-16 Compliant National Data Theme for Cultural Resources
 Creating A-16 Compliant National Data Theme for Cultural Resources Cultural Resource GIS Facility National Park Service John J. Knoerl Deidre McCarthy Paper 169 Abstract OMB Circular A-16 defines a set
PRELIMINARY ANALYSIS OF ACCURACY OF CONTOUR LINES USING POSITIONAL QUALITY CONTROL METHODOLOGIES FOR LINEAR ELEMENTS
 CO-051 PRELIMINARY ANALYSIS OF ACCURACY OF CONTOUR LINES USING POSITIONAL QUALITY CONTROL METHODOLOGIES FOR LINEAR ELEMENTS UREÑA M.A., MOZAS A.T., PÉREZ J.L. Universidad de Jaén, JAÉN, SPAIN ABSTRACT
UPDATING OF GEOSPATIAL DATA: A THEORETICAL FRAMEWORK
 UPDATING OF GEOSPATIAL DATA: A THEORETICAL FRAMEWORK J. Raul Ramirez, PhD The Ohio State University Center for Mapping, Columbus, Ohio, USA ABSTRACT Geospatial data are fundamental for the analysis and
A GIS BASED ACCURACY EVALUATION OF A HIGH RESOLUTION UNMANNED AERIAL VEHICLE DERIVED DIGITAL TERRAIN MODEL
 A GIS BASED ACCURACY EVALUATION OF A HIGH RESOLUTION UNMANNED AERIAL VEHICLE DERIVED DIGITAL TERRAIN MODEL A Research Project Presented to The Vancouver Island University GIS Graduate Program In Partial
USING HYPERSPECTRAL IMAGERY
 USING HYPERSPECTRAL IMAGERY AND LIDAR DATA TO DETECT PLANT INVASIONS 2016 ESRI CANADA SCHOLARSHIP APPLICATION CURTIS CHANCE M.SC. CANDIDATE FACULTY OF FORESTRY UNIVERSITY OF BRITISH COLUMBIA CURTIS.CHANCE@ALUMNI.UBC.CA
Using NFHL Data for Hazus Flood Hazard Analysis: An Exploratory Study
 Andrea M. Jackman, Ph.D. ASFPM June 3, 2015 Using NFHL Data for Hazus Flood Hazard Analysis: An Exploratory Study What is Hazus? Hazus is FREE software distributed by FEMA Risk MAP which models structural
10/13/2011. Introduction. Introduction to GPS and GIS Workshop. Schedule. What We Will Cover
 Introduction Introduction to GPS and GIS Workshop Institute for Social and Environmental Research Nepal October 13 October 15, 2011 Alex Zvoleff azvoleff@mail.sdsu.edu http://rohan.sdsu.edu/~zvoleff Instructor:
 Red River Flooding June 2015 Caddo and Bossier Parishes Presented by: Flood Technical Committee Where the Rain Falls Matters I-30 versus I-20 I-20 Backwater and Tributary Floods (Localized) 2016 Flood
First Exam. Geographers Tools: Automated Map Making. Digitizing a Map. Digitized Map. Revising a Digitized Map 9/22/2016.
 First Exam Monday, September 26, 206. Combination of multiple choice questions. Bring a #2 pencil with eraser. Based on class lectures and chapter. If you miss the exam, an essay style make up exam will
Targeted LiDAR use in Support of In-Office Address Canvassing (IOAC) March 13, 2017 MAPPS, Silver Spring MD
 March 13, 2017 MAPPS, Silver Spring MD") Targeted LiDAR use in Support of In-Office Address Canvassing (IOAC) March 13, 2017 MAPPS, Silver Spring MD Imagery, LiDAR, and Blocks In 2011, the GEO commissioned independent subject matter experts (Jensen,
Targeted LiDAR use in Support of In-Office Address Canvassing (IOAC) March 13, 2017 MAPPS, Silver Spring MD Imagery, LiDAR, and Blocks In 2011, the GEO commissioned independent subject matter experts (Jensen,
LOMR SUBMITTAL LOWER NEHALEM RIVER TILLAMOOK COUNTY, OREGON
 LOMR SUBMITTAL LOWER NEHALEM RIVER TILLAMOOK COUNTY, OREGON Prepared for: TILLAMOOK COUNTY DEPARTMENT OF COMMUNITY DEVELOPMENT 1510-B THIRD STREET TILLAMOOK, OR 97141 Prepared by: 10300 SW GREENBURG ROAD,
Existing NWS Flash Flood Guidance
 Introduction The Flash Flood Potential Index (FFPI) incorporates physiographic characteristics of an individual drainage basin to determine its hydrologic response. In flash flood situations, the hydrologic
Introduction to Geographic Information Science. Updates/News. Last Lecture 1/23/2017. Geography 4103 / Spatial Data Representations
 Geography 4103 / 5103 Introduction to Geographic Information Science Spatial Data Representations Updates/News Waitlisted students First graded lab this week: skills learning Instructional labs vs. independence
Approximation Theory Applied to DEM Vertical Accuracy Assessment
 bs_bs_banner : 397 410 Research Article Approximation Theory Applied to DEM Vertical Accuracy Assessment XiaoHang Liu Department of Geography and Human Environmental Studies San Francisco State University
LOMR SUBMITTAL LOWER NESTUCCA RIVER TILLAMOOK COUNTY, OREGON
 LOMR SUBMITTAL LOWER NESTUCCA RIVER TILLAMOOK COUNTY, OREGON Prepared for: TILLAMOOK COUNTY DEPARTMENT OF COMMUNITY DEVELOPMENT 1510-B THIRD STREET TILLAMOOK, OR 97141 Prepared by: 10300 SW GREENBURG ROAD,
U.S. Geological Survey Agency Briefing for MAPPS Mark L. DeMulder Director, National Geospatial Program. March 12, 2013
 + U.S. Geological Survey Agency Briefing for MAPPS Mark L. DeMulder Director, National Geospatial Program March 12, 2013 + 3D Elevation Program (3DEP) National Leadership The National Enhanced Elevation
Sampling The World. presented by: Tim Haithcoat University of Missouri Columbia
 Sampling The World presented by: Tim Haithcoat University of Missouri Columbia Compiled with materials from: Charles Parson, Bemidji State University and Timothy Nyerges, University of Washington Introduction
Jo Daviess County Geographic Information System
 Introduction The Jo Daviess County Geographic Information System (GIS) offers a wide variety of products and services. The GIS program has a cost recovery policy in place to help maintain and continue
USGS National Geospatial Program Understanding User Needs. Dick Vraga National Map Liaison for Federal Agencies July 2015
 + USGS National Geospatial Program Understanding User Needs Dick Vraga National Map Liaison for Federal Agencies July 2015 + Topics 2 Background Communities of Use User Surveys National Map Liaisons Partnerships
Preliminary Statistics course. Lecture 1: Descriptive Statistics
 Preliminary Statistics course Lecture 1: Descriptive Statistics Rory Macqueen (rm43@soas.ac.uk), September 2015 Organisational Sessions: 16-21 Sep. 10.00-13.00, V111 22-23 Sep. 15.00-18.00, V111 24 Sep.
IMPERIAL COUNTY PLANNING AND DEVELOPMENT
 IMPERIAL COUNTY PLANNING AND DEVELOPMENT GEODATABASE USER MANUAL FOR COUNTY BUSINESS DEVELOPMENT GIS June 2010 Prepared for: Prepared by: County of Imperial Planning and Development 801 Main Street El
Preparing GIS Data for NG9-1-1 in the Commonwealth of Virginia
 Preparing GIS Data for NG9-1-1 in the Commonwealth of Virginia Brian Crumpler Regional Coordinator Virginia Information Technologies Agency (VITA) February 28, 2017 1 1 Overview: Sharing ways Virginia
Risk Management of Storm Damage to Overhead Power Lines
 Risk Management of Storm Damage to Overhead Power Lines David Wanik, Jichao He, Brian Hartman, and Emmanouil Anagnostou Departments of Statistics, Mathematics, and Environmental and Civil Engineering University
Why Is It There? Attribute Data Describe with statistics Analyze with hypothesis testing Spatial Data Describe with maps Analyze with spatial analysis
 6 Why Is It There? Why Is It There? Getting Started with Geographic Information Systems Chapter 6 6.1 Describing Attributes 6.2 Statistical Analysis 6.3 Spatial Description 6.4 Spatial Analysis 6.5 Searching
OLC Rogue River. LiDAR Remote Sensing Data Final Report, 3 of 3
 OLC Rogue River LiDAR Remote Sensing Data Final Report, 3 of 3 November 5, 2012 Rogue River Valley, Oregon. Data collected for: Department of Geology and Mineral Industries 800 NE Oregon Street Suite 965
3Chapter Three: Rescue and Response
 17 16 Report Science Title and the Storms: the USGS Response to the Hurricanes of 2005 3Chapter Three: Rescue and Response This chapter documents the U.S. Geological Survey s (USGS) humanitarian rescue
Semester Project Final Report. Logan River Flood Plain Analysis Using ArcGIS, HEC-GeoRAS, and HEC-RAS
 Semester Project Final Report Logan River Flood Plain Analysis Using ArcGIS, HEC-GeoRAS, and HEC-RAS Kedric Curtis, Josh Hogge, Jordan Jarrett, Jared Justensen May 6, 2016 CEE 6190 GIS for Civil Engineers
Exploring the boundaries of your built and natural world. Geomatics
 Exploring the boundaries of your built and natural world Geomatics Before the Luxor brought magic to the Las Vegas strip and before the South LRT extension in Edmonton gave residents a new route to travel,
STEREO ANALYST FOR ERDAS IMAGINE Stereo Feature Collection for the GIS Professional
 STEREO ANALYST FOR ERDAS IMAGINE Stereo Feature Collection for the GIS Professional STEREO ANALYST FOR ERDAS IMAGINE Has Your GIS Gone Flat? Hexagon Geospatial takes three-dimensional geographic imaging
Introduction to Uncertainty and Treatment of Data
 Introduction to Uncertainty and Treatment of Data Introduction The purpose of this experiment is to familiarize the student with some of the instruments used in making measurements in the physics laboratory,
Modeling Coastal Change Using GIS Technology
 Emily Scott NRS 509 Final Report December 5, 2013 Modeling Coastal Change Using GIS Technology In the past few decades, coastal communities around the world are being threatened by accelerating rates of
NAVAJO NATION PROFILE
 NAVAJO NATION PROFILE Largest land based area and federally recognized tribe in the United States Over 27,000 square miles (or 17.2 million acres with a population of over 300,000 people. Covers Arizona,
Who has the data? Results of Maryland s 3-Week Statewide GIS Inventory Challenge. This is your state. This is your inventory.
 Who has the data? Results of Maryland s 3-Week Statewide GIS Inventory Challenge This is your state. This is your inventory. Maryland s Need for GIS Inventory Maryland had no central repository for its
Introduction INTRODUCTION TO GIS GIS - GIS GIS 1/12/2015. New York Association of Professional Land Surveyors January 22, 2015
 New York Association of Professional Land Surveyors January 22, 2015 INTRODUCTION TO GIS Introduction GIS - GIS GIS 1 2 What is a GIS Geographic of or relating to geography the study of the physical features
GIS for the Non-Expert
 GIS for the Non-Expert Ann Forsyth University of Minnesota February 2006 GIS for the Non-Expert 1. Definitions and problems 2. Measures being tested in Twin Cities Walking Study Basic approach, data, variables
Effects of input DEM data spatial resolution on Upstream Flood modeling result A case study in Willamette river downtown Portland
 Effects of input DEM data spatial resolution on Upstream Flood modeling result A case study in Willamette river downtown Portland By Hue Duong GEOG 593 Fall 2015 Digital Terrain Analysis Photo: Anh Duc
Dr. ABOLGHASEM AKBARI Faculty of Civil Engineering & Earth Resources, University Malaysia Pahang (UMP)
") Workshop on : Dr. ABOLGHASEM AKBARI Faculty of Civil Engineering & Earth Resources, University Malaysia Pahang (UMP) 14-15 April 2016 Venue: Tehran, Iran GIS definitions GIS: A simplified view of the real
Workshop on : Dr. ABOLGHASEM AKBARI Faculty of Civil Engineering & Earth Resources, University Malaysia Pahang (UMP) 14-15 April 2016 Venue: Tehran, Iran GIS definitions GIS: A simplified view of the real
Geographical Information System (GIS) Prof. A. K. Gosain
 Prof. A. K. Gosain") Geographical Information System (GIS) Prof. A. K. Gosain gosain@civil.iitd.ernet.in Definition of GIS GIS - Geographic Information System or a particular information system applied to geographical data
Geographical Information System (GIS) Prof. A. K. Gosain gosain@civil.iitd.ernet.in Definition of GIS GIS - Geographic Information System or a particular information system applied to geographical data
Quick Response Report #126 Hurricane Floyd Flood Mapping Integrating Landsat 7 TM Satellite Imagery and DEM Data
 Quick Response Report #126 Hurricane Floyd Flood Mapping Integrating Landsat 7 TM Satellite Imagery and DEM Data Jeffrey D. Colby Yong Wang Karen Mulcahy Department of Geography East Carolina University
Flood Hazard Zone Modeling for Regulation Development
 Flood Hazard Zone Modeling for Regulation Development By Greg Lang and Jared Erickson Pierce County GIS June 2003 Abstract The desire to blend current digital information with government permitting procedures,
Nebraska. Large Area Mapping Initiative. The Nebraska. Introduction. Nebraska Department of Natural Resources
 Nebraska Department of Natural Resources Introduction The Nebraska The Nebraska Department of Natural Resources (NDNR) has developed a process for using a geographic information system (GIS) to map Approximate
Spanish national plan for land observation: new collaborative production system in Europe
 ADVANCE UNEDITED VERSION UNITED NATIONS E/CONF.103/5/Add.1 Economic and Social Affairs 9 July 2013 Tenth United Nations Regional Cartographic Conference for the Americas New York, 19-23, August 2013 Item
Surface Hydrology Research Group Università degli Studi di Cagliari
 Surface Hydrology Research Group Università degli Studi di Cagliari Evaluation of Input Uncertainty in Nested Flood Forecasts: Coupling a Multifractal Precipitation Downscaling Model and a Fully-Distributed
Chapter 1 Overview of Maps
 Chapter 1 Overview of Maps In this chapter you will learn about: Key points when working with maps General types of maps Incident specific maps Map legend and symbols Map sources A map is a navigational
The 3D Elevation Program: Overview. Jason Stoker USGS National Geospatial Program ESRI 2015 UC
 + The 3D Elevation Program: Overview Jason Stoker USGS National Geospatial Program ESRI 2015 UC + 2 A little history USGS has a long, proud tradition of mapmaking (2009) + 3 The changing times Mapping
METADATA. Publication Date: Fiscal Year Cooperative Purchase Program Geospatial Data Presentation Form: Map Publication Information:
 METADATA CONTOURS Digital Geospatial Metadata: North Central Texas Orthophotography Identification Information Citation Originator: Publication Date: Fiscal Year 2001-2002 Title: Cooperative Purchase Program
Chapter 6 Group Activity - SOLUTIONS
 Chapter 6 Group Activity - SOLUTIONS Group Activity Summarizing a Distribution 1. The following data are the number of credit hours taken by Math 105 students during a summer term. You will be analyzing
Measuring and GIS Referencing of Network Level Pavement Deterioration in Post-Katrina Louisiana March 19, 2008
 Infrastructure Data Collection Solutions Measuring and GIS Referencing of Network Level Pavement Deterioration in Post-Katrina Louisiana March 19, 2008 Hurricane Katrina August 2005 I-10 I-610 West End
New Jersey Department of Transportation Extreme Weather Asset Management Pilot Study
 New Jersey Department of Transportation Extreme Weather Asset Management Pilot Study Overview Prepared for: June 26, 2018 Introduction Overview of Pilot Study New Jersey s Climate New Jersey s Transportation
Vocabulary: Samples and Populations
 Vocabulary: Samples and Populations Concept Different types of data Categorical data results when the question asked in a survey or sample can be answered with a nonnumerical answer. For example if we
Chapter 6. Fundamentals of GIS-Based Data Analysis for Decision Support. Table 6.1. Spatial Data Transformations by Geospatial Data Types
 Chapter 6 Fundamentals of GIS-Based Data Analysis for Decision Support FROM: Points Lines Polygons Fields Table 6.1. Spatial Data Transformations by Geospatial Data Types TO: Points Lines Polygons Fields
APPENDIX F PRE-COURSE WORK
 APPENDIX F PRE-COURSE WORK F-1 Pre-Course Work F-2 Pre-Course Work Intermediate Wildland Fire Behavior, S-290 Pre-Course Work The pre-course work is designed to ensure that students come to class with
Three-Dimensional Aerial Zoning around a Lebanese Airport
 Three-Dimensional Aerial Zoning around a Lebanese Airport Abstract by Oussama C. Jadayel and Rita Y. Ibrahim GIS Center, Faculty of Engineering, University of Balamand, P.O. Box: 100, Tripoli, LEBANON
DRRM in the Philippines: DRRM Projects, Geoportals and Socio-Economic Integration
 Regional workshop on Geo-referenced information system for improving disaster risk preparedness and management in Asia and the Pacific 26-27 June 2014, UNCC, Bangkok, Thailand DRRM in the Philippines:
Mapping Earth. How are Earth s surface features measured and modeled?
 Name Mapping Earth How are Earth s surface features measured and modeled? Before You Read Before you read the chapter, think about what you know about maps Record your thoughts in the first column Pair
Use of Geospatial data for disaster managements
 Use of Geospatial data for disaster managements Source: http://alertsystemsgroup.com Instructor : Professor Dr. Yuji Murayama Teaching Assistant : Manjula Ranagalage What is GIS? A powerful set of tools
DOWNLOAD OR READ : GIS BASED FLOOD LOSS ESTIMATION MODELING IN JAPAN PDF EBOOK EPUB MOBI
 DOWNLOAD OR READ : GIS BASED FLOOD LOSS ESTIMATION MODELING IN JAPAN PDF EBOOK EPUB MOBI Page 1 Page 2 gis based flood loss estimation modeling in japan gis based flood loss pdf gis based flood loss estimation
Floodplain Mapping & Flood Warning Applications in North Carolina
 Floodplain Mapping & Flood Warning Applications in North Carolina Marc Stanard, IT Project Manager Ken Ashe, Assistant Director David Herlong, Flood Warning Program Manager NC Crime Control & Public Safety
+ Check for Understanding
 n Measuring Position: Percentiles n One way to describe the location of a value in a distribution is to tell what percent of observations are less than it. Definition: The p th percentile of a distribution
Metadata for 2005 Orthophotography Products
 Metadata for 2005 Orthophotography Products What does this data set describe? 1. How should this data set be cited? 2. What geographic area does the data set cover? 3. What does it look like? 4. Does the
La Salle Upstream of Elie Watershed LiDAR
 Page 1 of 14 La Salle Upstream of Elie Watershed LiDAR Raster Dataset Tags Earth Science > Land Surface > Topography > Terrain Elevation, Elie, La Salle, Norquay, Cartier, Portage La Praire, Upstream of
Census Geography, Geographic Standards, and Geographic Information
 Census Geography, Geographic Standards, and Geographic Information Michael Ratcliffe Geography Division US Census Bureau New Mexico State Data Center Data Users Conference November 19, 2015 Today s Presentation
North Carolina Simplified Inundation Maps For Emergency Action Plans December 2010; revised September 2014; revised April 2015
 North Carolina Simplified Inundation Maps For Emergency Action Plans December 2010; revised September 2014; revised April 2015 INTRODUCTION Emergency Action Plans (EAPs) are critical to reducing the risks
GIS = Geographic Information Systems;
 What is GIS GIS = Geographic Information Systems; What Information are we talking about? Information about anything that has a place (e.g. locations of features, address of people) on Earth s surface,
Methodology for Analyzing Multi-Temporal Planimetric Changes of River Channels
 Methodology for Analyzing Multi-Temporal Planimetric Changes of River Channels Mozas-Calvache, A. T., Ureña-Cámara, M. A., Ariza-López, F. J. Department of Cartographic, Geodetic Engineering and Photogrammetry.
Pictometry GIS and Integration Solutions. Presented by Peter White, GISP GIS Product Manager, Pictometry International Corp.
 Pictometry GIS and Integration Solutions Presented by Peter White, GISP GIS Product Manager, Pictometry International Corp. 1. Pictometry Web Integration Solutions 2. Advanced LiDAR Sensor and Solutions
GEOSTATISTICS. Dr. Spyros Fountas
 GEOSTATISTICS Dr. Spyros Fountas Northing (m) 140550 140450 140350 Trent field Disturbed area Andover 140250 Panholes 436950 437050 437150 437250 437350 Easting (m) Trent Field Westover Farm (Blackmore,
1 What is Science? Worksheets CHAPTER CHAPTER OUTLINE
 www.ck12.org Chapter 1. What is Science? Worksheets CSS AP Physics 1 2015-16 Summer Assignment Part 1 of 3 CHAPTER 1 What is Science? Worksheets CHAPTER OUTLINE 1.1 Scientific Inquiry 1.2 Fundamental Units
Utilization of Global Map for Societal Benefit Areas
 Utilization of Global Map for Societal Benefit Areas The Fourth GEOSS AP Symposium Bali Indonesia, 11th March 2010 Shuhei Kojima Geographical Survey Institute Ministry of Land, Infrastructure, Transport
Copyright The McGraw-Hill Companies, Inc. Permission required for reproduction or display.
 CHAPTER 5 GIS DATA Acquisition 5.1 Existing GIS Data 5.1.1 Federal Geographic Data Committee 5.1.2 Geospatial One-Stop Box 5.1 Clearinghouse and Portal 5.1.3 U.S. Geological Survey 5.1.4 U.S. Census Bureau
Hurricane Florence: Rain this heavy comes along once every 1,000 years
 Hurricane Florence: Rain this heavy comes along once every 1,000 years By Associated Press, adapted by Newsela staff on 09.17.18 Word Count 786 Level 810L Image 1. This satellite image provided by the