Floodplain Mapping & Flood Warning Applications in North Carolina
|
|
|
- Horatio Alexander
- 5 years ago
- Views:
Transcription
1 Floodplain Mapping & Flood Warning Applications in North Carolina Marc Stanard, IT Project Manager Ken Ashe, Assistant Director David Herlong, Flood Warning Program Manager NC Crime Control & Public Safety NC Emergency Management Summary Due to North Carolina's diverse terrain and exposure to hurricanes and tropical storms, the risk of flooding is present in all parts of the state. Following unprecedented flooding from Hurricanes Fran and Floyd in the late 1990 s the NC General Assembly tasked the division of Emergency Management (NCEM) to improve the flood information and flood warning capabilities for the state. The goal of these programs is to reduce the loss of life and flood-related property damage by providing emergency managers and the public with more timely, detailed, and accurate information. With this goal in mind, NCEM has developed comprehensive databases and applications that use up to date flood maps and near real time stream gage data and forecasting. NCEM has based these applications on ArcGIS Server and ArcIMS technology for the online mapping component of the projects. The applications are: 1. FMIS (Floodplain Mapping Information System Online digital flood insurance rate maps (DFIRMS) 2. FIMAN (Flood Inundation Mapping and Alert Network) Near real time flood inundation maps and flood impacts information and assessment Introduction Within the North Carolina Division of Emergency Management, Geospatial & Technology Management Office, the Floodplain Mapping Program (NCFMP) and the Flood Warning Program serve the citizens and emergency managers of North Carolina with two web based applications. The first application is the Floodplain Mapping Information System (FMIS). This application allows users to view and download flooding information using an online interactive map. Several data sets are available for downloading including Digital Flood Insurance Rate Maps (DFIRMs), GIS databases that include the flood zones and other supporting information that were used to create the DFIRMS, elevation and imagery data, and Flood Insurance Study documents. The NCFMP has many users and stakeholders including other state agencies, floodplain administrators, private engineers, city & county planners, realtors, academia, and the general public. The second application is the Flood Inundation Mapping and Alert Network (FIMAN). This application monitors the near real time status of rain and stream gages for
2 approximately 300 sensors throughout the state. This application has two components associated with it. The first component, Contrail Web, manages the incoming data that is constantly received from the sensors. Within Contrail Web, alarms can be setup where if a stream reaches a certain level, appropriate individuals in the local area can be notified via text message or . The second component, FIMAN Maps, takes the data from Contrail to help users visualize the information inside an online mapping viewer. FIMAN Maps also gives users the ability to plan for potential flooding impact by viewing these impacts geographically. FIMAN Maps pulls real time USGS stream data and National Weather Service stream forecast levels. The data from FIMAN Maps is incorporated into the NC State Preparedness and Resource Tracking Application (NC SPARTA), which is monitored 24 hours a day, 7 days a week by NCEM operations staff. The Flood Warning Program tailors to local emergency managers and state agencies responding to flooding related issues. For this reason FIMAN applications require authentication in order for web users to access the applications. Hurricane Floyd September, 1999 The NC Floodplain Mapping Program (NCFMP) was created after hurricane Floyd caused over $3.5 billion in damages to the state. Most of the damages were flooding related due to the estimated inches of rain that fell across several counties. The Tar River at Tarboro reached 40.9 feet, which was a record high. This is 21 feet above the flood stage of 19 feet. Unfortunately there were 51 human fatalities associated with this storm. 54,000 homes were damaged with 16,674 homes destroyed, and almost $1 billion in agricultural losses alone. At the peak of the flood 18,000 square miles or roughly 1/3 of the land in NC was under water, and much of this land was considered outside of the flood hazard areas at that time. The limitations of the outdated flood maps made evident after hurricane Floyd when nearly 80% of the people impacted by flooding were not aware they were in a floodprone area. Hurricane Floyd caused the destruction of 4,117 uninsured/under-insured homes and 16,074 homes in total. Hurricane Floyd revealed flood-hazard data and map limitations in the State. After further research, it was noted that 75% of the State's Flood Insurance Rate Maps (FIRMs) are at least 5 years old and that 55% are at least 10 years old. This prompted the NC General Assembly to commit $23 million to modernize the flood maps across the state. To do this, North Carolina formed a Cooperating Technical State partnership between FEMA and 16 other federal agencies. On September 15, 2000, Federal and local community entities joined North Carolina and FEMA in an agreement to work together to maintain accurate, up-to-date flood hazard data for the State of North Carolina. As part of this agreement, each of the parties agreed to provide input into the development of technical agreements, and where possible commit the appropriate human, technical, financial and information resources. Some of the resources that the State and FEMA need from other Federal agencies include: Funding Digital elevation data Cross-section data for stream channels, bridges, culverts, and coastal transects suitable for engineering modeling Base map data (digital orthophoto quadrangles)

3 Data about flood control structures, such as levees, dikes, and dams Hydrographic and streamflow data Flood hazard data, such as from ongoing or recently completed hazard studies Technical guidance on implementation of advanced technologies, such as remote sensing and flood forecasting Advice on designing and implementing a state-of-the-art, on-line Information Management System Assistance in establishing technical and data standards Products of the NC Floodplain Mapping Program Remote Sensing Data To support improved floodplain delineation NC created one of the largest seamless LiDAR datasets in the world by collecting the elevation data statewide. The Bare Earth LiDAR points allowed for creation of statewide 50 & 20 ft Digital Elevation Models. This updated and accurate elevation data was a critical tool in defining the boundaries of the new flood hazard areas. Statewide LiDAR Dataset In addition to the LiDAR elevation data, the NCFMP collected up to date ortho photography from each county in NC. There were 17 counties that did not have ortho photography, so the NCFMP collected this data in cooperation with the NC Geodetic Survey. Once the photography was collected statewide, this imagery could be used to help define the boundaries of the new flood hazard areas by serving as a back drop in the new DFIRMs. Having up to date ortho photography is a high priority for the state due to the wide scope of users. Engineering Products Hydraulic and Hydrologic (H&H) analysis is a core component of defining the boundaries of the new flood hazard areas. The H&H models were generated using the LiDAR bare earth data and a variety of other data sources including field survey. Nearly 30,000 miles of stream were studied or updated in the statewide effort. The modeled

4 water surface elevations are used with the LiDAR to identify flooding area and expected water surface elevations. Database Products The GIS data that is derived from the Hydraulic and Hydrologic analysis, ortho photography, and LiDAR contains the flood hazard boundaries, base flood elevations, and stream centerlines and cross sections, in addition to all supporting base data. This GIS data is used to create the DFIRMs, and can also be used for specific analysis purposes. These DFIRM databases are county-wide, and are submitted to FEMA for review and inclusion in the National Flood Hazard Layer. In addition to the DFIRM geodatabase, an engineering and inventory geodatabase is available that stores the hydraulic and hydrologic data. This E&I data includes modeled stream centerlines and engineering cross sections in addition to detailed inventory data including bridges and culverts. Packaged with the E&I geodatabase are HEC-RAS (Hydrologic Engineering Centers River Analysis System) models that can be used for future stream analysis and studies. NCFMP DFIRM Database View

5 Flood Insurance Studies The Flood Insurance Study is a document that outlines all the data and analysis that was used to create the DFIRMs. Engineering and mapping methods are detailed for each study within the FIS. As part of the FIS, the stream profiles, watershed characteristics, and historic flood elevations are all included. The Digital Flood Insurance Rate Map is the product that most end users are interested in when trying to determine if a structure is inside or outside of a flood hazard area. This is the legal document that is used when doing a flood determination study and determining the need for flood insurance. Digital Flood Insurance Rate Map (DFIRM) PDF The NCFMP has completed the statewide update, and 99 out of the 100 counties have been issued effective DFIRMs. The state s mission requires maps maintain currency so the state is now in the maintenance phase of the project. The continued effort termed Map Maintenance involves going back to the older studies, and applying updated information to generate new DFIRMs. The state currently has 45 counties in the Map Maintenance phase. One of which has currently been issued for preliminary review. Part of the map maintenance effort involves storing and managing the new data as it is created. Updated imagery, GIS data, and DFIRM.pdf files are steadily being maintained by the NCFMP in order to keep the best available data accessible to the NCFMP users and stakeholders.

6 FMIS Portal The Floodplain Mapping Information System (FMIS) brings all the DFIRM products mentioned above into one online portal that is freely accessible by the public users ( All data is available for download and most data can be viewed inside the online map viewer. Users can search and query this data using a variety of criteria including address, county, city, stream name, and latitude / longitude coordinates. FMIS was first created with ArcIMS technology, but has since evolved into using ArcGIS Server with the JavaScript API. Data download tools are built into the mapping application for users to have access to available data. Imagery, DFIRM.pdf files, LiDAR, and county wide geodatabases are all available from FMIS. Floodplain Mapping Information System (FMIS) As part of the NCFMP Integrated Hazard Research Management the FMIS application is undergoing expansion to include a new layer of risk assessment components. Users will be able to view and query data derived from multiple hazards, DFIRM panels, and buildings. Flood Inundation Mapping and Alert Network (FIMAN) The NC Flood Warning Program was developed in conjunction with the NCFMP and focuses on improving the flood warning capabilities of the state. Near real time stream gage and rain data from USGS and NCEM sensors is collected and then made available to web users in a variety of formats. Analysis results that show flooding impact are made available for planning and preparation. The Flood Warning Program leverages the data products from the NCFMP, and provides a near real time monitoring capabilities to web users.

7 North Carolina Division of Emergency Management has installed a network of over 240 gages that provide real-time stream flow and rainfall data. These sensors, in addition to the existing 85 USGS gages, provide the ability to monitor changes in stream levels throughout the eastern and western parts of the state. The data from a gage is transmitted to an antenna on a communications tower located nearby the gage site. Once the data is received at the tower it is then piped into a Timewave communication device for processing and decoding. The processed data is then transmitted over the internet via the NC State Highway Patrol's connection to the State ITS Eastern Data Center in Raleigh. The National Weather Service also receives this data over the internet at this point. Gage data is constantly being received at the Eastern Data Center and stored into Contrail Web, a Linux based software package. Contrail Web is designed to manage the data received from the gage sensors. This data is stored inside a set of Linux based MySQL databases. These databases are replicated to a secondary data center located in Western NC. Every 30 minutes a custom windows application updates Contrail Web to include the near real-time stream gage readings from the USGS. With the USGS gages, the gage network has a total of over 500 sensors, including stream and rain gage data. One component of Contrail Web is a web interface that can be used to display sensor data and static maps. In addition, alarms can be set within the application to send alerts for when flooding is occurring or about to occur at specific sites. These alarms can be in the form of s, or cellular text messages. Site specific information can be viewed inside the Contrail Web interface that includes stream stage, flow volume, and precipitation amounts. Availability to detailed site information is a key component of Contrail Web. This data can be exposed for other applications to consume. Contrail Web Site Specific Data Contrail Web has a basic map component where users can view the status of the sensors in real time. The maps inside Contrail Web are limited, which created a need to develop a second component of the Flood Warning program, FIMAN Maps. The FIMAN Maps web mapping application is the visualization and planning tool that incorporates the stream gage data with supporting GIS layers. Tools within this custom web application include viewing the status of flooding statewide, visualizing flooding impact for specific gage sites, and accessing forecasted flood information from the National Weather Service. There are three main components in FIMAN Maps:


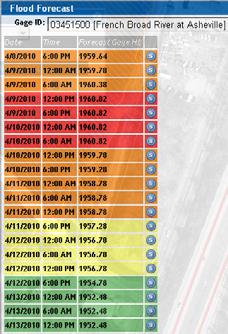
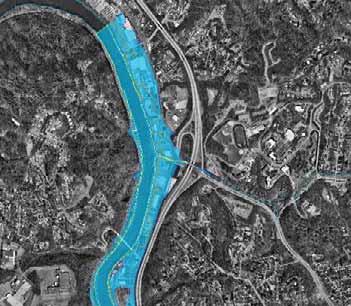
8 1. Current Conditions 2. Forecasted Conditions 3. What-if Conditions Current Conditions: The statewide status map within the FIMAN Maps web application gives web users a quick status update by county. The counties in this map are color coded based on the level of flooding. This status map is interactive, and if the user clicks on a county, the application will zoom to the extent of the county, allowing the user to get access to site specific data. Overlaying the flood impact polygons with imagery is a quick way to see which structures are at the most risk for flooding. Known flood impacts are also available that describes detailed information on how the various flooding levels affect that specific area. FIMAN Statewide Status Map The statewide status map uses an ArcSDE / SQL Server Spatial View. The data that makes up the view is updated every 30 minutes so that the map shows near real time status. A custom windows application updates the view by accessing the data in Contrail and populates the necessary data tables in the ArcSDE / SQL Server. Forecast Conditions: At most sites for which the NWS issues a flood forecast, inundation maps are displayed for each forecasted time interval. The maps can assist in the preparation and the response to the impacts at that gage site by emergency managers. Gages at reservoir dam sites and navigational locks and dams are not mapped.
9


10 What-if Flood Scenario Mapping The third component of FIMAN Maps is the Scenario Module. This function allows the user to examine the what-if impacts of flooding at a site by being able access the map polygons for each one-half foot rise in water from bank full to flood of record. This tool is particularly useful for developing response and recovery plans and procedures well ahead of an actual flood. Near Bank Full Minor Flooding Moderate Flooding Major Flooding Near Bank Full
11 Minor Flooding Moderate Flooding
12 Major Flooding The key aspect of FIMAN Maps is that it helps to visualize the impacts of flooding before and during an event. Roads, bridges, building and critical facilities that may be impacted can be identified. For the many sites that are not NWS forecast sites, flood stage and flood impacts have been established using FIMAN Maps in collaboration with local emergency managers. This has added a new level of understanding to the impacts of flooding. This improved awareness of the potential risks can help attain the overall goal of the program to reduce the loss of lives and impact to property from flooding. NCEM has created flood impact statements for specific sites throughout the state.

13 Flood Impact Statement The current conditions data within FIMAN Maps is currently integrated into the NC SPARTA system. SPARTA is the core operating set of solutions that NCEM and emergency managers throughout the state rely on during all categories of events. The current conditions statewide map is incorporated into the SPARTA map viewer so that users can obtain a statewide status. The SPARTA map viewer is directly linked to the FIMAN Maps viewer, so that a SPARTA user can have access to that information. Conclusion North Carolina is unique in that there are a wide range of flooding types and risk that pose a constant threat to the life and property. NCEM has responded to this threat by making the best available data accessible to the people who need it. The FMIS and FIMAN applications were developed with this goal in mind. The use of ArcGIS technology has enabled NCEM to build these comprehensive web mapping applications that serve a variety of users.
United States Multi-Hazard Early Warning System
 United States Multi-Hazard Early Warning System Saving Lives Through Partnership Lynn Maximuk National Weather Service Director, Central Region Kansas City, Missouri America s s Weather Enterprise: Protecting
USGS Flood Inundation Mapping of the Suncook River in Chichester, Epsom, Pembroke and Allenstown, New Hampshire
 USGS Flood Inundation Mapping of the Suncook River in Chichester, Epsom, Pembroke and Allenstown, New Hampshire NH Water & Watershed Conference Robert Flynn, USGS NH-VT Water Science Center March 23, 2012
A New National Flood Inundation Mapping Science Initiative
 A New National Flood Inundation Mapping Science Initiative William Guertal, PhD. Director, USGS Indiana and Kentucky Water Science Centers U.S. Department of the Interior U.S. Geological Survey Courtesy
Rainfall-River Forecasting: Overview of NOAA s Role, Responsibilities, and Services
 Dr. Thomas Graziano Chief Hydrologic Services Division NWS Headquarters Steve Buan Service Coordination Hydrologist NWS North Central River Forecast Center Rainfall-River Forecasting: Overview of NOAA
Real-Time Flood Forecasting Modeling in Nashville, TN utilizing HEC-RTS
 Real-Time Flood Forecasting Modeling in Nashville, TN utilizing HEC-RTS Brantley Thames, P.E. Hydraulic Engineer, Water Resources Section Nashville District, USACE August 24, 2017 US Army Corps of Engineers
Flood Inundation Mapping
 KU GIS Day 2009 November 18, 2009 Flood Inundation Mapping Wendy L. Pearson NOAA s National Weather Service Central Region Headquarters Kansas City, Missouri Flood Inundation Mapping Objectives: Overview
Natural and Human Influences on Flood Zones in Wake County. Georgia Ditmore
 Natural and Human Influences on Flood Zones in Wake County Georgia Ditmore Prepared for GEOG 591 December 5, 2014 2 Table of Contents Introduction.3 Objectives...5 Methods...6 Conclusion.11 References
Document Title. Estimating the Value of Partner Contributions to Flood Mapping Projects. Blue Book
 Document Title Estimating the Value of Partner Contributions to Flood Mapping Projects Blue Book Version 1.1 November 2006 Table of Contents 1. Background...1 2. Purpose...1 3. Overview of Approach...2
Guide to Hydrologic Information on the Web
 NOAA s National Weather Service Guide to Hydrologic Information on the Web Colorado River at Lees Ferry Photo: courtesy Tim Helble Your gateway to web resources provided through NOAA s Advanced Hydrologic
North Carolina Simplified Inundation Maps For Emergency Action Plans December 2010; revised September 2014; revised April 2015
 North Carolina Simplified Inundation Maps For Emergency Action Plans December 2010; revised September 2014; revised April 2015 INTRODUCTION Emergency Action Plans (EAPs) are critical to reducing the risks
Pequabuck River Flooding Study and Flood Mitigation Plan The City of Bristol and Towns of Plainville and Plymouth, CT
 Pequabuck River Flooding Study and Flood Mitigation Plan The City of Bristol and Towns of Plainville and Plymouth, CT Raymond Rogozinski and Maged Aboelata The City of Bristol and Towns of Plainville and
ARMSTRONG COUNTY, PA
 ARMSTRONG COUNTY, PA Revised Preliminary DFIRM Mapping March 31, 2013 Kevin Donnelly, P.E., CFM GG3, Greenhorne & O Mara, Inc. Presentation Agenda Armstrong County DFIRM Overview - June 25, 2010 DFIRM
USGS Hydrography Overview. May 9, 2018
 + 1 USGS Hydrography Overview May 9, 2018 + 2 The National Geospatial Program Provides the geospatial baseline of the Nation s topography, natural landscape and built environment through The National Map,
HEC & GIS Modeling of the Brushy Creek HEC & GIS Watershed Modeling of the
 HEC & GIS Modeling of the Brushy Creek HEC & GIS Watershed Modeling of the By Cassandra Fagan 5, December 2014 http://ubcwatershedstudy.ursokr.com/images/ Contents Introduction... 3 Figure 1: 24-hour rainfall
StreamStats: Delivering Streamflow Information to the Public. By Kernell Ries
 StreamStats: Delivering Streamflow Information to the Public By Kernell Ries U.S. Department of the Interior U.S. Geological Survey MD-DE-DC District 410-238-4317 kries@usgs.gov StreamStats Web Application
2018 NASCIO Award Submission Category: Cross-Boundary Collaboration and Partnerships. Project Title: Tennessee Wildfires: A Coordinated GIS Response
 2018 NASCIO Award Submission Category: Cross-Boundary Collaboration and Partnerships Project Title: Tennessee Wildfires: A Coordinated GIS Response Sevier County, Tennessee State of Tennessee, Emergency
Quick Response Report #126 Hurricane Floyd Flood Mapping Integrating Landsat 7 TM Satellite Imagery and DEM Data
 Quick Response Report #126 Hurricane Floyd Flood Mapping Integrating Landsat 7 TM Satellite Imagery and DEM Data Jeffrey D. Colby Yong Wang Karen Mulcahy Department of Geography East Carolina University
NOAA s National Weather Service. National Weather Service
 NOAA s National Weather Service Serving the Nation s Environmental Forecasting Needs Lynn Maximuk Regional Director National Weather Service Central Region Headquarters Kansas City, Missouri America s
A Cloud-Based Flood Warning System For Forecasting Impacts to Transportation Infrastructure Systems
 A Cloud-Based Flood Warning System For Forecasting Impacts to Transportation Infrastructure Systems Jon Goodall Associate Professor, Civil and Environmental Engineering Associate Director, Link Lab April
Issue 44: Phase II & III H&H Issues Date: 07/03/2006 Page 1
 Background Phase I of the NCFMP studies have primarily focused on the coastal plain and sandhills physiographic regions in of the State. Phase II and III study areas will focus on the piedmont, foothills,
Storm Surge Analysis Update Meeting Cross City, Florida June 17, 2014
 Big Bend Coastal Storm Surge Study Storm Surge Analysis Update Meeting Cross City, Florida June 17, 2014 Introductions Risk MAP Project Team FEMA Region IV Florida Division of Emergency Management (FDEM)
GREENE COUNTY, PA. Revised Preliminary DFIRM Mapping FEMA. Kevin Donnelly, P.E., CFM GG3, Greenhorne & O Mara, Inc. April 10, 2013
 GREENE COUNTY, PA Revised Preliminary DFIRM Mapping April 10, 2013 Kevin Donnelly, P.E., CFM GG3, Greenhorne & O Mara, Inc. Presentation Agenda Greene County DFIRM Overview September 30, 2010 DFIRM Countywide
LOMR SUBMITTAL LOWER NEHALEM RIVER TILLAMOOK COUNTY, OREGON
 LOMR SUBMITTAL LOWER NEHALEM RIVER TILLAMOOK COUNTY, OREGON Prepared for: TILLAMOOK COUNTY DEPARTMENT OF COMMUNITY DEVELOPMENT 1510-B THIRD STREET TILLAMOOK, OR 97141 Prepared by: 10300 SW GREENBURG ROAD,
Summary of Available Datasets that are Relevant to Flood Risk Characterization
 Inter-Agency Characterization Workshop February 25-27, 2014 USACE Institute for Water Resources, Alexandria, VA, IWR Classroom Summary of Available Datasets that are Relevant to Characterization National
HURRICANE MATTHEW A GIS PERSPECTIVE GLYNN COUNTY GIS
 HURRICANE MATTHEW A GIS PERSPECTIVE GLYNN COUNTY GIS Situation September 25 th October 9 th 2016 Hurricane Matthew tracked its way up the east coast bringing hurricane force winds and flooding from Haiti
IMPERIAL COUNTY PLANNING AND DEVELOPMENT
 IMPERIAL COUNTY PLANNING AND DEVELOPMENT GEODATABASE USER MANUAL FOR COUNTY BUSINESS DEVELOPMENT GIS June 2010 Prepared for: Prepared by: County of Imperial Planning and Development 801 Main Street El
LOMR SUBMITTAL LOWER NESTUCCA RIVER TILLAMOOK COUNTY, OREGON
 LOMR SUBMITTAL LOWER NESTUCCA RIVER TILLAMOOK COUNTY, OREGON Prepared for: TILLAMOOK COUNTY DEPARTMENT OF COMMUNITY DEVELOPMENT 1510-B THIRD STREET TILLAMOOK, OR 97141 Prepared by: 10300 SW GREENBURG ROAD,
Flood Hazard Zone Modeling for Regulation Development
 Flood Hazard Zone Modeling for Regulation Development By Greg Lang and Jared Erickson Pierce County GIS June 2003 Abstract The desire to blend current digital information with government permitting procedures,
The 3D Elevation Program: Overview. Jason Stoker USGS National Geospatial Program ESRI 2015 UC
 + The 3D Elevation Program: Overview Jason Stoker USGS National Geospatial Program ESRI 2015 UC + 2 A little history USGS has a long, proud tradition of mapmaking (2009) + 3 The changing times Mapping
An overview of the applications for early warning and mapping of the flood events in New Brunswick
 Flood Recovery, Innovation and Reponse IV 239 An overview of the applications for early warning and mapping of the flood events in New Brunswick D. Mioc 1, E. McGillivray 2, F. Anton 1, M. Mezouaghi 2,
San Antonio River Authority. San Antonio River Authority Floodworks implementation in the San Antonio River Basin. Nefi Garza, PE, CFM
 San Antonio River Authority Floodworks implementation in the San Antonio River Basin Nefi Garza, PE, CFM San Antonio River Authority Michael Crenshaw, PE, CFM Anthony J. Henry Wallingford Software, Inc
A Comprehensive Inventory of the Number of Modified Stream Channels in the State of Minnesota. Data, Information and Knowledge Management.
 A Comprehensive Inventory of the Number of Modified Stream Channels in the State of Minnesota Data, Information and Knowledge Management Glenn Skuta Environmental Analysis and Outcomes Division Minnesota
UPPER COSUMNES RIVER FLOOD MAPPING
 UPPER COSUMNES RIVER FLOOD MAPPING DRAFT BASIC DATA NARRATIVE FLOOD INSURANCE STUDY SACRAMENTO COUTY, CALIFORNIA Community No. 060262 November 2008 Prepared By: CIVIL ENGINEERING SOLUTIONS, INC. 1325 Howe
CLIMATE CHANGE ADAPTATION BY MEANS OF PUBLIC PRIVATE PARTNERSHIP TO ESTABLISH EARLY WARNING SYSTEM
 CLIMATE CHANGE ADAPTATION BY MEANS OF PUBLIC PRIVATE PARTNERSHIP TO ESTABLISH EARLY WARNING SYSTEM By: Dr Mamadou Lamine BAH, National Director Direction Nationale de la Meteorologie (DNM), Guinea President,
Law Enforcement Solutions and Applications
 ArcGIS for Solutions and Applications Solutions and Applications ArcGIS for Platform ArcGIS for Collection of solutions and applications for law enforcement. Built on the ArcGIS platform. For any named
FEMA Hazards Loss Modeling Task Force (MOTF) Situation Report #14. Colorado Spring Flood Risk ***FINAL REPORT***
 Situation Report #14. Colorado Spring Flood Risk ***FINAL REPORT***") FEMA Hazards Loss Modeling Task Force (MOTF) Situation Report #14 Colorado Spring Flood Risk FEMA Modeling Task Force (MOTF) Denver Federal Center, Building 710A Denver, Colorado 80225 Email: FEMA-MOTF@fema.dhs.gov
FEMA Hazards Loss Modeling Task Force (MOTF) Situation Report #14 Colorado Spring Flood Risk FEMA Modeling Task Force (MOTF) Denver Federal Center, Building 710A Denver, Colorado 80225 Email: FEMA-MOTF@fema.dhs.gov
Community Discovery Data Questionnaire
 Region III Community Discovery Data Questionnaire Thank you for taking the time to complete this questionnaire. It will provide important information to help FEMA understand flood risk issues in the Conococheague-Opequon
USGS National Geospatial Program Understanding User Needs. Dick Vraga National Map Liaison for Federal Agencies July 2015
 + USGS National Geospatial Program Understanding User Needs Dick Vraga National Map Liaison for Federal Agencies July 2015 + Topics 2 Background Communities of Use User Surveys National Map Liaisons Partnerships
Emergency Planning. for the. Democratic National. Convention. imaging notes // Spring 2009 //
 Emergency Planning for the Democratic National Convention The DRAPP Demonstrates Partnership among Local, Regional, State, Utility and Federal Governments 14 imaging notes // Spring 2009 // www.imagingnotes.com
The Delaware Environmental Observing System
 The Delaware Environmental Observing System DECISION SUPPORT FOR COASTAL FLOODING AND SNOWFALL Daniel Leathers, State Climatologist, Professor University of Delaware Tina Callahan, DEMAC, University of
An Overview of Operations at the West Gulf River Forecast Center Gregory Waller Service Coordination Hydrologist NWS - West Gulf River Forecast Center
 National Weather Service West Gulf River Forecast Center An Overview of Operations at the West Gulf River Forecast Center Gregory Waller Service Coordination Hydrologist NWS - West Gulf River Forecast
Base Level Engineering FEMA Region 6
 Base Level Engineering Over the past five years, has been evaluating its investment approach and data preparation work flow to establish an efficient and effective change in operation, generating an approach
GIS Techniques for Floodplain Delineation. Dean Djokic
 GIS Techniques for Floodplain Delineation Dean Djokic (ddjokic@esri.com) Content What is a floodplain? How to get a floodplain? What can GIS do for floodplain modeling? Simple GIS techniques for floodplain
Creation of an Internet Based Indiana Water Quality Atlas (IWQA)
") Department of Environmental Management Creation of an Internet Based Water Quality Atlas (IWQA) May 4, 2005 IUPUI 1200 Waterway Blvd., Suite 100 polis, 46202-5140 Water Quality Atlas John Buechler, Neil
Department of Environmental Management Creation of an Internet Based Water Quality Atlas (IWQA) May 4, 2005 IUPUI 1200 Waterway Blvd., Suite 100 polis, 46202-5140 Water Quality Atlas John Buechler, Neil
Climate Risk Visualization for Adaptation Planning and Emergency Response
 Climate Risk Visualization for Adaptation Planning and Emergency Response NCR Flood Fact Finding Workshop Ricardo Saavedra ricardo@vizonomy.com Social Media, Mobile, and Big Data St. Peter s Basilica,
Semester Project Final Report. Logan River Flood Plain Analysis Using ArcGIS, HEC-GeoRAS, and HEC-RAS
 Semester Project Final Report Logan River Flood Plain Analysis Using ArcGIS, HEC-GeoRAS, and HEC-RAS Kedric Curtis, Josh Hogge, Jordan Jarrett, Jared Justensen May 6, 2016 CEE 6190 GIS for Civil Engineers
Discovery Data Questionnaire
 Region III Discovery Data Questionnaire Thank you for taking the time to complete this Discovery Data questionnaire. It will provide important information to help FEMA better understand flood risk issues
BSYSE 456/556 Surface Hydrologic Processes and Modeling
 BSYSE 456/556 Surface Hydrologic Processes and Modeling Lab 9 (Prepared by Erin Brooks and Jan Boll, UI, and Joan Wu, WSU) P Introduction One of the most difficult tasks in watershed assessment and management
The Role of the Louisiana Geographic Information Center in the Response to Hurricane Katrina
 The Role of the Louisiana Geographic Information Center in the Response to Hurricane Katrina By: Jared Chapiewsky & Laura Brown For: URPL 969- GIS Applications in Response to Hurricane Katrina Date: March
An Analysis of Past River Flooding at Select National Weather Service River Forecast Locations in South Carolina
 An Analysis of Past River Flooding at Select National Weather Service River Forecast Locations in South Carolina Jeff C. Dobur AUTHOR: Sr. Hydrologist. National Oceanic and Atmospheric Administration,
Hurricane Preparation and Recovery. October 11, 2011 Jon Nance, Chief Engineer, NCDOT
 Hurricane Preparation and Recovery October 11, 2011 Jon Nance, Chief Engineer, NCDOT North Carolina & Severe Weather Our state often bears the brunt of storms, which include: Ice storms Snow storms Heavy
USING GIS TO MODEL AND ANALYZE HISTORICAL FLOODING OF THE GUADALUPE RIVER NEAR NEW BRAUNFELS, TEXAS
 USING GIS TO MODEL AND ANALYZE HISTORICAL FLOODING OF THE GUADALUPE RIVER NEAR NEW BRAUNFELS, TEXAS ASHLEY EVANS While the state of Texas is well-known for flooding, the Guadalupe River Basin is one of
Louisiana Transportation Engineering Conference. Monday, February 12, 2007
 Louisiana Transportation Engineering Conference Monday, February 12, 2007 Agenda Project Background Goal of EIS Why Use GIS? What is GIS? How used on this Project Other site selection tools I-69 Corridor
GIS Capabilities. Leveraging POINT OF BEGINNING. Waterfront Surveying Safety Certification GNSS Advantages
 Waterfront Surveying Safety Certification GNSS Advantages October 2008 Risk Data POINT OF BEGINNING Final DFIRM Leveraging GIS Capabilities Engineering Data Elevation Data Plus: A Review of the 2008 ESRI
Preparing a NFIE-Geo Database for Travis County
 Preparing a NFIE-Geo Database for Travis County By David R. Maidment Center for Research in Water Resources University of Texas at Austin 2 February 2015 Contents Introduction... 1 Step 1. Download and
MISSOURI LiDAR Stakeholders Meeting
 MISSOURI LiDAR Stakeholders Meeting East-West Gateway June 18, 2010 Tim Haithcoat Missouri GIO Enhanced Elevation Data What s different about it? Business requirements are changing.fast New data collection
NR402 GIS Applications in Natural Resources
 NR402 GIS Applications in Natural Resources Lesson 1 Introduction to GIS Eva Strand, University of Idaho Map of the Pacific Northwest from http://www.or.blm.gov/gis/ Welcome to NR402 GIS Applications in
NAVAJO NATION PROFILE
 NAVAJO NATION PROFILE Largest land based area and federally recognized tribe in the United States Over 27,000 square miles (or 17.2 million acres with a population of over 300,000 people. Covers Arizona,
Information. Information Technology. Geographic. Services (GIS) 119 W Indiana Ave Deland, FL 32720
 119 W Indiana Ave Deland, FL 32720") Information Technology Geographic Information Services (GIS) 119 W Indiana Ave Deland, FL 32720 A GIS consists of 5 primary components: Hardware Software People Data Methods or Business Processes --- Hardware
Information Technology Geographic Information Services (GIS) 119 W Indiana Ave Deland, FL 32720 A GIS consists of 5 primary components: Hardware Software People Data Methods or Business Processes --- Hardware
Summary Description Municipality of Anchorage. Anchorage Coastal Resource Atlas Project
 Summary Description Municipality of Anchorage Anchorage Coastal Resource Atlas Project By: Thede Tobish, MOA Planner; and Charlie Barnwell, MOA GIS Manager Introduction Local governments often struggle
BCeMap A Multi Agency Situational Awareness System for the Province of BC
 BCeMap A Multi Agency Situational Awareness System for the Province of BC URISA BC Gurdeep Singh Manager, Business Development & Partnership Portfolio Integrated Land Management Bureau, GeoBC Kristopher
Coastal Emergency Risks Assessment - CERA Real-Time Storm Surge and Wave Visualization Tool
 Coastal Emergency Risks Assessment - CERA Real-Time Storm Surge and Wave Visualization Tool Introduction This document provides guidance for using the Coastal Emergency Risks Assessment (CERA) visualization
STATE GEOGRAPHIC INFORMATION DATABASE
 STATE GEOGRAPHIC INFORMATION DATABASE Data Information and Knowledge Management STATE GEOGRAPHIC INFORMATION DATABASE EXECUTIVE SUMMARY Utah has developed one of the most comprehensive statewide GIS resources
SECONDARY ROADS LEVERAGING ENTERPRISE GIS. Secondary Road Department & GIS Department Linn County, Iowa April 20, 2015
 SECONDARY ROADS LEVERAGING ENTERPRISE GIS Secondary Road Department & GIS Department Linn County, Iowa April 20, 2015 Brad Ketels, P.E. Linn County Assistant Engineer Matt Boyle, GISP Linn County GIS Analyst
3D Elevation Program, Lidar in Missouri. West Central Regional Advanced LiDAR Workshop Ray Fox
 3D Elevation Program, Lidar in Missouri West Central Regional Advanced LiDAR Workshop Ray Fox National Enhanced Elevation Assessment (Dewberry, 2011) Sponsored by the National Digital Elevation Program
GIS in Weather and Society
 GIS in Weather and Society Olga Wilhelmi Institute for the Study of Society and Environment National Center for Atmospheric Research WAS*IS November 8, 2005 Boulder, Colorado Presentation Outline GIS basic
Flood Hazard Inundation Mapping. Presentation. Flood Hazard Mapping
 Flood Hazard Inundation Mapping Verne Schneider, James Verdin, and JeradBales U.S. Geological Survey Reston, VA Presentation Flood Hazard Mapping Requirements Practice in the United States Real Time Inundation
Report from the Geographic Information Coordinating Council
 Report from the Geographic Information Coordinating Council Presented by: Dr. Lee Mandell, Chair North Carolina Geographic Information Coordinating Council What is GIS? Geography plays a role in nearly
Flood Database for Oklahoma: A web-mapping application for spatial data organization and access
 Flood Database for Oklahoma: A web-mapping application for spatial data organization and access Developed in partnership with the Oklahoma Department of Transportation Bridge and Survey Divisions S. Jerrod
Appendix E Guidance for Shallow Flooding Analyses and Mapping
 Appendix E Guidance for Shallow Flooding Analyses and Mapping E.1 Introduction Different types of shallow flooding commonly occur throughout the United States. Types of flows that result in shallow flooding
Building a National Data Repository
 Building a National Data Repository Mladen Stojic, Vice President - Geospatial 1/30/2013 2012 Intergraph Corporation 1 Information has meaning and gives power only when shared and distributed. Information,
Corps Involvement in FEMA s Map Modernization Program
 HH&C Tri-Service Infrastructure Conference 2-5 August 2005 - St. Louis Corps Involvement in FEMA s Map Modernization Program Kate White, PhD, PE (CEERD-RN) John Hunter, PE (CELRN) Mark Flick (CELRN) FEMA
Ground Water Protection Council 2017 Annual Forum Boston, Massachusetts. Ben Binder (303)
") Ground Water Protection Council 2017 Annual Forum Boston, Massachusetts Protecting Groundwater Sources from Flood Borne Contamination Ben Binder (303) 860-0600 Digital Design Group, Inc. The Problem Houston
Ground Water Protection Council 2017 Annual Forum Boston, Massachusetts Protecting Groundwater Sources from Flood Borne Contamination Ben Binder (303) 860-0600 Digital Design Group, Inc. The Problem Houston
GIS Monroe Geographic Information System March 14, 2018
 GIS Monroe Geographic Information System March 14, 2018 Goals Maintain Enterprise/County-wide geo-database Increase spatial accuracy of data Build and acquire more data layers Increase use of GIS; as another
GEOGRAPHIC INFORMATION SYSTEMS Session 8
 GEOGRAPHIC INFORMATION SYSTEMS Session 8 Introduction Geography underpins all activities associated with a census Census geography is essential to plan and manage fieldwork as well as to report results
Nebraska. Large Area Mapping Initiative. The Nebraska. Introduction. Nebraska Department of Natural Resources
 Nebraska Department of Natural Resources Introduction The Nebraska The Nebraska Department of Natural Resources (NDNR) has developed a process for using a geographic information system (GIS) to map Approximate
The Kentucky Mesonet: Entering a New Phase
 The Kentucky Mesonet: Entering a New Phase Stuart A. Foster State Climatologist Kentucky Climate Center Western Kentucky University KCJEA Winter Conference Lexington, Kentucky February 9, 2017 Kentucky
Statewide Topographic Mapping Program
 Statewide Topographic Mapping Program February 28, 2018 www.dotd.la.gov Outline Purpose of the Statewide Topographic Mapping Program History Breakdown of R.S. 48:36 - Topographic Mapping Statewide Topographic
SoilView: Development of a Custom GIS Application for Publishing Soil Surveys
 SoilView: Development of a Custom GIS Application for Publishing Soil Surveys Allan Johnson and Mike Wigginton Abstract Currently, digital soils information can be obtained from many sources. Numerous
GIS-T 2010 Building a Successful Geospatial Data Sharing Framework: A Ohio DOT Success Story
 GIS-T 2010 Building a Successful Geospatial Data Sharing Framework: A Ohio DOT Success Story ODOT District 2 GIS John Puente District 1 GIS Coordinator\ Planning Administrator 2 Interoperability 3 District
Northrop Grumman Concept Paper
 Northrop Grumman Concept Paper A Comprehensive Geospatial Web-based Solution for NWS Impact-based Decision Support Services Glenn Higgins April 10, 2014 Northrop Grumman Corporation Information Systems
Introducing the. a partnership of
 Introducing the a partnership of Background Need for online atlas identified by managers and researchers to make coastal data available Shoreline data Ocean and coastal resources Sea-level rise potential
Maryland Transit Administration (MTA) Bus Accident Mapping and Analysis Application
 Bus Accident Mapping and Analysis Application") Maryland Transit Administration (MTA) Bus Accident Mapping and Analysis Application Ralign Wells, MTA Administrator Bernadette Bridges, MTA Chief Safety Officer Office of Safety, Quality Assurance, and
Maryland Transit Administration (MTA) Bus Accident Mapping and Analysis Application Ralign Wells, MTA Administrator Bernadette Bridges, MTA Chief Safety Officer Office of Safety, Quality Assurance, and
ArcGIS Online Tools and Water-Related Web Services You Can Use Every Day of Your Life!
 ArcGIS Online Tools and Water-Related Web Services You Can Use Every Day of Your Life! Brian Rowley, PE, CFM FMA 2014 Annual Conference 1 Gold Rush (49ers) John Sutter Sutter s Mill South fork of American
Preliminary Vulnerability Assessment of Coastal Flooding Threats - Taylor County, Florida
 Preliminary Vulnerability Assessment of Coastal Flooding Threats - Taylor County, Florida North Central Florida Regional Planning Council Northeast Florida Regional Council April 28, 2016 BACKGROUND This
Complete Weather Intelligence for Public Safety from DTN
 Complete Weather Intelligence for Public Safety from DTN September 2017 White Paper www.dtn.com / 1.800.610.0777 From flooding to tornados to severe winter storms, the threats to public safety from weather-related
THE NEED FOR AN ADDITIONAL SPILLWAY AT THE SANFORD DAM BOILING SPRING LAKES, NC. Presentation for The Brunswick County Commissioners April 20, 2015
 THE NEED FOR AN ADDITIONAL SPILLWAY AT THE SANFORD DAM BOILING SPRING LAKES, NC Presentation for The Brunswick County Commissioners April 20, 2015 The Sanford Dam Earth Dam constructed in 1961 Drainage
Kentucky Collaborates in GeoMAPP Project: The Advantages and Challenges of Archiving in a State with a Centralized GIS
 Kentucky Collaborates in GeoMAPP Project: The Advantages and Challenges of Archiving in a State with a Centralized GIS Geospatial Multistate Archive and Preservation Partnership By Glen McAninch Best Practices
Out with the Old, In with the New: Implementing the Results of the Iowa Rapid Floodplain Modeling Project
 Out with the Old, In with the New: Implementing the Results of the Iowa Rapid Floodplain Modeling Project Traci Tylski, E.I., CFM Hydraulics Engineer USACE - Omaha District Traci.M.Tylski@USACE.army.mil
Sea level rise Web GIS Applications
 Florida International University FIU Digital Commons GIS Center GIS Center 2018 Sea level rise Web GIS Applications Zhaohui Fu GIS-RS Center, Florida International University, Fujen@fiu.edu Sheyla Santana
Manitoba s Elevation (LiDAR) & Imagery Datasets. Acquisition Plans & Opportunities for Collaboration
 & Imagery Datasets. Acquisition Plans & Opportunities for Collaboration") Manitoba s Elevation (LiDAR) & Imagery Datasets Acquisition Plans & Opportunities for Collaboration Manitoba Planning Conference May 2017 Presentation Outline Manitoba s Elevation (LiDAR) and Imagery Datasets
Manitoba s Elevation (LiDAR) & Imagery Datasets Acquisition Plans & Opportunities for Collaboration Manitoba Planning Conference May 2017 Presentation Outline Manitoba s Elevation (LiDAR) and Imagery Datasets
Maryland Transit Administration (MTA) Bus Accident Mapping and Analysis Application
 Bus Accident Mapping and Analysis Application") Maryland Transit Administration (MTA) Bus Accident Mapping and Analysis Application Ralign Wells, MTA Administrator Bernadette Bridges, MTA Chief Safety Officer Office of Safety, Quality Assurance, and
Maryland Transit Administration (MTA) Bus Accident Mapping and Analysis Application Ralign Wells, MTA Administrator Bernadette Bridges, MTA Chief Safety Officer Office of Safety, Quality Assurance, and
Positioning the Pacific: NOAA s Geospatial Activities. Juliana Blackwell, Director NOAA s National Geodetic Survey March 6, 2012
 Positioning the Pacific: NOAA s Geospatial Activities Juliana Blackwell, Director NOAA s National Geodetic Survey March 6, 2012 A Common Problem of the Early 19 th Century 1807 President Thomas Jefferson
Unit 5: NWS Hazardous Weather Products. Hazardous Weather and Flooding Preparedness
 Unit 5: NWS Hazardous Weather Products Objectives Describe the mission of the NWS Describe the basic organizational structure of the NWS Explain the purpose of various NWS products Explain how Probability
What s New in Topographic Information - USGS National Map
 + What s New in Topographic Information - USGS National Map SARGIS Workshop November 14, 2016 Rob Dollison, 703-648-5724 rdollison@usgs.gov + USGS 2 National Geospatial Program The National Geospatial
Evaluating Physical, Chemical, and Biological Impacts from the Savannah Harbor Expansion Project Cooperative Agreement Number W912HZ
 Evaluating Physical, Chemical, and Biological Impacts from the Savannah Harbor Expansion Project Cooperative Agreement Number W912HZ-13-2-0013 FY 2016 - First Quarterly Report January 1, 2016 Submitted
Innovated Technological Trends in Highways. Flood Modelling & Evaluation of Impacts on Infrastructure
 Innovated Technological Trends in Highways Flood Modelling & Evaluation of Impacts on Infrastructure Dr. Waheed Uddin Professor and Director CAIT University of Mississippi Contributions from: CAIT and
6/9/2014. Software Overview. System Overview
 Future Rainfall 6/9/2014 Curtis Beitel, PE, CFM, Anthony Henry and Wayne Tschirhart, PE, CFM, PMP TFMA Spring 2014 Conference Software Overview 2 Processes Hydrometric DB Event Manager Automatic Low =
UTAH S STATEWIDE GEOGRAPHIC INFORMATION DATABASE
 UTAH S STATEWIDE GEOGRAPHIC INFORMATION DATABASE Data Information and Knowledge Management NASCIO Awards 2009 STATE GEOGRAPHIC INFORMATION DATABASE B. EXECUTIVE SUMMARY Utah has developed one of the most
Large Scale Mapping Policy for the Province of Nova Scotia
 Large Scale Mapping Policy for the Province of Nova Scotia December, 2005 Version 1.0 TABLE OF CONTENTS PAGE BACKGROUND...3 POLICY...5 Policy 1.0 Large Scale Mapping Program...5 Policy 2.0 Service Offering...5