GEOSTATISTICS. Dr. Spyros Fountas
|
|
|
- Doris Barton
- 6 years ago
- Views:
Transcription
1 GEOSTATISTICS Dr. Spyros Fountas
2 Northing (m) Trent field Disturbed area Andover Panholes Easting (m) Trent Field Westover Farm (Blackmore, 2003)

3 Trent field, Westover Farm

4 Yield mapping combine Ian Britton
5 Raw yield data points Northing (m) Easting (m) (Blackmore, 2003)
6 Univariate summary statistics Central tendency Min 0 Q1 3.3 Median 3.8 Q3 4.7 Max 7.6 Average 3.9 Mode 3.7 Count 3917 Variability Variance 1.6 Std dev 1.3 Interquartile range 1.4 Upper outliers above 6.8 Lower outliers below 1.2 Trent field, Westover farm Frequency Cumulative % 100% 80% 60% 40% 400 Measures of histogram shape Skewness Coefficient of variation Kurtosis % % Classed yield (t/ha) (data: Blackmore, 2003)
7 Why Geostatistics? We want to know the soil properties of some elements at each point to apply fertilizer where it needs and nowhere else Grid 20m x 20m e.g soil salinity pollution by heavy metals arsenic in ground water rainfall barometric pressure
8 Why Geostatistics? COMMON: the environment is continuous, BUT We can afford to measure properties at only a finite number of places, OR The best we can do is to estimate, or predict, in spatial sense This is the PRINCIPLE of Geostatistics
9 ? The estimation procedure in Geostatistics: KRIGING
10 Spatial prediction ?
11 Spatial relationships h 2 =
12 Why Geostatistics? But, if there is an ERROR? If we underestimate and recommend less fertilizer when it is needed & the farmer loose yield & profit? What are you going to say to the farmer? Geostatistics gives the answer! It can never provide complete information, of course, but given the data, it can enable you to estimate the probabilities that true values exceed specified threshold
13 Spatial data Spatial statistics refers to environment for soil, water, air Result of the actions & interactions of many different processes & factors Each process might itself operate on several scales simultaneously, in a non-linear way, and with local positive feedback.
14 Spatial data The spatial changes in the environment are obvious, when we see them on aerial photographs and satellites or are more subtle e.g. temperature or chemical Measurements are taken in a few cm, or meters, which we call point samples. Point samples are positively related autocorrelated. Places close to one another tend to have similar values, while further apart differ more. Environmentalists know that intuitively. Geostatisticians can quantify the spatial autocorrelations and minimize the errors
15 Geo vs Classical Statistics 1. Classical Stats are based on random sampling, linear sum of data, all of whom carry the same weight If there is spatial correlations, then by stratifying we can estimate more precisely or sample more effectively. If the strata are of different sizes, then we can vary the weights attributable to their data in proportion
16 Geo vs Classical Stats 2. Geostatistics rely on spatial models, while classical don t. Classical are based on sampling design, which implies unbiasedness & provides estimates of error if the choice of sampling design is suitable. It requires no assumptions about the nature of the variable itself. In Geostatistics, assumes that the variable is random & is the outcome of one or more random processes. The models of which predictions are based, are of these random processes.
17 Semi-variogram used for Kriging Spatial relationship Sill Variance Micro error or Sampling error Nugget Range Distance of influence

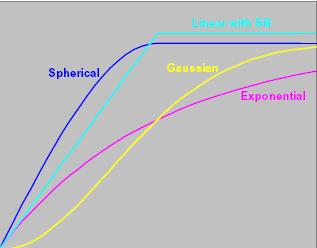
18 Spatial models γ h
19 Simulation Variogram model Search window Sample data Variance Lag Nugget Sill Range Convert parameters to a covariance model ? Search window Randomly select value from distribution Local mean Gaussian Mean Lag Simulated value = 14.5 Search window (Adapted from Chainey and Stuart, 1998) Using the lag, find covariance from covariance model
11/8/2018. Spatial Interpolation & Geostatistics. Kriging Step 1
 (Z i Z j ) 2 / 2 (Z i Zj) 2 / 2 Semivariance y 11/8/2018 Spatial Interpolation & Geostatistics Kriging Step 1 Describe spatial variation with Semivariogram Lag Distance between pairs of points Lag Mean
Spatial Interpolation & Geostatistics
 (Z i Z j ) 2 / 2 Spatial Interpolation & Geostatistics Lag Lag Mean Distance between pairs of points 1 y Kriging Step 1 Describe spatial variation with Semivariogram (Z i Z j ) 2 / 2 Point cloud Map 3
PRODUCING PROBABILITY MAPS TO ASSESS RISK OF EXCEEDING CRITICAL THRESHOLD VALUE OF SOIL EC USING GEOSTATISTICAL APPROACH
 PRODUCING PROBABILITY MAPS TO ASSESS RISK OF EXCEEDING CRITICAL THRESHOLD VALUE OF SOIL EC USING GEOSTATISTICAL APPROACH SURESH TRIPATHI Geostatistical Society of India Assumptions and Geostatistical Variogram
Anomaly Density Estimation from Strip Transect Data: Pueblo of Isleta Example
 Anomaly Density Estimation from Strip Transect Data: Pueblo of Isleta Example Sean A. McKenna, Sandia National Laboratories Brent Pulsipher, Pacific Northwest National Laboratory May 5 Distribution Statement
Index. Geostatistics for Environmental Scientists, 2nd Edition R. Webster and M. A. Oliver 2007 John Wiley & Sons, Ltd. ISBN:
 Index Akaike information criterion (AIC) 105, 290 analysis of variance 35, 44, 127 132 angular transformation 22 anisotropy 59, 99 affine or geometric 59, 100 101 anisotropy ratio 101 exploring and displaying
7 Geostatistics. Figure 7.1 Focus of geostatistics
 7 Geostatistics 7.1 Introduction Geostatistics is the part of statistics that is concerned with geo-referenced data, i.e. data that are linked to spatial coordinates. To describe the spatial variation
Introduction. Semivariogram Cloud
 Introduction Data: set of n attribute measurements {z(s i ), i = 1,, n}, available at n sample locations {s i, i = 1,, n} Objectives: Slide 1 quantify spatial auto-correlation, or attribute dissimilarity
Lecture 5 Geostatistics
 Lecture 5 Geostatistics Lecture Outline Spatial Estimation Spatial Interpolation Spatial Prediction Sampling Spatial Interpolation Methods Spatial Prediction Methods Interpolating Raster Surfaces with
Anomaly Density Mapping: Lowry AGGR Site Demonstration Report
 Environmental Security Technology Certification Program ESTCP Anomaly Density Mapping: Lowry AGGR Site Demonstration Report ESTCP Project # 200325 Final Report 09/30/2006 Sean A. McKenna Sandia National
Numerical Methods Lecture 7 - Statistics, Probability and Reliability
 Topics Numerical Methods Lecture 7 - Statistics, Probability and Reliability A summary of statistical analysis A summary of probability methods A summary of reliability analysis concepts Statistical Analysis
A MultiGaussian Approach to Assess Block Grade Uncertainty
 A MultiGaussian Approach to Assess Block Grade Uncertainty Julián M. Ortiz 1, Oy Leuangthong 2, and Clayton V. Deutsch 2 1 Department of Mining Engineering, University of Chile 2 Department of Civil &
Correcting Variogram Reproduction of P-Field Simulation
 Correcting Variogram Reproduction of P-Field Simulation Julián M. Ortiz (jmo1@ualberta.ca) Department of Civil & Environmental Engineering University of Alberta Abstract Probability field simulation is
Estimation of direction of increase of gold mineralisation using pair-copulas
 22nd International Congress on Modelling and Simulation, Hobart, Tasmania, Australia, 3 to 8 December 2017 mssanz.org.au/modsim2017 Estimation of direction of increase of gold mineralisation using pair-copulas
Computational Challenges in Reservoir Modeling. Sanjay Srinivasan The Pennsylvania State University
 Computational Challenges in Reservoir Modeling Sanjay Srinivasan The Pennsylvania State University Well Data 3D view of well paths Inspired by an offshore development 4 platforms 2 vertical wells 2 deviated
SPATIAL VARIABILITY OF AVAILABLE NUTRIENTS AND SOIL CARBON UNDER ARABLE CROPPING IN CANTERBURY
 SPATIAL VARIABILITY OF AVAILABLE NUTRIENTS AND SOIL CARBON UNDER ARABLE CROPPING IN CANTERBURY Weiwen Qiu, Denis Curtin and Mike Beare The New Zealand Institute for Plant & Food Research Limited, Private
Time-lapse filtering and improved repeatability with automatic factorial co-kriging. Thierry Coléou CGG Reservoir Services Massy
 Time-lapse filtering and improved repeatability with automatic factorial co-kriging. Thierry Coléou CGG Reservoir Services Massy 1 Outline Introduction Variogram and Autocorrelation Factorial Kriging Factorial
Concepts and Applications of Kriging. Eric Krause
 Concepts and Applications of Kriging Eric Krause Sessions of note Tuesday ArcGIS Geostatistical Analyst - An Introduction 8:30-9:45 Room 14 A Concepts and Applications of Kriging 10:15-11:30 Room 15 A
Advanced analysis and modelling tools for spatial environmental data. Case study: indoor radon data in Switzerland
 EnviroInfo 2004 (Geneva) Sh@ring EnviroInfo 2004 Advanced analysis and modelling tools for spatial environmental data. Case study: indoor radon data in Switzerland Mikhail Kanevski 1, Michel Maignan 1
Geostatistics: Kriging
 Geostatistics: Kriging 8.10.2015 Konetekniikka 1, Otakaari 4, 150 10-12 Rangsima Sunila, D.Sc. Background What is Geostatitics Concepts Variogram: experimental, theoretical Anisotropy, Isotropy Lag, Sill,
SUMMARIZING MEASURED DATA. Gaia Maselli
 SUMMARIZING MEASURED DATA Gaia Maselli maselli@di.uniroma1.it Computer Network Performance 2 Overview Basic concepts Summarizing measured data Summarizing data by a single number Summarizing variability
Tastitsticsss? What s that? Principles of Biostatistics and Informatics. Variables, outcomes. Tastitsticsss? What s that?
 Tastitsticsss? What s that? Statistics describes random mass phanomenons. Principles of Biostatistics and Informatics nd Lecture: Descriptive Statistics 3 th September Dániel VERES Data Collecting (Sampling)
Ø Set of mutually exclusive categories. Ø Classify or categorize subject. Ø No meaningful order to categorization.
 Statistical Tools in Evaluation HPS 41 Fall 213 Dr. Joe G. Schmalfeldt Types of Scores Continuous Scores scores with a potentially infinite number of values. Discrete Scores scores limited to a specific
Space-time data. Simple space-time analyses. PM10 in space. PM10 in time
 Space-time data Observations taken over space and over time Z(s, t): indexed by space, s, and time, t Here, consider geostatistical/time data Z(s, t) exists for all locations and all times May consider
Beta-Binomial Kriging: An Improved Model for Spatial Rates
 Available online at www.sciencedirect.com ScienceDirect Procedia Environmental Sciences 27 (2015 ) 30 37 Spatial Statistics 2015: Emerging Patterns - Part 2 Beta-Binomial Kriging: An Improved Model for
The Proportional Effect of Spatial Variables
 The Proportional Effect of Spatial Variables J. G. Manchuk, O. Leuangthong and C. V. Deutsch Centre for Computational Geostatistics, Department of Civil and Environmental Engineering University of Alberta
Relationships between Soil salinity and geopedological units in Saveh plain, Iran
 Available online at www.scholarsresearchlibrary.com Annals of Biological Research, 2012, 3 (5):2292-2296 (http://scholarsresearchlibrary.com/archive.html) ISSN 0976-1233 CODEN (USA): ABRNBW Relationships
Some practical aspects of the use of lognormal models for confidence limits and block distributions in South African gold mines
 Some practical aspects of the use of lognormal models for confidence limits and block distributions in South African gold mines by D.G. Krige* Synopsis For the purpose of determining confidence limits
Concepts and Applications of Kriging. Eric Krause Konstantin Krivoruchko
 Concepts and Applications of Kriging Eric Krause Konstantin Krivoruchko Outline Introduction to interpolation Exploratory spatial data analysis (ESDA) Using the Geostatistical Wizard Validating interpolation
SPATIAL VARIABILITY OF NITROGEN SUPPLY ASSESSED USING SOIL AND PLANT BIOASSAYS
 SPATIAL VARIABILITY OF NITROGEN SUPPLY ASSESSED USING SOIL AND PLANT BIOASSAYS Weiwen Qiu 1, Paul Johnstone 2, Dirk Wallace 1, Nathan Arnold 2, Bruce Searle 2, Joanna Sharp 1, Mike Beare 1 and Denis Curtin
J. Bio. & Env. Sci. 2014
 Journal of Biodiversity and Environmental Sciences (JBES) ISSN: 2220-6663 (Print) 2222-3045 (Online) Vol. 4, No. 5, p. 252-257, 2014 http://www.innspub.net RESEARCH PAPER OPEN ACCESS Estimating the biomass
Z score indicates how far a raw score deviates from the sample mean in SD units. score Mean % Lower Bound
 1 EDUR 8131 Chat 3 Notes 2 Normal Distribution and Standard Scores Questions Standard Scores: Z score Z = (X M) / SD Z = deviation score divided by standard deviation Z score indicates how far a raw score
Geostatistical Density Mapping
 Geostatistical Density Mapping Sean A. McKenna and Barry Roberts (SNL) Brent Pulsipher & John Hathaway (PNNL) 2008 Partners in Environmental Technology Technical Symposium & Workshop Sandia is a multiprogram
Universitat Autònoma de Barcelona Facultat de Filosofia i Lletres Departament de Prehistòria Doctorat en arqueologia prehistòrica
 Universitat Autònoma de Barcelona Facultat de Filosofia i Lletres Departament de Prehistòria Doctorat en arqueologia prehistòrica FROM MICRO TO MACRO SPATIAL DYNAMICS IN THE VILLAGGIO DELLE MACINE BETWEEN
Practical application of drill hole spacing analysis in coal resource estimation
 Practical application of drill hole spacing analysis in coal resource estimation C.M.Williams 1, K.Henderson 2 and S.Summers 2 1. HDR mining consultants, Level 23, 12 Creek Street, Brisbane, Qld, 4000
unadjusted model for baseline cholesterol 22:31 Monday, April 19,
 unadjusted model for baseline cholesterol 22:31 Monday, April 19, 2004 1 Class Level Information Class Levels Values TRETGRP 3 3 4 5 SEX 2 0 1 Number of observations 916 unadjusted model for baseline cholesterol
Types of Spatial Data
 Spatial Data Types of Spatial Data Point pattern Point referenced geostatistical Block referenced Raster / lattice / grid Vector / polygon Point Pattern Data Interested in the location of points, not their
Statistical representation of soil data
 RECOMMENDED PRACTICE DNVGL-RP-C207 Edition May 2017 The electronic pdf version of this document, available free of charge from http://www.dnvgl.com, is the officially binding version. FOREWORD DNV GL recommended
A robust statistically based approach to estimating the probability of contamination occurring between sampling locations
 A robust statistically based approach to estimating the probability of contamination occurring between sampling locations Peter Beck Principal Environmental Scientist Image placeholder Image placeholder
Traps for the Unwary Subsurface Geoscientist
 Traps for the Unwary Subsurface Geoscientist ashley.francis@sorviodvnvm.co.uk http://www.sorviodvnvm.co.uk Presented at SEG Development & Production Forum, 24-29 th June 2001, Taos, New Mexico, USA 24-29
GEOSPATIAL TECHNOLOGY FOR GROUND WATER QUALITY PARAMETERS ASSESSMENT IN AL-KIFL DISTRICT- BABYLON -IRAQ
 International Journal of Civil Engineering and Technology (IJCIET) Volume 9, Issue 8, August 2018, pp. 952-963, Article ID: IJCIET_09_08_096 Available online at http://www.iaeme.com/ijciet/issues.asp?jtype=ijciet&vtype=9&itype=8
Introduction to Statistics
 Introduction to Statistics By A.V. Vedpuriswar October 2, 2016 Introduction The word Statistics is derived from the Italian word stato, which means state. Statista refers to a person involved with the
Entropy of Gaussian Random Functions and Consequences in Geostatistics
 Entropy of Gaussian Random Functions and Consequences in Geostatistics Paula Larrondo (larrondo@ualberta.ca) Department of Civil & Environmental Engineering University of Alberta Abstract Sequential Gaussian
Investigation of Monthly Pan Evaporation in Turkey with Geostatistical Technique
 Investigation of Monthly Pan Evaporation in Turkey with Geostatistical Technique Hatice Çitakoğlu 1, Murat Çobaner 1, Tefaruk Haktanir 1, 1 Department of Civil Engineering, Erciyes University, Kayseri,
Simulating Spatial Distributions, Variability and Uncertainty of Soil Arsenic by Geostatistical Simulations in Geographic Information Systems
 Open Environmental Sciences, 2008, 2, 26-33 26 Open Access Simulating Spatial Distributions, Variability and Uncertainty of Soil Arsenic by Geostatistical Simulations in Geographic Information Systems
Data Analysis and Statistical Methods Statistics 651
 Data Analysis and Statistical Methods Statistics 651 http://www.stat.tamu.edu/~suhasini/teaching.html Boxplots and standard deviations Suhasini Subba Rao Review of previous lecture In the previous lecture
Objective A: Mean, Median and Mode Three measures of central of tendency: the mean, the median, and the mode.
 Chapter 3 Numerically Summarizing Data Chapter 3.1 Measures of Central Tendency Objective A: Mean, Median and Mode Three measures of central of tendency: the mean, the median, and the mode. A1. Mean The
Concepts and Applications of Kriging
 Esri International User Conference San Diego, California Technical Workshops July 24, 2012 Concepts and Applications of Kriging Konstantin Krivoruchko Eric Krause Outline Intro to interpolation Exploratory
A kernel indicator variogram and its application to groundwater pollution
 Int. Statistical Inst.: Proc. 58th World Statistical Congress, 2011, Dublin (Session IPS101) p.1514 A kernel indicator variogram and its application to groundwater pollution data Menezes, Raquel University
Highly Robust Variogram Estimation 1. Marc G. Genton 2
 Mathematical Geology, Vol. 30, No. 2, 1998 Highly Robust Variogram Estimation 1 Marc G. Genton 2 The classical variogram estimator proposed by Matheron is not robust against outliers in the data, nor is
Ø Set of mutually exclusive categories. Ø Classify or categorize subject. Ø No meaningful order to categorization.
 Statistical Tools in Evaluation HPS 41 Dr. Joe G. Schmalfeldt Types of Scores Continuous Scores scores with a potentially infinite number of values. Discrete Scores scores limited to a specific number
Math 120 Introduction to Statistics Mr. Toner s Lecture Notes 3.1 Measures of Central Tendency
 Math 1 Introduction to Statistics Mr. Toner s Lecture Notes 3.1 Measures of Central Tendency The word average: is very ambiguous and can actually refer to the mean, median, mode or midrange. Notation:
Acceptable Ergodic Fluctuations and Simulation of Skewed Distributions
 Acceptable Ergodic Fluctuations and Simulation of Skewed Distributions Oy Leuangthong, Jason McLennan and Clayton V. Deutsch Centre for Computational Geostatistics Department of Civil & Environmental Engineering
Geog 210C Spring 2011 Lab 6. Geostatistics in ArcMap
 Geog 210C Spring 2011 Lab 6. Geostatistics in ArcMap Overview In this lab you will think critically about the functionality of spatial interpolation, improve your kriging skills, and learn how to use several
I don t have much to say here: data are often sampled this way but we more typically model them in continuous space, or on a graph
 Spatial analysis Huge topic! Key references Diggle (point patterns); Cressie (everything); Diggle and Ribeiro (geostatistics); Dormann et al (GLMMs for species presence/abundance); Haining; (Pinheiro and
Soil Moisture Modeling using Geostatistical Techniques at the O Neal Ecological Reserve, Idaho
 Final Report: Forecasting Rangeland Condition with GIS in Southeastern Idaho Soil Moisture Modeling using Geostatistical Techniques at the O Neal Ecological Reserve, Idaho Jacob T. Tibbitts, Idaho State
Application of Copulas as a New Geostatistical Tool
 Application of Copulas as a New Geostatistical Tool Presented by Jing Li Supervisors András Bardossy, Sjoerd Van der zee, Insa Neuweiler Universität Stuttgart Institut für Wasserbau Lehrstuhl für Hydrologie
The Normal Distribution. The Gaussian Curve. Advantages of using Z-score. Importance of normal or Gaussian distribution (ND)
") Importance of normal or Gaussian distribution (ND) The Normal It is the most used distribution Most method are based on the assumption of ND Sum of many independent, random contributions variables (grain
Importance of normal or Gaussian distribution (ND) The Normal It is the most used distribution Most method are based on the assumption of ND Sum of many independent, random contributions variables (grain
Unit 1: Statistics. Mrs. Valentine Math III
 Unit 1: Statistics Mrs. Valentine Math III 1.1 Analyzing Data Statistics Study, analysis, and interpretation of data Find measure of central tendency Mean average of the data Median Odd # data pts: middle
GLOBAL SYMPOSIUM ON SOIL ORGANIC CARBON, Rome, Italy, March 2017
 GLOBAL SYMPOSIUM ON SOIL ORGANIC CARBON, Rome, Italy, 2-23 March 207 Spatial Distribution of Organic Matter Content in Plough Layer of Balikh Flood Plain Soils Northeastern of Syria Hussam H. M. Husein
Recovery Analysis Methods and Data Requirements Study
 Elevation Recovery Analysis Methods and Data Requirements Study Update to NTB Phase II Local Technical Peer Review Group December 3, 2003 Time 1 Schedule for Pumpage Reductions 180 160 140 120 158 121
GEO-INFORMATICS IN PRECISION AGRICULTURE: STATISTICAL ASPECT
 Geo-Informatics in Precision Agriculture: Statistical Aspect Proceedings of AIPA 202, INDIA 29 GEO-INFORMATICS IN PRECISION AGRICULTURE: STATISTICAL ASPECT Anshu Bharadwaj and Shashi Dahiya Indian Agricultural
ENVIRONMENTAL MONITORING Vol. II - Geostatistical Analysis of Monitoring Data - Mark Dowdall, John O Dea GEOSTATISTICAL ANALYSIS OF MONITORING DATA
 GEOSTATISTICAL ANALYSIS OF MONITORING DATA Mark Dowdall Norwegian Radiation Protection Authority, Environmental Protection Unit, Polar Environmental Centre, Tromso, Norway John O Dea Institute of Technology,
SPATIAL-TEMPORAL TECHNIQUES FOR PREDICTION AND COMPRESSION OF SOIL FERTILITY DATA
 SPATIAL-TEMPORAL TECHNIQUES FOR PREDICTION AND COMPRESSION OF SOIL FERTILITY DATA D. Pokrajac Center for Information Science and Technology Temple University Philadelphia, Pennsylvania A. Lazarevic Computer
Concepts and Applications of Kriging
 2013 Esri International User Conference July 8 12, 2013 San Diego, California Technical Workshop Concepts and Applications of Kriging Eric Krause Konstantin Krivoruchko Outline Intro to interpolation Exploratory
An Introduction to Pattern Statistics
 An Introduction to Pattern Statistics Nearest Neighbors The CSR hypothesis Clark/Evans and modification Cuzick and Edwards and controls All events k function Weighted k function Comparative k functions
Basics of Experimental Design. Review of Statistics. Basic Study. Experimental Design. When an Experiment is Not Possible. Studying Relations
 Basics of Experimental Design Review of Statistics And Experimental Design Scientists study relation between variables In the context of experiments these variables are called independent and dependent
STATISTICS. 1. Measures of Central Tendency
 STATISTICS 1. Measures o Central Tendency Mode, median and mean For a sample o discrete data, the mode is the observation, x with the highest requency,. 1 N F For grouped data in a cumulative requency
KEYWORDS : Indoor radon mapping, radon risk map, nugget effect, radon potential
 The radon noise and its geostatistical implications: risk mapping or mapping at risk? G. Dubois and P. Bossew European Commission DG Joint Research Centre, Institute for Environment and Sustainability,
-However, this definition can be expanded to include: biology (biometrics), environmental science (environmetrics), economics (econometrics).
, environmental science (environmetrics), economics (econometrics).") Chemometrics Application of mathematical, statistical, graphical or symbolic methods to maximize chemical information. -However, this definition can be expanded to include: biology (biometrics), environmental
Chemometrics Application of mathematical, statistical, graphical or symbolic methods to maximize chemical information. -However, this definition can be expanded to include: biology (biometrics), environmental
Precision Ag Services
 Precision Ag Services PRECISION AGRICULTURE SERVICES AVAILABLE Yield Mapping, Data Analysis, Data Storage, Data Processing The key to precision agriculture is the data. Many systems and software packages
2/2/2015 GEOGRAPHY 204: STATISTICAL PROBLEM SOLVING IN GEOGRAPHY MEASURES OF CENTRAL TENDENCY CHAPTER 3: DESCRIPTIVE STATISTICS AND GRAPHICS
 Spring 2015: Lembo GEOGRAPHY 204: STATISTICAL PROBLEM SOLVING IN GEOGRAPHY CHAPTER 3: DESCRIPTIVE STATISTICS AND GRAPHICS Descriptive statistics concise and easily understood summary of data set characteristics
Spatial Interpolation
 Topic 4 Spatial Interpolation 4.1 From Point Samples to Map Surfaces Soil sampling has long been at the core of agricultural research and practice. Traditionally point-sampled data were analyzed by non-spatial
Mapping the Spatial Variability of Groundwater Quality in Urmia, Iran
 Mapping the Spatial Variability of Groundwater Quality in Urmia, Iran R. Taghizadeh-Mehrjardi Faculty of Agriculture and Natural Resources, University of Ardakan, PO BOX: 89515-147, Yazd, Iran Received
Statistical Evaluations in Exploration for Mineral Deposits
 Friedrich-Wilhelm Wellmer Statistical Evaluations in Exploration for Mineral Deposits Translated by D. Large With 120 Figures and 74 Tables Springer Preface The Most Important Notations and Abbreviations
Modeling Uncertainty in the Earth Sciences Jef Caers Stanford University
 Probability theory and statistical analysis: a review Modeling Uncertainty in the Earth Sciences Jef Caers Stanford University Concepts assumed known Histograms, mean, median, spread, quantiles Probability,
Describing distributions with numbers
 Describing distributions with numbers A large number or numerical methods are available for describing quantitative data sets. Most of these methods measure one of two data characteristics: The central
Estimation or stochastic simulation in soil science?
 Estimation or stochastic simulation in soil science? Castrignanò A., Lopez N., Prudenzano M., Steduto P. in Zdruli P. (ed.), Steduto P. (ed.), Kapur S. (ed.). 7. International meeting on Soils with Mediterranean
Application and evaluation of universal kriging for optimal contouring of groundwater levels
 Application and evaluation of universal kriging for optimal contouring of groundwater levels B V N P Kambhammettu 1,, Praveena Allena 2, and JamesPKing 1, 1 Civil Engineering Department, New Mexico State
Exploratory Data Analysis. CERENA Instituto Superior Técnico
 Exploratory Data Analysis CERENA Instituto Superior Técnico Some questions for which we use Exploratory Data Analysis: 1. What is a typical value? 2. What is the uncertainty around a typical value? 3.
Univariate Data Presentation: The Contouring Conundrum and Philosophical Arguments Regarding the Contouring of Geochemical Data Clifford R.
 Univariate Data Presentation: The Contouring Conundrum and Philosophical Arguments Regarding the Contouring of Geochemical Data Clifford R. Stanley Dept. of Geology, Acadia University, Wolfville, Nova
Influence of parameter estimation uncertainty in Kriging: Part 2 Test and case study applications
 Hydrology and Earth System Influence Sciences, of 5(), parameter 5 3 estimation (1) uncertainty EGS in Kriging: Part Test and case study applications Influence of parameter estimation uncertainty in Kriging:
Scientific registration nº 2293 Symposium nº 17 Presentation : poster. VIEIRA R. Sisney 1, TABOADA Teresa 2, PAZ Antonio 2
 Scientific registration nº 2293 Symposium nº 17 Presentation : poster An assessment of heavy metal variability in a one hectare plot under natural vegetation in a serpentine area Evaluation de la variabilité
Luc Anselin Spatial Analysis Laboratory Dept. Agricultural and Consumer Economics University of Illinois, Urbana-Champaign
 GIS and Spatial Analysis Luc Anselin Spatial Analysis Laboratory Dept. Agricultural and Consumer Economics University of Illinois, Urbana-Champaign http://sal.agecon.uiuc.edu Outline GIS and Spatial Analysis
Is there still room for new developments in geostatistics?
 Is there still room for new developments in geostatistics? Jean-Paul Chilès MINES ParisTech, Fontainebleau, France, IAMG 34th IGC, Brisbane, 8 August 2012 Matheron: books and monographs 1962-1963: Treatise
Lecture 2. Quantitative variables. There are three main graphical methods for describing, summarizing, and detecting patterns in quantitative data:
 Lecture 2 Quantitative variables There are three main graphical methods for describing, summarizing, and detecting patterns in quantitative data: Stemplot (stem-and-leaf plot) Histogram Dot plot Stemplots
An Introduction to Spatial Autocorrelation and Kriging
 An Introduction to Spatial Autocorrelation and Kriging Matt Robinson and Sebastian Dietrich RenR 690 Spring 2016 Tobler and Spatial Relationships Tobler s 1 st Law of Geography: Everything is related to
A Little Stats Won t Hurt You
 A Little Stats Won t Hurt You Nate Derby Statis Pro Data Analytics Seattle, WA, USA Edmonton SAS Users Group, 11/13/09 Nate Derby A Little Stats Won t Hurt You 1 / 71 Outline Introduction 1 Introduction
Substitution Random Fields with Gaussian and Gamma Distributions: Theory and Application to a Pollution Data Set
 Substitution Random Fields with Gaussian and Gamma Distributions: Theory and Application to a Pollution Data Set Xavier Emery Abstract This paper presents random field models with Gaussian or gamma univariate
GIST 4302/5302: Spatial Analysis and Modeling
 GIST 4302/5302: Spatial Analysis and Modeling Basics of Statistics Guofeng Cao www.myweb.ttu.edu/gucao Department of Geosciences Texas Tech University guofeng.cao@ttu.edu Spring 2015 Outline of This Week
Autonomous Navigation for Flying Robots
 Computer Vision Group Prof. Daniel Cremers Autonomous Navigation for Flying Robots Lecture 6.2: Kalman Filter Jürgen Sturm Technische Universität München Motivation Bayes filter is a useful tool for state
Mapping the Spatial Variability of Soil Acidity in Zambia
 Agronomy 2014, 4, 452-461; doi:10.3390/agronomy4040452 Article OPEN ACCESS agronomy ISSN 2073-4395 www.mdpi.com/journal/agronomy Mapping the Spatial Variability of Soil Acidity in Zambia Lydia M. Chabala
Frequency Distribution Cross-Tabulation
 Frequency Distribution Cross-Tabulation 1) Overview 2) Frequency Distribution 3) Statistics Associated with Frequency Distribution i. Measures of Location ii. Measures of Variability iii. Measures of Shape
Geostatistical analysis of surface soil texture from Zala county in western Hungary
 Geostatistical analysis of surface soil texture from Zala county in western Hungary K. Adhikari *,**, A. Guadagnini **, G. Toth * and T. Hermann *** * Land Management and Natural Hazards Unit, Institute
Lab #3 Background Material Quantifying Point and Gradient Patterns
 Lab #3 Background Material Quantifying Point and Gradient Patterns Dispersion metrics Dispersion indices that measure the degree of non-randomness Plot-based metrics Distance-based metrics First-order
Tricks to Creating a Resource Block Model. St John s, Newfoundland and Labrador November 4, 2015
 Tricks to Creating a Resource Block Model St John s, Newfoundland and Labrador November 4, 2015 Agenda 2 Domain Selection Top Cut (Grade Capping) Compositing Specific Gravity Variograms Block Size Search
The presentation is entitled ANISOTROPY OF THE ROCK QUALITY DESIGNATION & ITS GEOSTATISTICAL EVALUATION».
 It is my pleasure to present the work done jointly by my collaborator Doctor Serge Séguret from France, and myself, on data provided by my team and by my colleague Claudio Rojas The presentation is entitled
Section 4.4 Z-Scores and the Empirical Rule
 Section 4.4 Z-Scores and the Empirical Rule 1 GPA Example A sample of GPAs of 40 freshman college students appear below (sorted in increasing order) 1.40 1.90 1.90 2.00 2.10 2.10 2.20 2.30 2.30 2.40 2.50
Spatial variation of soil and plant properties and its effects on the statistical design of a field experiment
 S. Afr. J. Plant Soil 009, () Spatial variation of soil and plant properties and its effects on the statistical design of a field experiment A.Venter *, M.F. Smith, D.J.Beukes, A.S. Claassens and M. Van
IUPAC Provisional Recommendations
 INTERNATIONAL UNION OF PURE AND APPLIED CHEMISTRY ANALYTICAL CHEMISTRY DIVISION TERMINOLOGY IN SOIL SAMPLING (IUPAC Recommendations 2003) Prepared for publication by PAOLO DE ZORZI 1, SABRINA BARBIZZI
Review of Statistics
 Review of Statistics Topics Descriptive Statistics Mean, Variance Probability Union event, joint event Random Variables Discrete and Continuous Distributions, Moments Two Random Variables Covariance and